0583
Whole body 3.0 T MRI in Adult Lymphomas: Assessment of Quantitative Imaging Biomarkers for Nodal Disease Assessment1Centre for Medical Imaging, University College London, Lodon, United Kingdom, 2University College London Hospital, London, United Kingdom, 3Univesriy College London Hospital, London, United Kingdom
Synopsis
Whole-body MRI (WB-MRI) is being increasingly advocated as an alternative/adjunct imaging platform in range of cancers including lymphomas. In this study we investigated the application of quantitative imaging biomarkers (QIBs) from a multi-parametric WB-MRI protocol for nodal disease assessment in adults’ lymphomas. We have shown that signal fat fraction (sFF) is more accurate for delineation of positive and/or negative disease compared to apparent diffusion coefficient (ADC) and might be a useful addition to widely used ADC quantitation.
Introduction
Nodal characterisation using whole body MRI (WB-MRI) is predominantly based on size criteria [1]. Although quantitative imaging biomarkers (QIBs) have shown promise for disease assessment beyond simple size measurement, their clinical applicability is yet to be proven.Diffusion weighted imaging’s (DWI) apparent diffusion coefficient (ADC) is the most widely used WB-MRI’s QIB in lymphomas. It is shown that compared to healthy lymph nodes, ADC decreases in lymphomatous nodes due to increased cellularity [2]. However, there is a considerable overlap between lymphomatous and normal appearing nodes and ADC is less effective to discriminate sub-centimetre lymphomatous nodes from non-involved lymph nodes [3]. Additionally, ADC is known to be highly dependant on DWI’s sequence parameters, fat suppression technique and the MRI platform making its generalisability limited [4]. Recently, signal fat action (sFF) from Dixon based MRI technique has shown utilities for bone disease assessment [5] and classification of nodal disease in prostate cancer [6], highlighting its possible applicability in lymphomas.In this study, we investigated WB-MRI’s QIBs for nodal disease assessment in patients with biopsy proven Hodgkin’s and diffuse large b-cell lymphoma (HL and DLBCL).Materials and Methods
Twenty-four biopsy proven HL (n=14) and DLBCL (n=10) patients (male/female 13/11, median age 38.5, range 22-87)and fifteen healthy volunteers (male/female 8/7, median age 37, range 29-58) were prospectively recruited and underwent 3.0 T WB-MRI. Axial T2-weighted turbo-spin-echo (TSE), axial DWI (with 4 b-values including b0, b100, b300 and b1000), dynamic-contrast-enhanced (DCE) MRI of liver/spleen and contrast-enhanced (CE) lung MRI were supplemented by coronal pre- and post-contrast mDixon imaging in patients (Figure 1). For volunteers, using the same sequence parameters, axial DWI and pre-contrast mDixon sequences were acquired.All patients were also scanned using conventional imaging as per local hospital guideline (predominantly based on 18F-FDG PET-CT).WB-MRIs were reviewed by two radiologists, separately and then in consensus whilst conventional imaging was reviewed by two nuclear medicine physicians in consensus. A retrospective enhanced-reference-standard (ERS) was derived by an expert panel who had access to all available baseline and follow-up imaging/non-imaging data and lymph nodes were assigned into positive and negative according to ERS. For volunteer cohort, 2 nodes on either side of diagram, visible on matched DWI and pre-contrast mDixon were chosen for further analysis. Nodal size was assessed using short-axis-diameter (SAD). In both patients and volunteers the nodal QIBs were derived using signal intensities (SIs) on a single slice demonstrating greatest restricted diffusion on DWI and matched to the pre-contrast mDixon as below: 1- Fast ADC (fADC): Mono-exponential curve fitting of b0 and b100 SIs 2- Slow ADC (sADC): Mono-exponential curve fitting of b300 and b1000 SIs 3- Median ADC (mADC): Mono-exponential curve fitting of b0, b100, b300 and b1000 4- sFF: fat-only mDixon SI/ (water-only + fat-only mDixon SI) * 100 [5] All ADC maps were generated using the scanner interface and images were analysed on Osirix. The difference for QIBs between positive and negative lymph nodes in patients and between negative nodes and healthy volunteers’ nodes were assessed using Mann-Whitney U test. Biomarkers’ receiver operating characteristic (ROC) and area under the curve (AUC) analysis was conducted to assess the ability of each QIB for delineation of positive and negative nodes in patients.Results
Using the ERS, there were 52 measurable positive nodes (median SAD 14.2mm range 7-31 mm), 30 measurable negative nodes (median SAD 7.4mm, range 5.2-11 mm) in patients and 27 measurable nodes (median SAD 6.5mm, range 5.1-8.6 mm) in healthy volunteers matched on DWI and pre-contrast mDixon WB-MRI.An example of positive and negative node in patient and healthy volunteer is depicted in Figure 2.Figure 3 and 4 represent comparison between positive and negative lymph nodes in patient cohort and between negative lymph nodes in patients and lymph nodes in healthy volunteers, respectively. ROC-AUC analysis for each QIB is presented in Figure 5. A cut-off value of sFF > 32.4% can distinguish between negative and positive nodes with sensitivity and specificity of 93.3% and 94.2%.Discussion and Conclusions
In this study and in line with previous publications we have shown a statistically significant decrease in ADC for positive nodes compared to negative lymph nodes [3]. However, there was also a considerable overlap between these groups resulting in a relatively poor AUC (0.63-0.69). We also showed a significant decrease in sFF in positive compared to negative lymph nodes with a higher AUC (0.97), emphasising the potential application of sFF for nodal characterisation at baseline and following treatment in patients with lymphoma.Acknowledgements
No acknowledgement found.References
[1] Punwani S, Taylor SA, Bainbridge A, et al. Pediatric and Aadolescent lymphoma: comparison of whole-body STIR half-Fourier RARE MR imaging with an enhanced PET/CT reference for initial staging. Radiology. 2010;255(1): 182-190. [2]Kwee TC, Ludwig I, Uiterwaal et al. ADC measurements in the evaluation of lymph nodes in patients with non-Hodgkin lymphoma: feasibility study. MAGMA. 2011;24(1):1-8. [3] Perrone A, Guerrisi P, Izzo L, et al. Diffusion-weighted MRI in cervical lymph nodes: Differentiation between benign and malignant lesions. Eur J Radiol. 2011;77(2):281-286. [4] Fedeli L, Belli G, Ciccarone A, et al. Dependence of apparent diffusion coefficient measurement on diffusion gradient direction and spatial position - A quality assurance intercomparison study of forty-four scanners for quantitative diffusion-weighted imaging. Phys Med. 2018; pii: S1120-1797(18)31169-4. doi: 10.1016/j.ejmp.2018.09.007. [Epub ahead of print] [5] Latifoltojar A, Hall-Craggs M, Bainbridge A, et al. Whole-body MRI quantitative biomarkers are associated significantly with treatment response in patients with newly diagnosed symptomatic multiple myeloma following bortezomib induction. Eur Rdaiol. 2017;27(12):5325-5336. [6] Appayya BM, O’Callaghan J, Latifoltojar A, et al. Quantitative mDixon Fat Fraction can differentiate metastatic nodes from benign nodes in prostate cancer patients. Proceedings of the joint annual meeting of the International Society of Magnetic Resonance in Medicine (ISMRM) Paris, France June 2018Figures
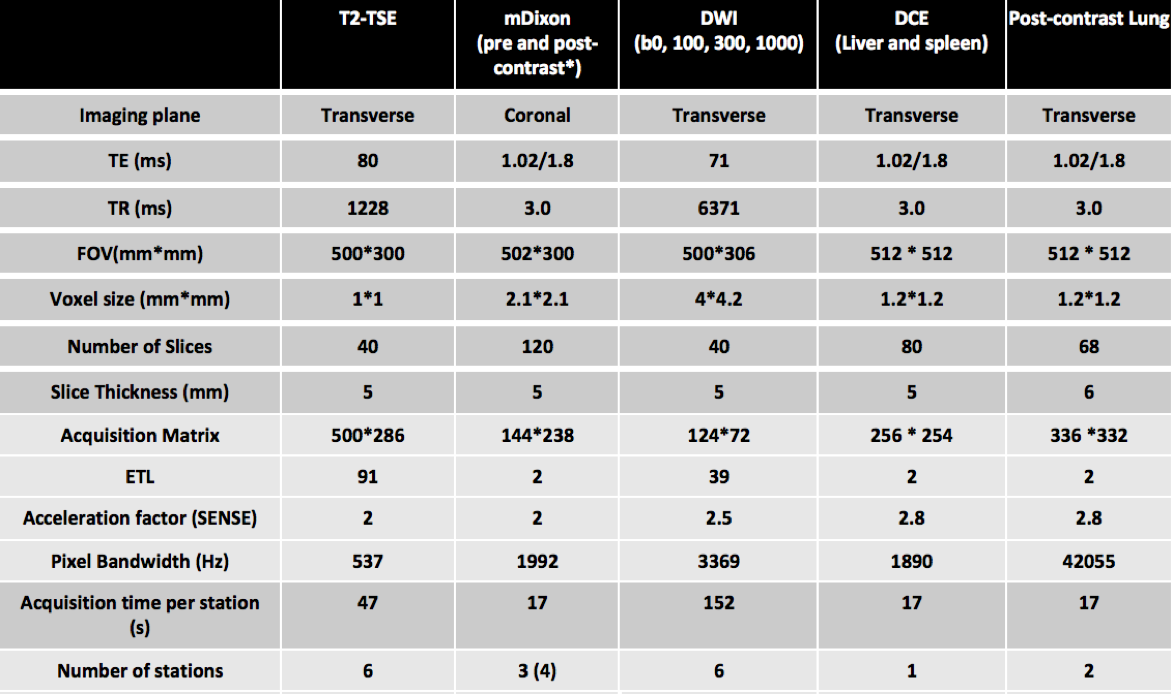
Fig.1:
T2-TSE:T2-weighted Turbo Spin Echo, mDixon:modified Dixon, DWI:diffusion Weighted Imaging, DCE:dynamic contrast enhanced, TE:time of echo, TR:time of repetition, FOV:field of view, ETL:echo train Length, SENSE:sensitivity encoding. * Contrast agent 20 ml intravenous gadoterate meglumine, Dotarem, Guerbet, France
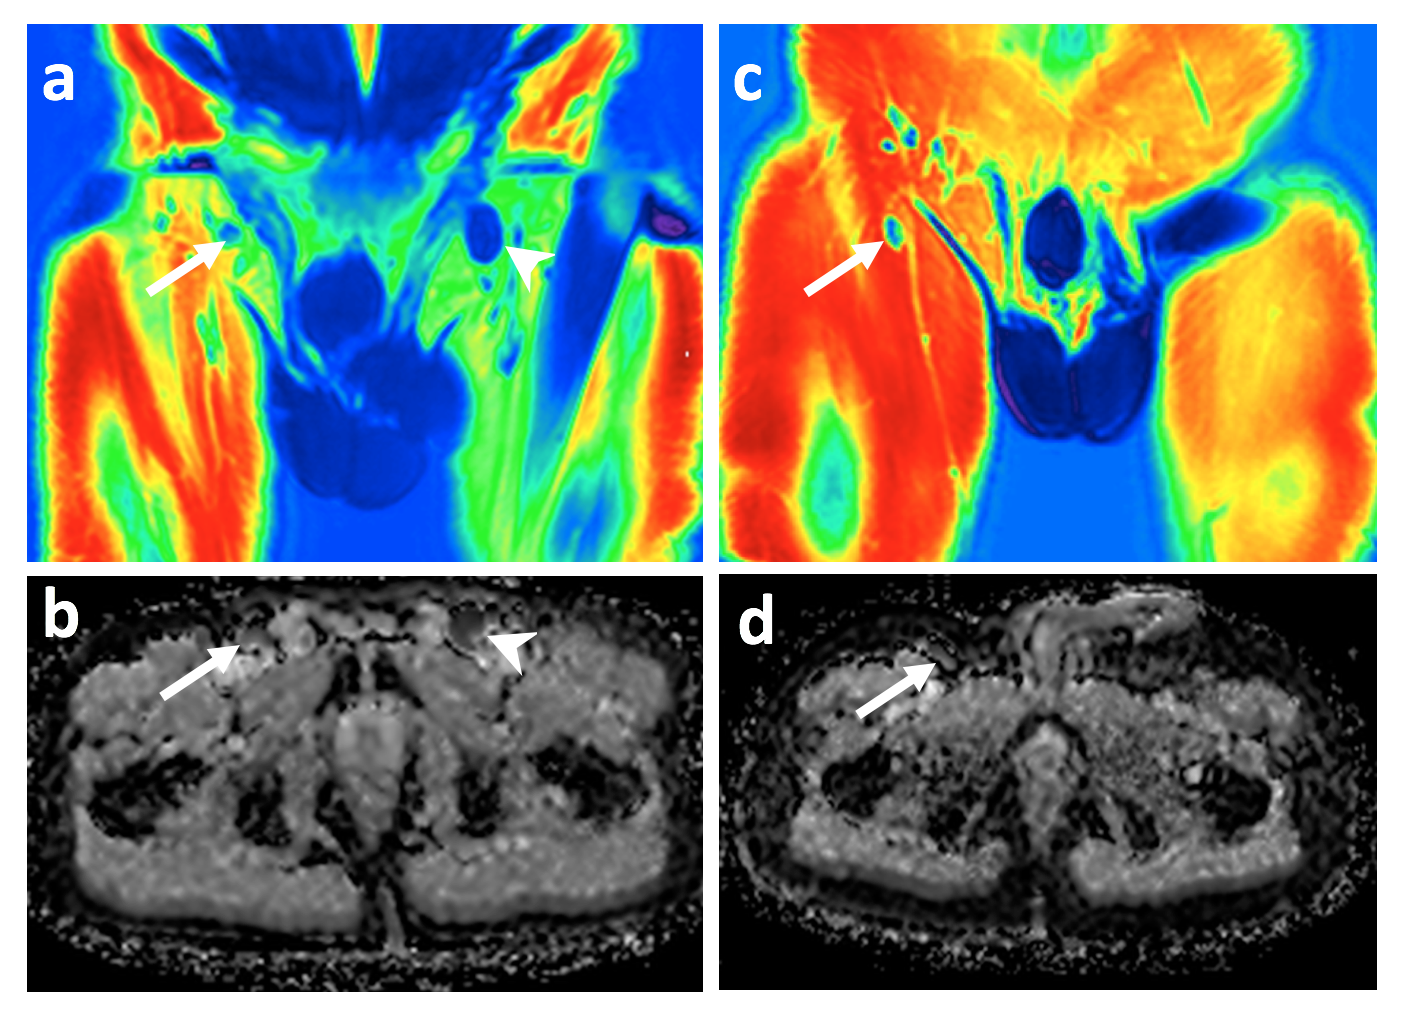
Fig.2:
Figure showing signal fat fraction (sFF) and mean apparent diffusion coefficient (mADC) images through pelvis in a patient with Hodgkin’s lymphoma (a and b) and a healthy volunteer.Positive left inguinal nodal disease on sFF (a, arrow head) and mADC (b, arrow head) and negative right inguinal node on sFF (a, arrow) and mADC (b, arrow) are shown for patient.Right inguinal node on sFF (c, arrow) and mADC (d, arrow head) are shown forhealthy volunteer.
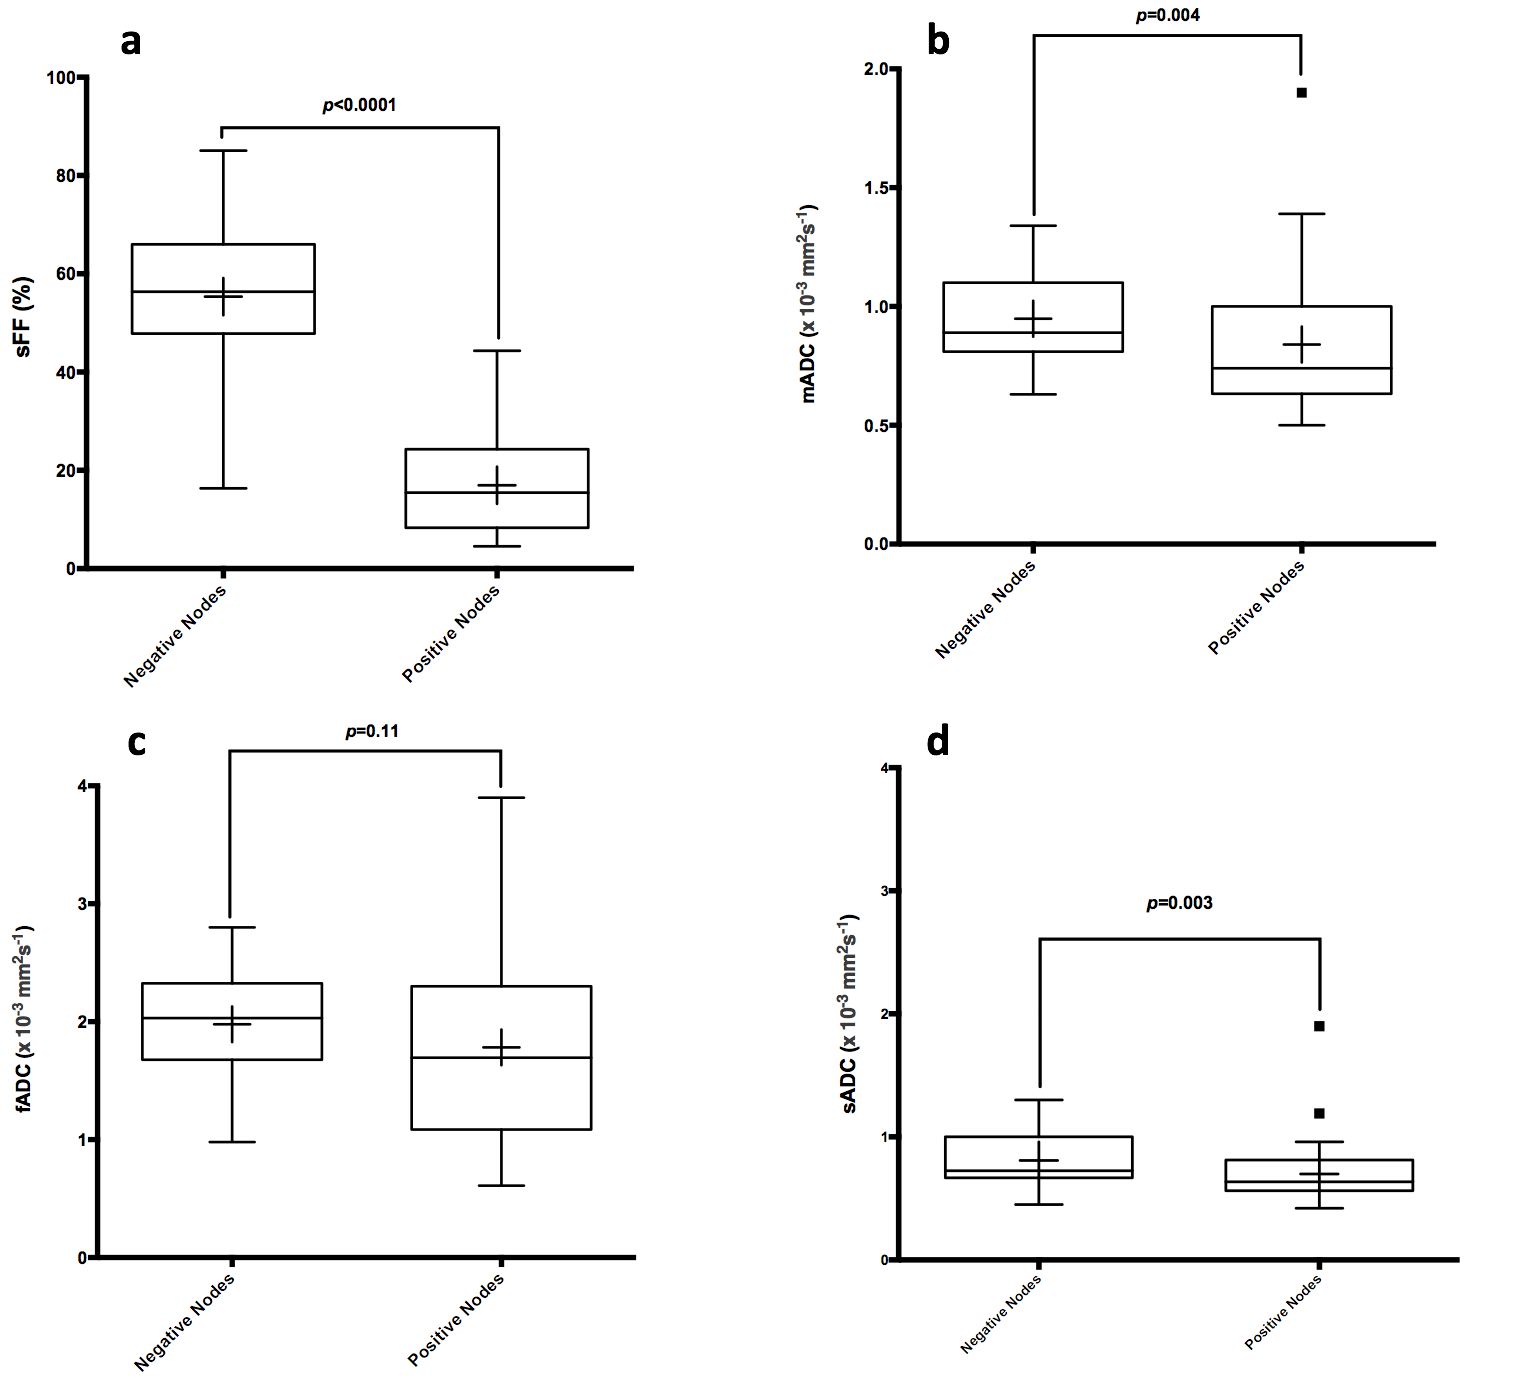
Fig.3:
(a) Median (interquartile range (IQR)) of sFF was 56.3% (47.8%-66.0%) and 15.5% (8.3%-24.3%) for negative and positive nodes, respectively. (b) Median (IQR) of mADC was 0.89 x 10⁻³ mm2s-1(0.81-1.10 x 10⁻³ mm2s-1) and 0.74x 10⁻³ mm2s-1(0.63-1.0 x 10⁻³ mm2s-1) for negative and positive nodes, respectively. (c)Median (IQR) of fADC was 2.0 x 10⁻³ mm2s-1(1.68-2.32 x 10⁻³ mm2s-1) and 1.69 x 10⁻³ mm2s-1(1.08-2.30 x 10⁻³ mm2s-1) for negative and positive nodes, respectively.(d)Median (IQR) of sADC was 0.72 x 10⁻³ mm2s-1(0.67-1.00 x 10⁻³ mm2s-1) and 0.63 x 10⁻³ mm2s-1(0.56-0.81 x 10⁻³ mm2s-1) for negative and positive nodes, respectively.
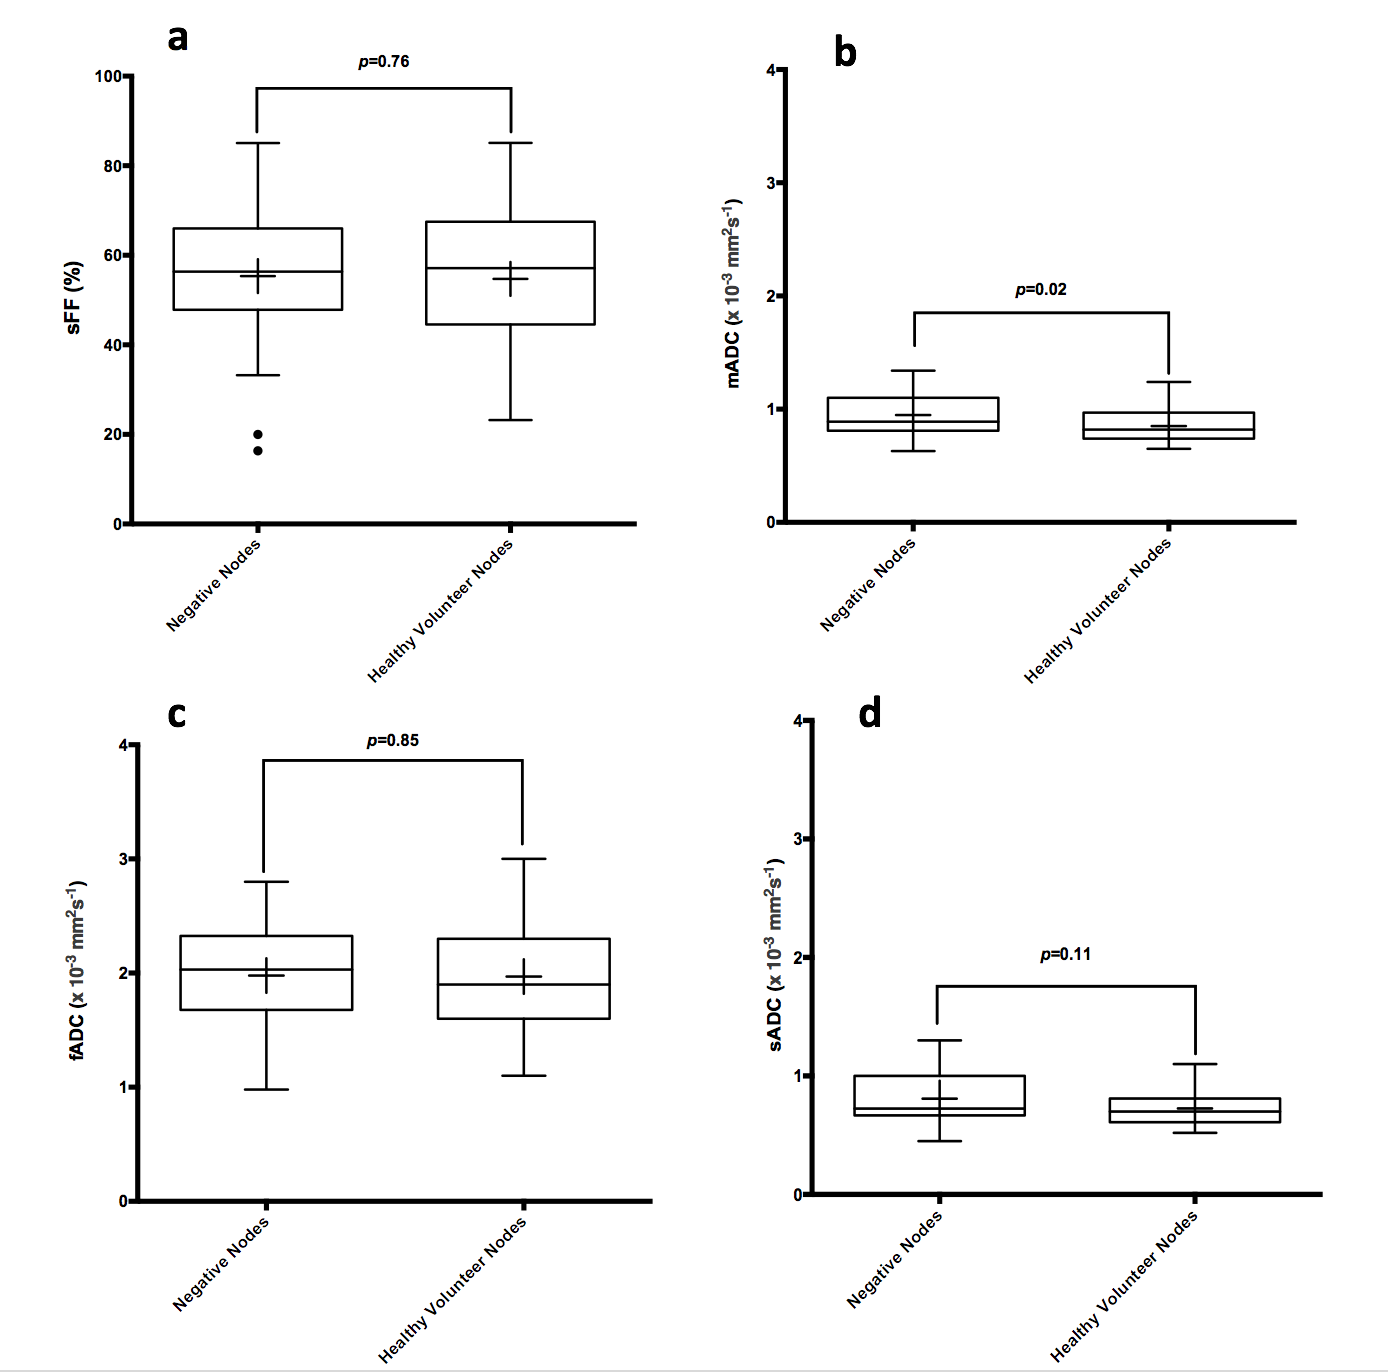
Fig.4:
(a) Median (IQR) of sFF was 56.3% (47.8%-66.0%) and 57.1% (44.5%-67.5%) for negative and healthy volunteers' nodes, respectively. (b) Median (IQR) of mADC was 0.89 x 10⁻³ mm2s-1(0.81-1.10 x 10⁻³ mm2s-1) and 0.82x 10⁻³ mm2s-1(0.74-0.97 x 10⁻³ mm2s-1) for negative and healthy volunteers' nodes, respectively. (c) Median (IQR) of fADC was 2.0 x 10⁻³ mm2s-1(1.68-2.32 x 10⁻³ mm2s-1) and 1.9 x 10⁻³ mm2s-1(1.60-2.30 x 10⁻³ mm2s-1)for negative and healthy volunteers' nodes, respectively. (d) Median (IQR) of sADC was 0.72 x 10⁻³ mm2s-1(0.67-1.00 x 10⁻³ mm2s-1) and 0.70 x 10⁻³ mm2s-1(0.61-0.81 x 10⁻³ mm2s-1) for negative and healthy volunteers' nodes, respectively.
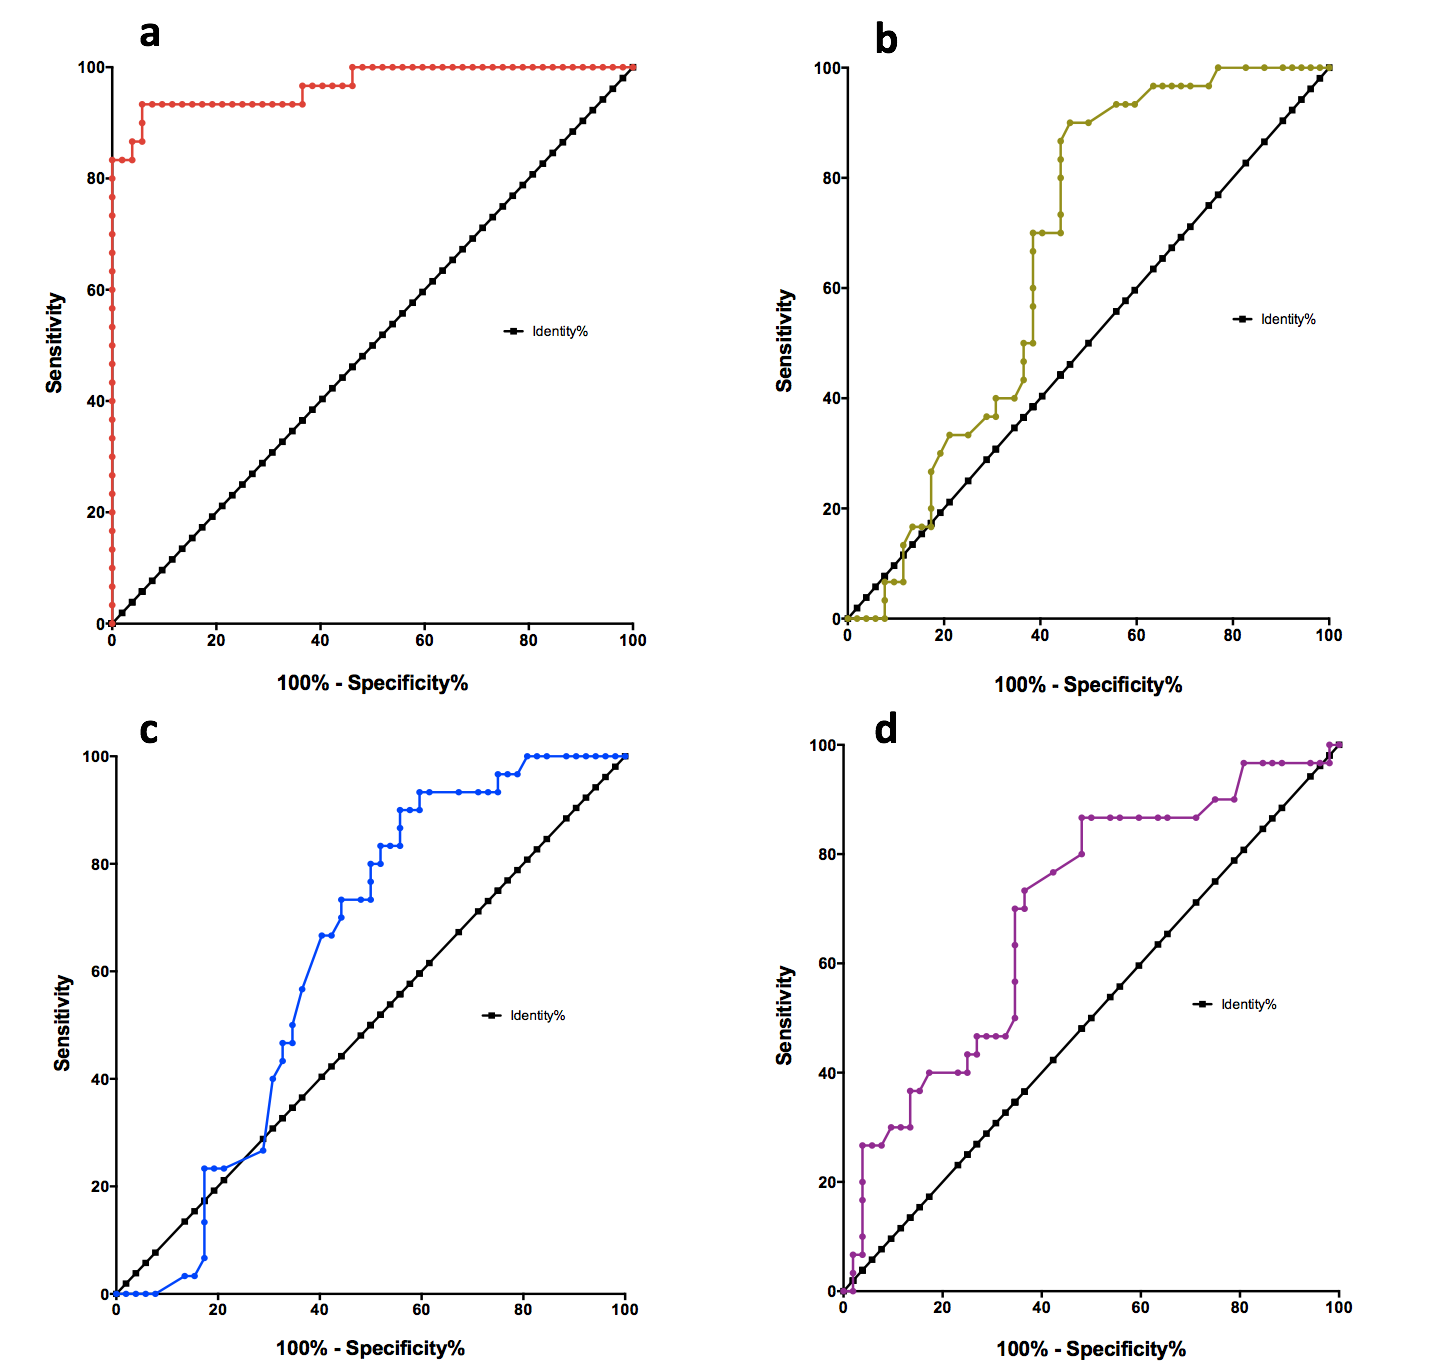
Fig.5:
(a) signal fat fraction AUC was 0.97 (95%CI: 0.93-1.00) compared to (b) AUC of 0.67 (95%CI: 0.5-0.78) for mean apparent diffusion coefficient (mADC), (c) AUC of 0.63 (95%CI:0.51-0.75) for fast ADC (fADC) and (d) AUC of 0.69 (95%CI: 0.57-0.81) for slow ADC (sADC).