0582
Tomoelastography for the detection and characterization of liver tumors1Department of Radiology, Charité-Universitätsmedizin Berlin, Berlin, Germany, 2Institute of Medical Informatics, Charité-Universitätsmedizin Berlin, Berlin, Germany
Synopsis
Tomoelastography is a full field-of-view multifrequency MR elastography technique for high-resolution mapping of stiffness and viscosity of in-vivo tissues. We applied tomoelastography to patients with hepatic lesions and analyzed the accuracy of the method for tumor detection (contrast between lesion and liver tissue) and characterization (difference between malignant and benign tumors). Our results show that shear-wave-speed and phase angle of the complex shear modulus have good accuracy for detection (AUC=0.90 and 0.93, respectively) and characterization (AUC=0.92 and 0.88, respectively) of hepatic lesions. Tomoelastography can add important quantitative information about the biophysical constitution of liver tumors.
Introduction
Liver cancer is the third leading cause of cancer death worldwide.1 Therefore, detection of hepatic tumors is a major task in clinical MRI. Precise tumor characterization and accurate diagnosis still requires invasive biopsy for histopathological analysis. MR elastography2 is as reproducible quantitative MRI method that provides an imaging biomarker for clinical tumor characterization and diagnosis of different tumor entities based on mechanical tissue properties. Nonetheless, MRE of liver tumors is still in its infancy.3-5 The aim of this study was to map abdominal stiffness and viscosity by tomoelastography, i.e. full field-of-view multifrequency MRE,6 for detection and characterization of hepatic tumors.Method
65 patients with 126 tumors (19 hepatocellular carcinoma-HCC, 12 cholangiocellular carcinoma-CCA, 60 metastases-MET, 11 hepatic hemangioma-HEM, 10 focal nodular hyperplasia-FNH and 14 hepatic adenoma-ADE) were examined. MRE was performed on a 1.5T MRI scanner (Magnetom Aera, Siemens, Germany) using single-shot spin-echo EPI as detailed in7 and externally induced vibrations of 30, 40, 50 and 60Hz frequency. 15 transversal image slices with 2.7×2.7×5mm³ voxel size were acquired at eight time steps equally spaced over a full vibration cycle under free breathing. Total MRE scan time was approximately 3.5min. MRE data were postprocessed using k-MDEV providing high-resolution maps of shear wave speed c (in m/s) which relates to both elastic and viscous tissue properties.6 The phase angle of the complex shear modulus φ (in rad), which relates to viscosity and viscoelastic dispersion, was reconstructed by the MDEV method.8 Statistical analyses were performed for both detection (i.e. distinguishing tumors from normal appearing liver tissue) and characterization (i.e. distinguishing malignant tumors from benign tumors and HEM). For characterization, we focused on malignant and benign tumors without HEM since latter have high T2-intensity and do not impose clinical-diagnostic challenges.9Results
Detection
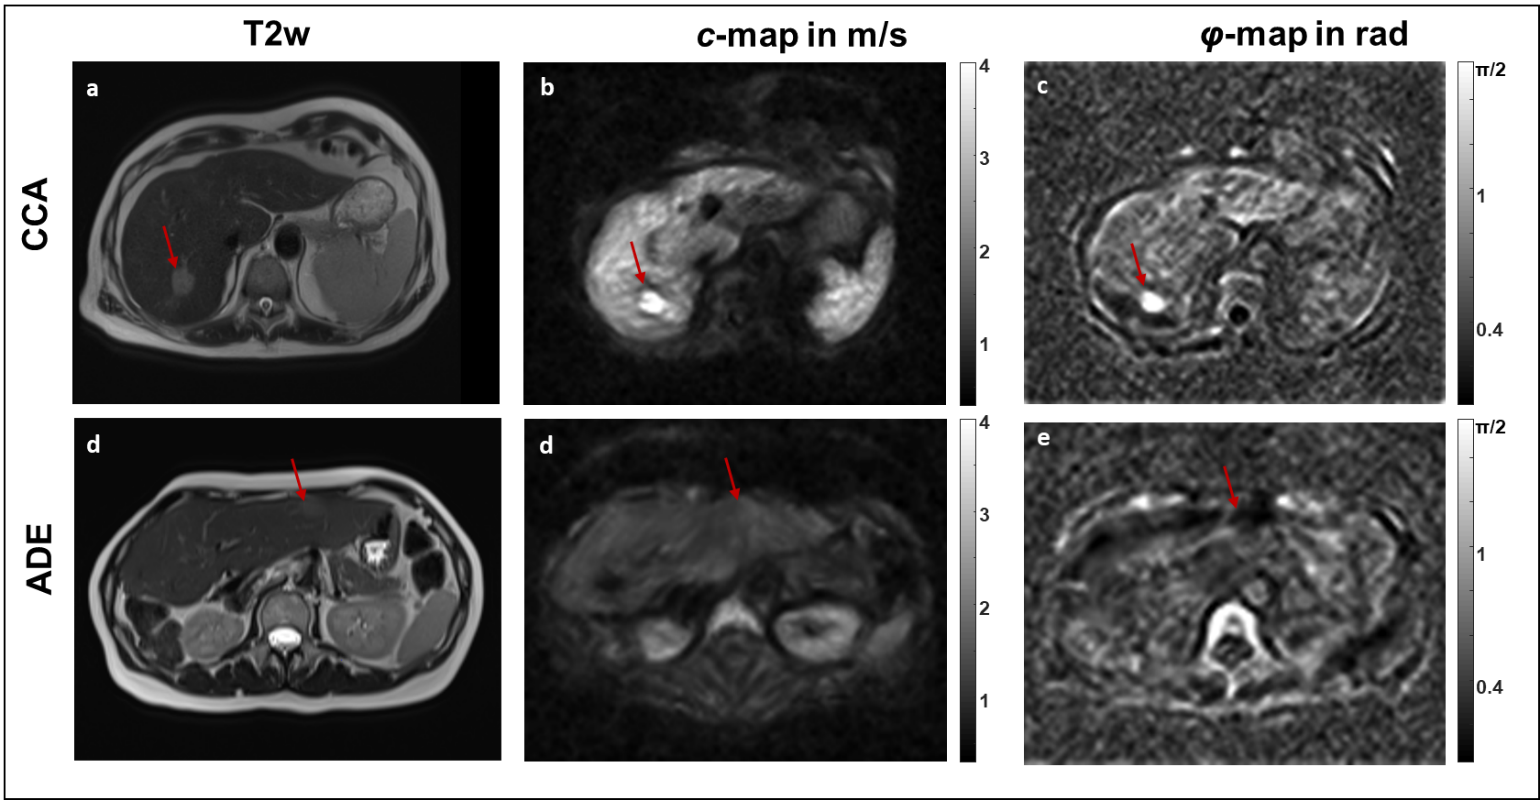
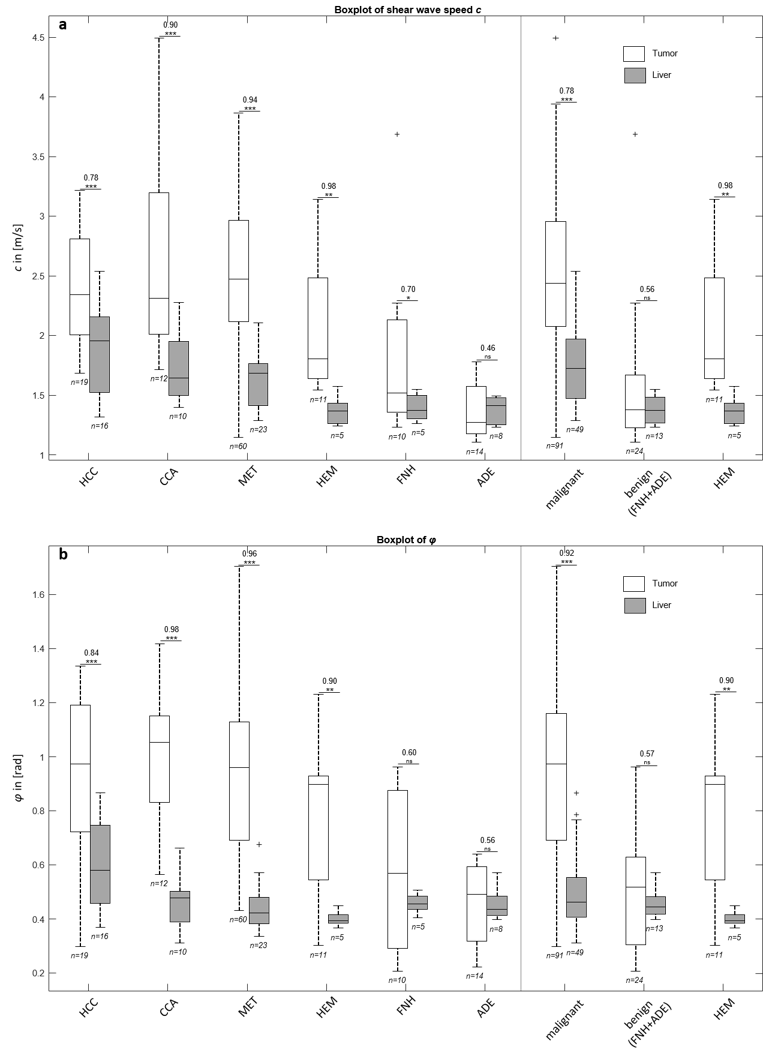
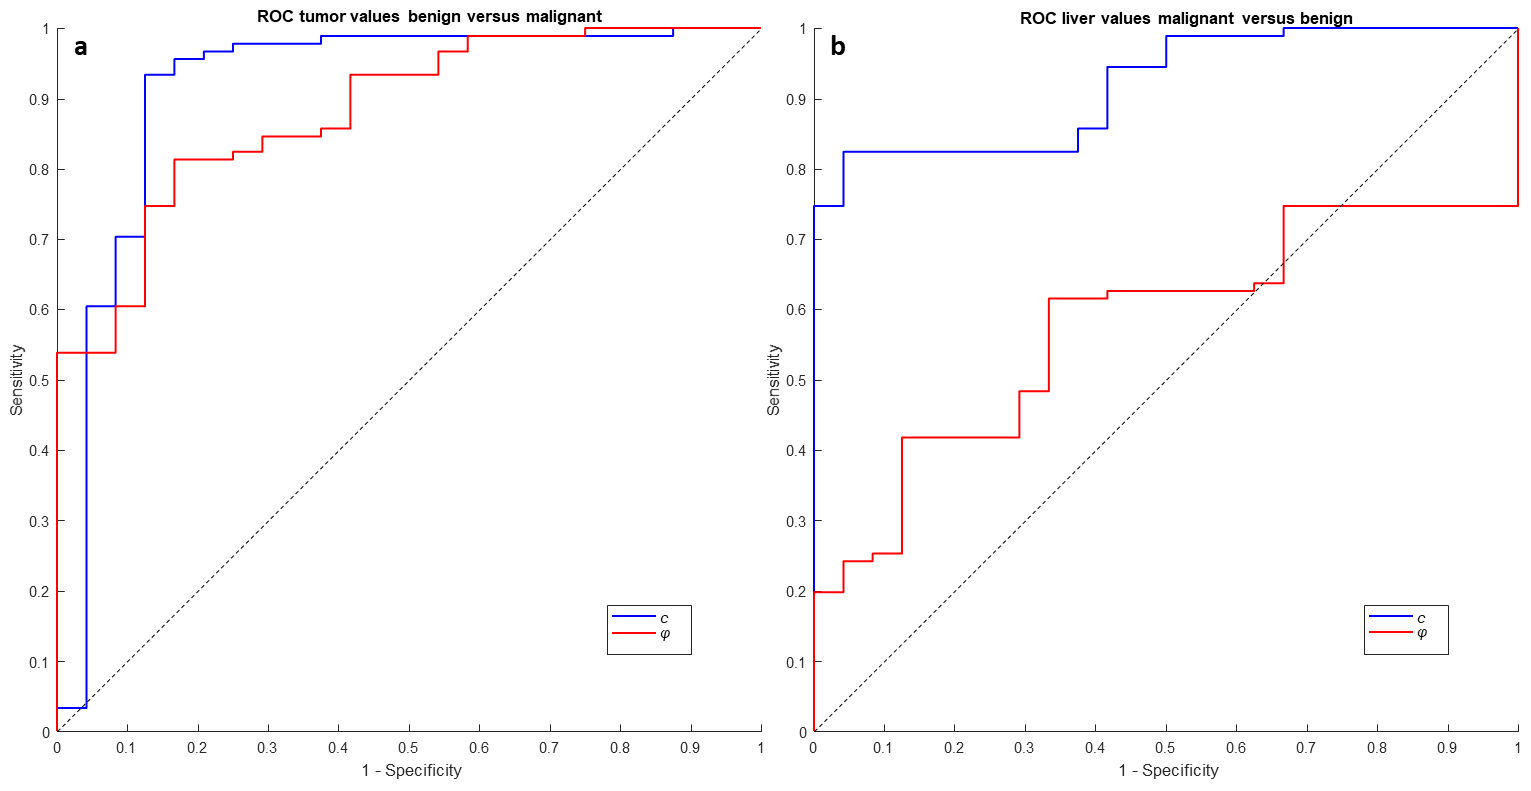
Figure 1 shows two representative cases of a malignant lesion (CCC) and a benign tumor (ADE). All tumor entities except of hepatic adenoma had higher c-values than non-tumorous liver tissue (HCC: 2.42±0.45m/s vs. 1.91±0.39m/s, CCA: 2.67±0.89m/s vs. 1.76±0.28m/s, MET: 2.56±0.55m/s vs. 1.72±0.19m/s, HEM: 2.08±0.59m/s vs. 1.38±0.11m/s, FNH: 1.82±0.75m/s vs. 1.35±0.10m/s, all p<0.001, ADE: 1.38±0.23m/s vs. 1.39±0.11m/s, p=0.842). All malignant tumor entities and HEM had higher φ-values than non-tumorous liver tissue (HCC: 0.93±0.29rad vs. 0.61±0.16rad, CCA:1.01±0.28rad vs. 0.46±0.12rad, MET: 0.93±0.29rad vs. 0.45±0.07rad, HEM: 0.76±0.28rad vs. 0.40±0.03rad, all p<0.001 FNH: 0.58±0.29rad vs. 0.45±0.04rad, p=0.19; ADE: 0.46±0.15rad vs. 0.44±0.05rad, p=0.59). Boxplots for group-values are shown in figure 2. ROC-analysis indicates good accuracy for the detection of malignant masses for c and φ (AUC=0.90, sensitivity=0.82, specificity=0.86 and AUC=0.93, sensitivity=0.86, specificity=0.87, respectively).
Characterization
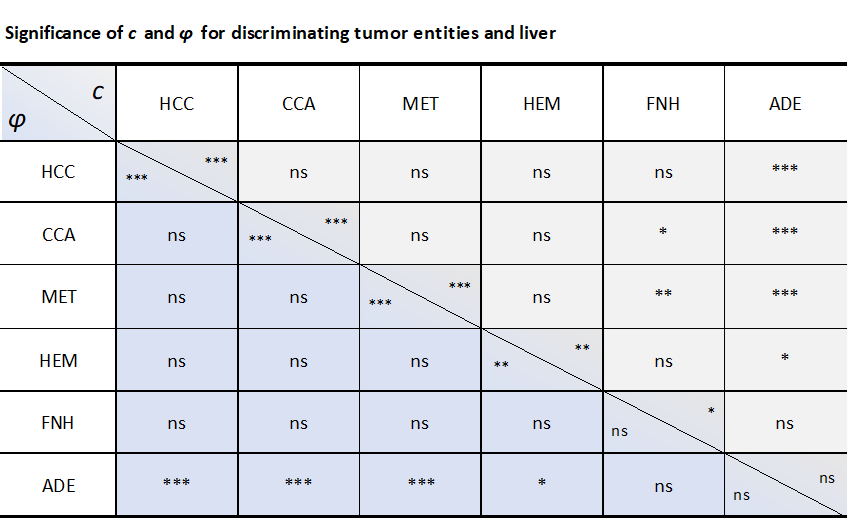
Figure 3 shows that ADE has lower c and φ values than all other tumors except of FNH. Significant differences between FNH and CCA and between FNH and MET were only observed for c (both p<0.001). ROC-analysis for characterization gave AUC-values of 0.92 and 0.88 for c and φ (figure 4 and 5). The same analysis for non-tumorous liver tissue gave AUC-values of 0.92 and 0.58 for c and φ (figure 4 and 5). c-values of non-tumorous liver tissue were correlated with c-values of malignant tumors (p<0.001, r=0.52).
Discussion and conclusion
Our study showed that shear wave speed c and the phase angle of the complex shear modulus φ are increased in malignant liver tumors as compared to benign tumors making the combination of c and φ suitable for tumor characterization. Additionally, both parameters are elevated in malignant tumors when compared to surrounding tissue making them suitable for the detection of malignant masses. Conversely, all hepatic adenoma had similar c and φ values as non-tumorous liver. Therefore, MRE-based detection of liver tumors clearly depends on malignancy, since benign masses are not well separable from normal liver tissue. This is an interesting result, taken into account that liver viscoelasticity is increased for most malignant cases and embedded lesions must have even higher values to be detectable by MRE. Since φ is not sensitive to fibrosis but increases in malignant tumors, precise measurement of φ might provide a future biomarker for detection of malignant liver tumors offering higher precision than elasticity-related markers. Our observation of the sensitivity of a viscosity-related parameter to hepatic tumor malignancy confirms Garteiser et al. who reported an accuracy of tumor characterization based on loss modulus with AUC=0.77.4 Tomoelastography-based MRE offers an additional method for differential diagnosis of liver tumors.Acknowledgements
This work was supported by GRK2260 (BIOQIC) of the German Research Foundation and LiSyM of the Federal Ministry of Education and Research.References
1. Lozano, R., et al. Global and regional mortality from 235 causes of death for 20 age groups in 1990 and 2010: a systematic analysis for the Global Burden of Disease Study 2010. The Lancet 380, 2095-2128 (2012).
2. Muthupillai, R., et al. Magnetic resonance elastography by direct visualization of propagating acoustic strain waves. Science (New York, N.Y.) 269, 1854-1857 (1995).
3. Venkatesh, S.K., et al. MR elastography of liver tumors: preliminary results. AJR Am J Roentgenol 190, 1534-1540 (2008).
4. Garteiser, P., et al. MR elastography of liver tumours: value of viscoelastic properties for tumour characterisation. Eur Radiol 22, 2169-2177 (2012).
5. Thompson, S.M., et al. MR elastography of hepatocellular carcinoma: Correlation of tumor stiffness with histopathology features-Preliminary findings. Magn Reson Imaging 37, 41-45 (2017).
6. Tzschätzsch, H., et al. Tomoelastography by multifrequency wave number recovery from time-harmonic propagating shear waves. Med Image Anal 30, 1-10 (2016).
7. Dittmann, F., et al. Tomoelastography of the abdomen: Tissue mechanical properties of the liver, spleen, kidney, and pancreas from single MR elastography scans at different hydration states. Magn Reson Med 78, 976-983 (2017).
8. Braun, J., et al. High-resolution mechanical imaging of the human brain by three-dimensional multifrequency magnetic resonance elastography at 7T. Neuroimage 90, 308-314 (2014).
9. Whitney, W.S., et al. Dynamic breath-hold multiplanar spoiled gradient-recalled MR imaging with gadolinium enhancement for differentiating hepatic hemangiomas from malignancies at 1.5 T. Radiology 189, 863-870 (1993).
Figures