0579
DCE-MRI is more sensitive than IVIM-DWI for assessing therapy induced changes in tumour perfusion in colorectal liver metastases1CRUK Cancer Imaging Centre, The Institute of Cancer Research and Royal Marsden NHS Foundation Trust, London, United Kingdom, 2Department of Medicine, GI and Lymphoma Unit, The Royal Marsden NHS Foundation Trust, London and Sutton, United Kingdom
Synopsis
This study evaluates response to anti-angiogenic treatment in 25 patients with colorectal liver metastases to determine whether the observed changes on dynamic contrast enhanced (DCE)-MRI are detectable by IVIM-DWI. Significant therapy response measured in this cohort by DCE and confirmed by tumour biopsies was not mirrored by the perfusion related IVIM parameters. No strong correlation was found between DCE and IVIM perfusion parameters. DCE-MRI is more sensitive than IVIM-DWI for assessing therapy induced changes in tumour perfusion in colorectal liver metastases.
INTRODUCTION
Diffusion weighted imaging (DWI) with intravoxel incoherent motion (IVIM) modelling can inform on tissue perfusion without exogenous contrast administration1. Dynamic contrast enhanced (DCE)-MRI also allows characterisation of tissue vascularisation2, but requires a Gd-based contrast agent injection. This study evaluates response to anti-angiogenic treatment in patients with colorectal liver metastases to determine whether the observed changes on dynamic contrast enhanced (DCE)-MRI are detectable by IVIM.PATIENTS AND METHODS
25 patients with colorectal liver metastases on a single-agent anti-angiogenic treatment were evaluated on a 1.5T MR scanner (MAGNETOM Avanto, Siemens Healthcare, Erlangen, Germany) before and at day 15 after therapy using slice matched IVIM and DCE protocols. The IVIM-DWI scans were performed prior to DCE-MRI studies to avoid any possible effects of gadolinium contrast on the IVIM measurements.
DWI protocol. The coronal IVIM-DWI was a 2D echo planar imaging sequence with: 20 coronal slices, TR/TE=5000/60 ms, FOV=400x400 mm2, 5 independent acquisitions (no averaging), matrix 128x128, phase partial Fourier 7/8, parallel acquisition (GRAPPA acc. factor 2, ref lines 30), 8 b-values (0,20,40,60,120,240,480,900 s/mm2), diffusion times δ=14.6 ms and Δ=24 ms, res. 3.1x3.1x5 mm3, SPAIR fat suppression, rBW=1860 Hz, total acquisition time ~2 min/acquisition, free-breathing technique.
DCE protocol. A standard dose of contrast agent (Dotarem, 0.2 ml/kg) followed by 20 ml of saline were delivered by an automatic power injector at 3 ml/s. Coronal DCE-MRI data were acquired (post DWI) using a 3D fast field echo sequence with: 14 partitions, TR/TE = 3/0.89 ms, flip angle = 11°, FOV=400x400 mm2, matrix=128x128, 1 average, parallel acquisition (Grappa acc. factor 2, ref lines 24), res. 3.1x3.1x5 mm3, rBW=650 Hz. Dynamic scans were preceded by a calibration scan with the same parameters, but at a lower flip angle (2°) and with 7 averages, to enable contrast quantification. Patients were imaged using a sequential breath-hold technique optimised for liver lesions: two image volumes were acquired during each 6 s breath-hold, followed by a 6 s breathing gap; 40 volumes were acquired over 4.18 min.
Data analysis. Data were motion-corrected and tumour volumes of interest were drawn, slice by slice, on high-b-value images (b900) and then translated to the DCE data. Two methods using least squares (LSQ) and 3D Markov random field (MRF) approaches generated IVIM estimates (in house scripts, Matlab 2017a): diffusion coefficient D, perfusion fraction f, pseudodiffusion coefficient D*, and their product fD*. Pharmacokinetic analysis of the DCE data (extended Kety3/Tofts4 model using a cosine-based arterial input function model5 derived from population-averaged values6, in house software7) reported three main parameters: volume transfer constant Ktrans, enhancement fraction EF, and their product KEF. Median values from voxel-wise tumour analysis for both IVIM and DCE were recorded for every patient at the pre/post-treatment visits.
Statistics. Treatment-induced changes on all parameters were assessed with Wilcoxon signed-rank tests as most of parameters were not normally distributed. Correlations between DCE (Ktrans, KEF) and IVIM (f, D*, fD*) parameters were assessed by Spearman rank tests.
RESULTS AND DISCUSSION
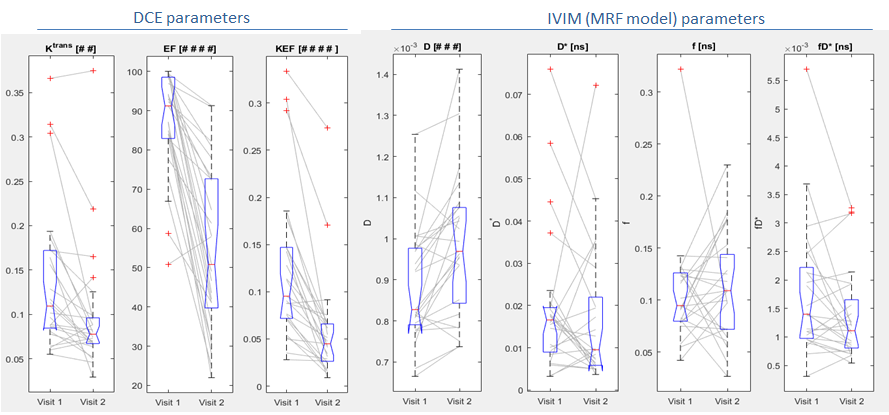
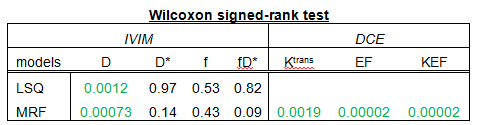
The treatment response of our liver metastasis patient cohort, as measured by DCE and IVIM, is shown in Figure 1. Significant treatment-induced reductions of all DCE parameters were observed (EF, KEF, p<0.0001; Ktrans, p=0.0019) and were also confirmed by results of paired tumour biopsies8. For IVIM, only D increased significantly post therapy (LSQ p=0.0012; MRF p=0.00073), while perfusion-related parameters f, D* and fD* failed to reach significance, although the 3D MRF analysis improved the visual appearance of the parameter maps. Complete results including p-values of the pre/post-treatment Wilcoxon test of all parameters are presented in Table 1.
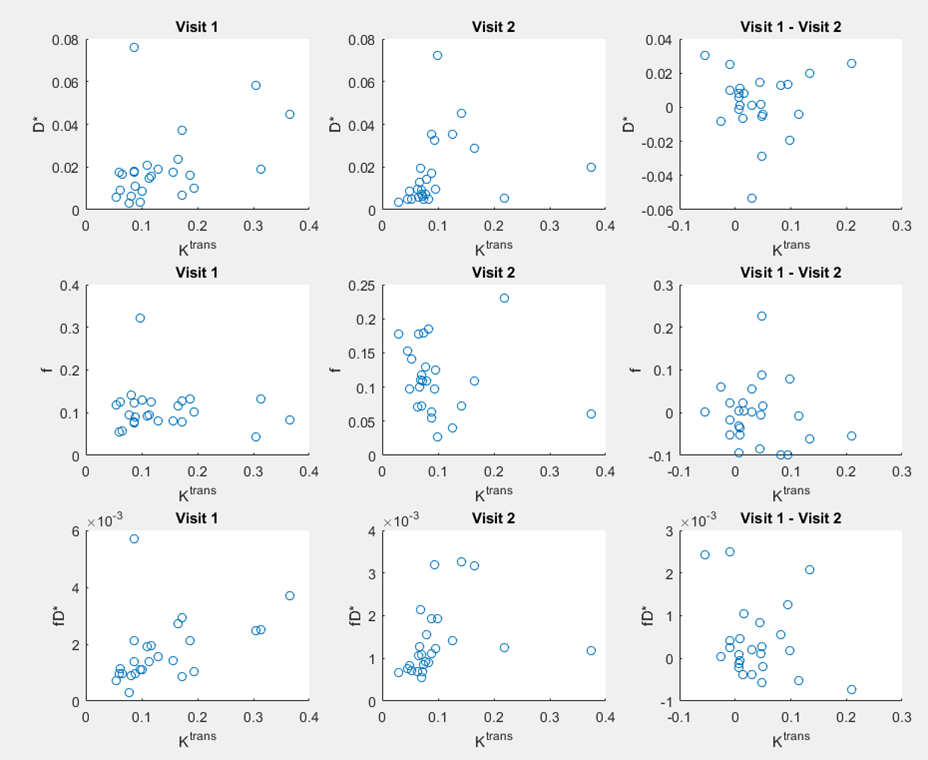
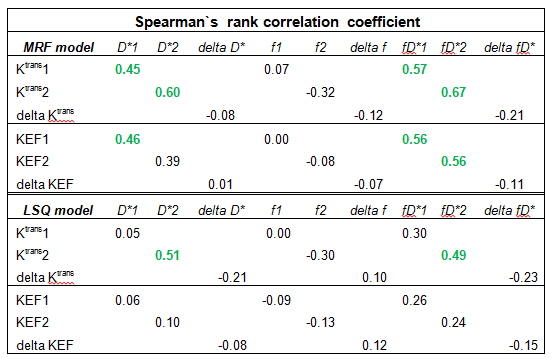
Spearman tests found no strong correlations between any perfusion-related DCE and IVIM parameters, see e.g. the scatter plots of the IVIM parameters versus Ktrans in Figure 2. The highest correlation was between Ktrans and fD* (MRF) at visit 2, but was only moderate (rs=0.67; p=0.0003), see Table 2.
CONCLUSION
IVIM perfusion-related parameters were insensitive to anti-angiogenic treatment effects and showed little correlation with DCE parameters, despite profound and significant post-treatment reductions in DCE measures. IVIM parameters should not be used as an alternative to contrast-based studies when assessing the perfusion of colorectal liver metastases.Acknowledgements
CRUK and EPSRC support to the Cancer Imaging Centre at ICR and RMH in association with MRC & Dept of Health C1060/A10334, C1060/A16464 and NHS funding to the NIHR Biomedical Research Centre and the Clinical Research Facility in Imaging. This report is independent research funded partially by the National Institute for Health Research. The views expressed in this publication are those of the author(s) and not necessarily those of the NHS, the National Institute for Health Research or the Department of Health. MOL is an NIHR Emeritus Senior Investigator.
DWI sequence prototype from Dr Thorsten Feiweier and Dr Bernd Kuhn, Siemens Healthineers GmbH, Germany.
References
1. Yamada I, et al. Diffusion coefficients in abdominal organs and hepatic lesions: evaluation with intravoxel incoherent motion echo-planar MR imaging. Radiology, 1999; 210(3): 617-623.
2. Leach MO, et al. Imaging vascular function for early stage clinical trials using dynamic contrast-enhanced magnetic resonance imaging. European radiology, 2012; 22(7):1451-64.
3. Kety SS. The theory and applications of the exchange of inert gas at the lungs and tissues. Pharmacol Rev., 1951; 3(1): 1-41.
4. Tofts PS. Modeling tracer kinetics in dynamic Gd-DTPA MR imaging. J Magn Reson Imaging, 1997; 7(1): 91-101.
5. Orton M, et al, Computationally efficient vascular input function models for quantitative kinetic modelling using DCE-MRI. Phys Med Biol, 2008; 53(5): 1225-1239.
6. Parker GJ, et al. Experimentally-derived functional forms for a population-averaged high-temporal-resolution arterial input function for dynamic contrast-enhanced MRI. Magn Reson Med, 2006; 56(5): 993-1000.
7. D`arcy JA, et al, Informatics in Radiology (infoRAD): Magnetic Resonance Imaging Workbench: analysis and visualization of dynamic contrast-enhanced MR imaging data. Radiographics, 2006; 26(2): 621-32.
8. Khan K, et al, Functional Imaging and circulating biomarkers of response to Regorafenib in treatment-refractory metastatic colorectal cancer patients in a prospective phase II study, Gut, 2018;67:1484-1492.
Figures