0577
Integration of DCE-MRI and Molecular Markers for Improved Early Prediction of Breast Cancer Response to Neoadjuvant Chemotherapy1Oregon Health & Science University, Portland, OR, United States
Synopsis
The goal is to determine if integration of DCE-MRI and molecular markers improves early prediction of breast cancer response to neoadjuvant chemotherapy (NACT). 49 patients undergoing standard of care NACT had DCE-MRI before and after the first NACT cycle, with 12 of them achieving pathologic complete response (pCR) after NACT. Pharmacokinetic (PK) analysis of DCE-MRI data was performed using the shutter-speed model. Changes in PK parameters were superior to changes in tumor size for early prediction of pCR. The improvement in predictive performance by combining DCE and HR, HER2 molecular markers was statistically significant compared to using MRI markers alone.
INTRODUCTION
Pathologic complete response (pCR) to neoadjuvant chemotherapy (NACT) is an important prognostic marker for disease-free and overall survival1 of breast cancer (BC) patients. In the era of precision medicine, early prediction of pCR vs. non-pCR may allow rapid, personalized treatment regimen de-escalation/alteration for responding/non-responding patients and reduce short and long term toxicities associated with NACT. Quantitative DCE-MRI parameters estimated from pharmacokinetic (PK) data modeling have been shown to be effective for early prediction of NACT response2,3. The rate of pCR can vary widely depending on BC subtypes4 stratified by the molecular markers of estrogen receptor (ER), progesterone receptor (PR), and human epidermal growth factor receptor 2 (HER2). In this study, we sought to determine if combining imaging and molecular markers can further improve early prediction of BC response to NACT.METHODS
49 BC patients treated with 6-8 NACT cycles as standard of care were consented to a DCE-MRI study before [Visit 1 (V1)] and after the first NACT cycle [V2]. Axial bilateral DCE-MRI covering the entire breasts was performed on a 3T system as previously described3, with 14-20 s temporal resolution and 30-42 frames for a total of ~10 min. Tumor ROIs on multiple slices were drawn by the radiologists on post-contrast images and tumor size in the longest diameter (LD) was measured according to the RECIST guidelines5. The voxel DCE time-course data within the tumor ROIs were modeled with the Shutter-Speed PK model (SSM)6-8 to derive Ktrans, ve, kep (= Ktrans/ve), and τi (mean intracellular water lifetime) parameters. The tumor mean parameter value was calculated as the average of the voxel values.
pCR and non-pCR were determined by pathological analysis of post-NACT resection specimens. The ER, PR, and HER2 status was determined from the diagnostic biopsy specimens. Correlating with the binary response endpoints, univariate and multivariate logistic regression (ULR and MLR) analyses were used to assess predictive performance of a single imaging or molecular marker and a combination of imaging and molecular markers, respectively.
RESULTS
Twelve patients achieved pCR while the other 37 were non-pCRs. Fig. 1 shows representative Ktrans, ve, and τi maps of a pCR (1A) and a non-pCR (1B) tumor at V1 and V2. Compared to the non-pCR, the pCR tumor showed considerable decrease in Ktrans and increases in ve and τi after the first NACT cycle. Table 1 lists the mean ± SD values of the PK parameters and the percent changes (V21%: V2 relative to V1) for the two groups and P values (from t test) for comparisons, as well as the ULR C statistics values (equivalent to ROC AUC) for early prediction of pCR vs. non-pCR. Only the metrics with C > 0.75 are listed. RECIST LD and percent change are listed for comparison. Note that the SSM-unique parameter τi was the only baseline (V1) MRI metric predictive of response with C = 0.82.
In assessment of the predictive performances of the molecular markers alone or in combination with imaging markers, ER and PR status was combined as hormone receptor (HR) status, with HR+ indicating ER+ and/or PR+. Twenty nine tumors were HR+ and 20 HR-, while 25 tumors were HER2+ and 24 HER2-. Table 2 lists the ULR C values for the top four DCE markers (also shown in Table 1), HR, and HER2; MLR C values for HR and HER2 combined and the combinations of the MRI and molecular markers. The improvements in predictive performance by combining DCE-MRI and molecular markers were mostly statistically significant compared to using imaging markers alone.
DISCUSSION
Consistent with previous studies10,11, results from this study suggest that changes in underlying tumor biology measured by DCE-MRI provide substantially better early prediction of BC NACT response than changes in tumor size. The HR and HER2 status appeared to be useful molecular markers for prediction of pCR. Though not statistically significant (P > 0.05; not shown in Table 2), the DCE-MRI metrics generally outperformed these molecular markers in prediction of response. Nonetheless, the important finding is that the combination of these two distinct types of biomarkers significantly enhanced prediction of NACT response. This provides further evidence that advanced functional MRI methods can play an important role in precision medicine through the "big-data" approach of integration with clinical and molecular data12. Future investigations will include validation of the study findings with a significantly larger cohort and inclusion of more relevant imaging, clinical, and molecular markers in the multivariate model for prediction of response, such as cellularity markers from DWI, age, tumor type and grade, TNM stage, genetic test scores, and NACT regimen.Acknowledgements
Grant support: NIH U01 CA154602; Oregon Health & Science University Center for Women's Health, 2017 Circle of Giving Award.References
Kong X, Moran MS, Zhang N, Haffty B, Yang Q. Meta-analysis confirms achieving pathological complete response after neoadjuvant chemotherapy predicts favorable prognosis for breast cancer patients. Eur J Cancer 2011;47:2084-2090.
Li X, Kang H, Arlinghaus LR, Abramson RG, Chakravarthy AB, Abramson VG, et al. Analyzing spatial heterogeneity in DCE- and DW-MRI parametric maps to optimize prediction of pathologic response to neoadjuvant chemotherapy in breast cancer. Transl Oncol 2014;7:14-22.
Tudorica A, Oh KY, Chui SYC, Roy N, Troxell ML, Naik A, et al. Early Prediction and Evaluation of Breast Cancer Response to Neoadjuvant Chemotherapy Using Quantitative DCE-MRI. Transl Oncol 2016;9:8-17.
Houssami N, Macaskill P, von Minckwitz G, Marinovich ML, Mamounas E. Meta-analysis of the association of breast cancer subtype and pathologic complete response to neoadjuvant chemotherapy. Eur J Cancer 2012;48:3342-3354.
Therasse P, Arbuck SG, Eisenhauer EA, Wanders J, Kaplan RS, Rubinstein L, et al. New guidelines to evaluate the response to treatment in solid tumors. European Organization for Research and Treatment of Cancer, National Cancer Institute of the United States, Nation Cancer Institute of Canada. J Natl Cancer Inst 2000;92:205-216.
Yankeelov TE, Rooney WD, Li X, Springer CS. Variation of the relaxographic “Shutter-Speed” for transcytolemmal water exchange affects the CR bolus-tracking curve shape. Magn Reson Med 2003;50:1151-1169.
Li X, Rooney WD, Springer CS. A unified pharmacokinetic theory for intravascular and extracellular contrast agents. Magn Reson Med 2005;54:1351-1359.
Huang W, Tudorica LA, Li X, Thakur SB, Chen Y, Morris EA, et al. Discrimination of benign and malignant breast lesions by using shutter-speed dynamic contrast-enhanced MR imaging. Radiology 2011;261:394-403.
DeLong ER, DeLong DM, Clarke-Pearson DL. Comparing the areas under two or more correlated Receiver Operating Characteristic curves: a nonparametric approach. Biometrics 1988;44:837–845.
Marinovich ML, Sardanelli F, Ciatto S, Mamounas E, Brennan M, Macaskill P, et al. Early prediction of pathologic response to neoadjuvant chemotherapy in breast cancer: systematic review of the accuracy of MRI. The Breast 2012;21:669-677.
Hylton NM, Blume JD, Bernreuter WK, Pisano ED, Rosen MA, Morris EA, et al. Locally advanced breast cancer: MR imaging for prediction of response to neoadjuvant chemotherapy – results from ACRIN 6657/I-SPY trial. Radiology 2012;263:663-672.
Pinker K, Chin J, Melsaether AN, Morris EA, Moy L. Precision medicine and radiogenomics in breast cancer: new approaches toward diagnosis and treatment. Radiology 2018;287:732-747.
Figures
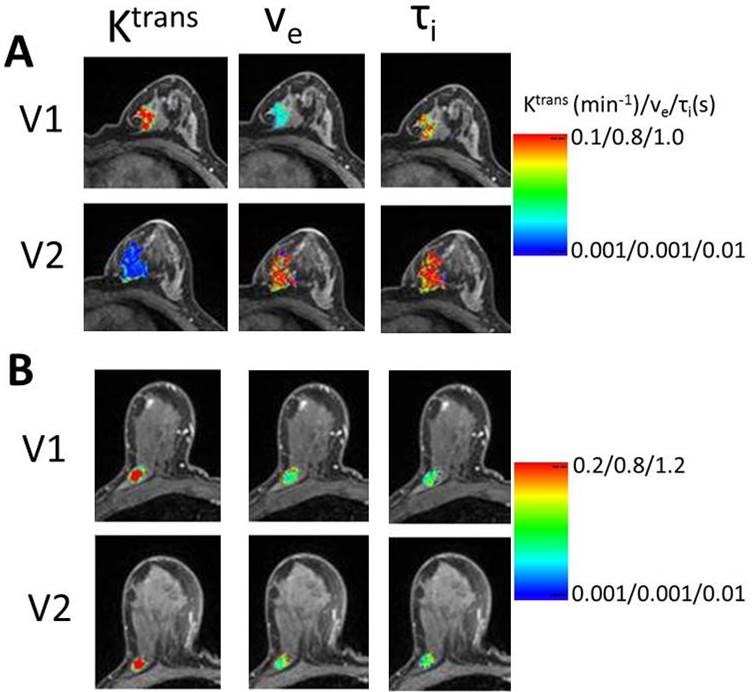
Fig. 1. V1 (pre-NACT) and V2 (after the first NACT cycle) color parametric maps of Ktrans, ve, and τi from a pCR (A, left breast) and a non-pCR (B, right breast) breast tumor. For each tumor, the color scale of each DCE-MRI metric is kept the same between the two visits for visualization of NACT-induced changes.
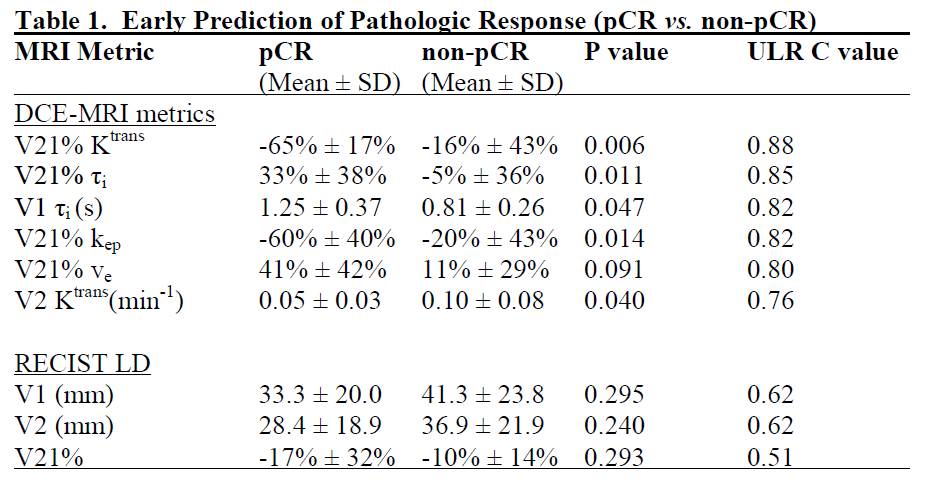
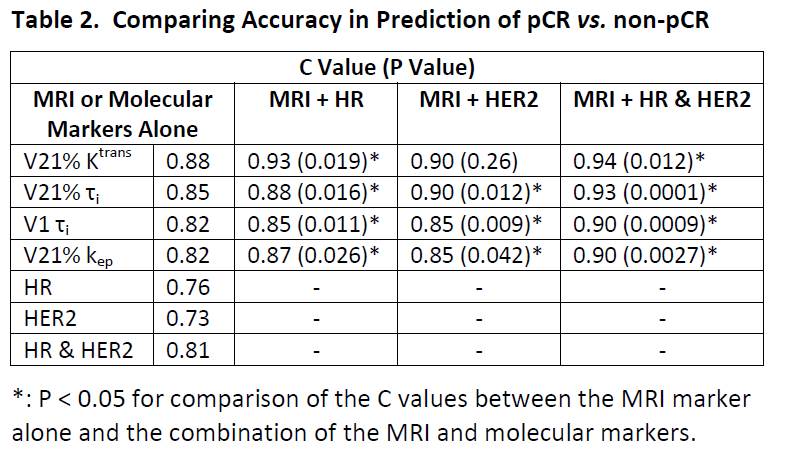
Table 2. Comparing accuracy for prediction of pCR vs. non-pCR. P value was obtained from comparing C values between a single MRI marker and the combination of this MRI marker with molecular markers using a nonparametric method9.