0576
Comparison and Integration of DCE- and IVIM-MRI for Breast Cancer Diagnosis: A Preliminary Study1International School of Beaverton, Aloha, OR, United States, 2Oregon Health & Science University, Portland, OR, United States, 3University of Washington, Seattle, WA, United States
Synopsis
The goal is to compare DCE-MRI PK parameters with IVIM-MRI parameters and ADC in breast cancer diagnostic accuracy, and assess if integration of DCE and IVIM markers further improves diagnostic performance. Twenty-two patients with 23 suspicious breast lesions underwent pre-biopsy DCE- and DW-MRI with 12 b values. PK parameters were estimated using the Shutter-Speed model. IVIM parameters and ADC were derived with biexponential and monoexponential modeling of the DW-MRI data, respectively. Both DCE- and IVIM-MRI, with individual or combined markers, outperformed clinical MRI reading in breast cancer diagnosis. The integration of DCE and IVIM markers provided the best diagnostic performance.
INTRODUCTION
High false positive rate in breast cancer diagnosis using the standard of care imaging methods remains a significant challenge, which results in unnecessary biopsies of many benign lesions. Quantitative pharmacokinetic (PK) parameters estimated from DCE-MRI have demonstrated improved accuracy in discriminating malignant and benign breast lesions1,2. The apparent diffusion coefficient (ADC) derived from DW-MRI is another promising marker for breast cancer diagnosis3. Recently, the IVIM (intra-voxel incoherent motion) approach for DW-MRI acquisition and analysis, which decodes contributions from tissue diffusion and capillary perfusion to signal attenuation, is becoming an emerging technique for breast lesion characterization3-5. The goal of this preliminary study is to compare DCE PK parameters with IVIM parameters and ADC in breast cancer diagnostic accuracy, and assess if integration of DCE and IVIM markers further improves diagnostic performance.METHODS
Twenty-two patients were referred for biopsies due to mammography and/or ultrasound findings of 23 suspicious breast lesions. They were consented to a pre-biopsy MRI study with a 3T system, which included pre-contrast anatomic MRI, DW-MRI, and DCE-MRI (all with full breast coverage). Axial bilateral DW-MRI was performed using a single-shot SE EPI sequence with 12 b values (0, 10, 25, 50, 75, 100, 150, 250, 450, 800, 1000, and 1200 s/mm2) applied in three orthogonal directions, 192x192 in-plane matrix, 32-34 cm FOV, 5 mm slice thickness (no gap), and ~8 min acquisition time. 3D axial bilateral DCE-MRI was performed as previously described6, with the same FOV as DW-MRI, 320x320 in-plane matrix, 1.4 mm slice thickness, 14-18 s temporal resolution, and 34-42 frames for ~10 min acquisition time.
Lesion ROIs were drawn on DW and post-contrast DCE images separately. The voxel DW-MRI data within the ROIs were fitted with the biexponential IVIM model3-5 to extract D (tissue diffusivity), D* (pseudodiffusivity), and fp (perfusion fraction), and with the monoexponential model with two b values (0 and 800 s/mm2) to derive ADC. The DCE time-course data were modeled with the Shutter-Speed PK model6-8 to estimate Ktrans, ve, kep (= Ktrans/ve), and kio (cross cell membrane water efflux rate constant). The lesion mean parameter value was calculated as the average of the voxel values. In addition, standard reading of the anatomic and DCE images was performed according to the ACR breast MRI BI-RADS lexicon9.
Pathologically determined malignant/benign status was correlated with the MRI markers. A linear support vector machine10 was used to assess diagnostic performances for individual markers, as well as combined markers constructed by concatenating individual markers to form feature vectors with multiple dimensions. The ROC AUC values were compared with the Hanley and McNeil method11.RESULTS
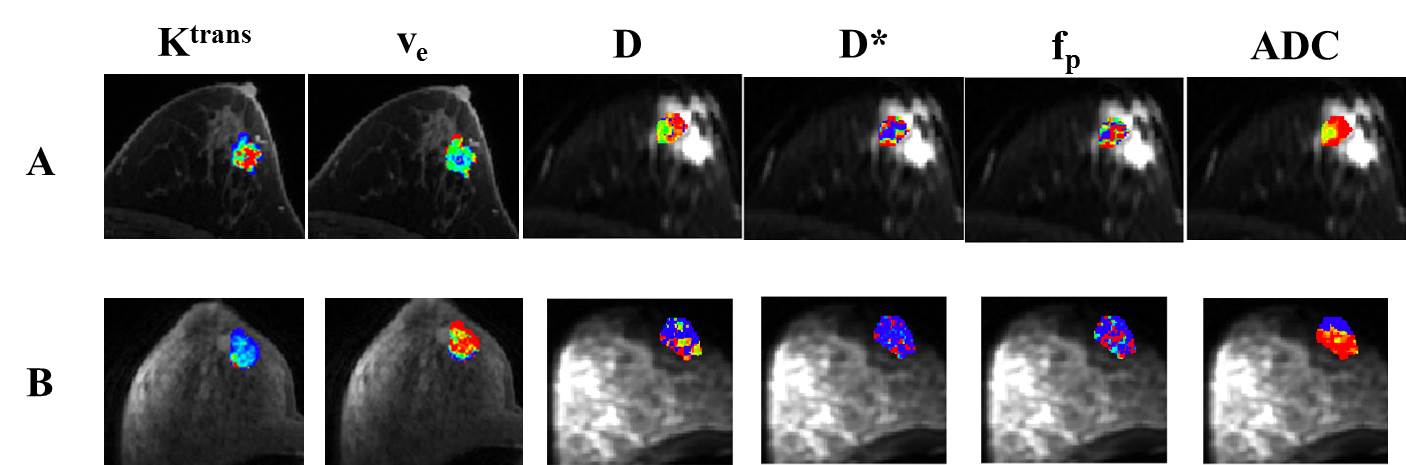
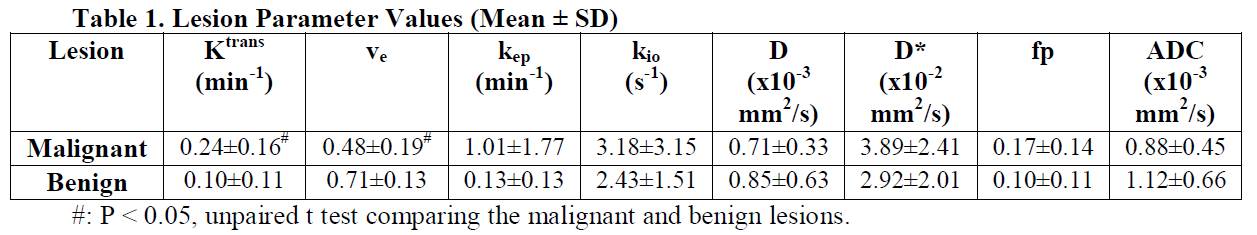
Ten lesions were malignant and the other 13 benign. Fig.1 shows Ktrans, ve, D, D*, fp, and ADC color maps of a malignant and benign lesion. It is clearly visible that the malignant lesion had higher Ktrans and lower ve than the benign lesion. The mean ± SD values of the individual markers for the two lesion groups are listed in Table 1. Significant (P < 0.05) differences were found only in Ktrans and ve.
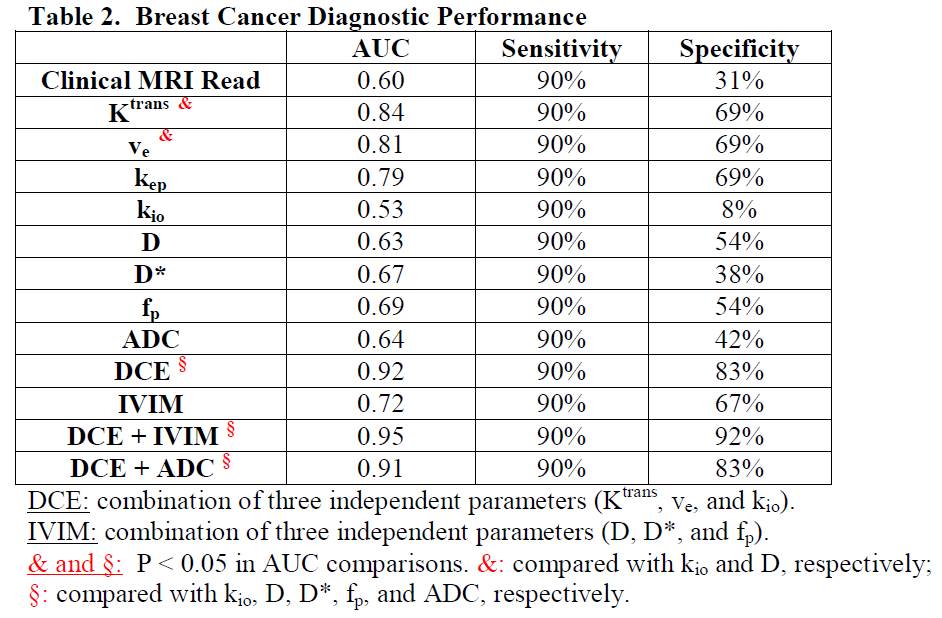
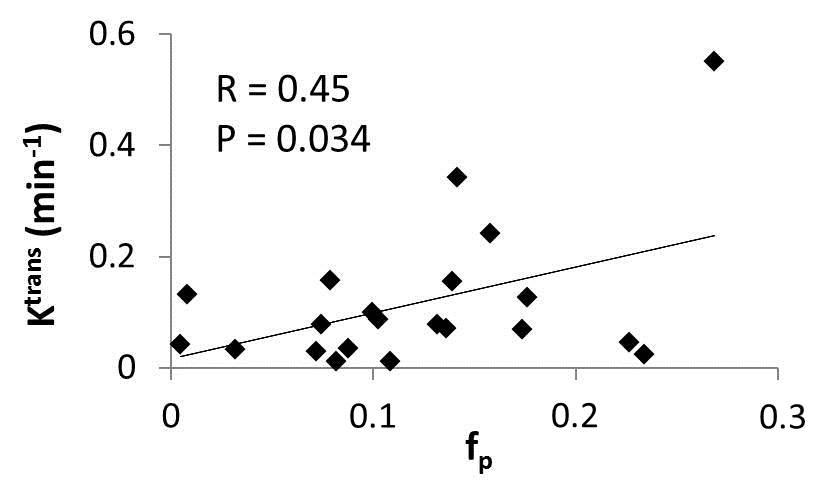
Table 2 shows the diagnostic performances in AUC, sensitivity, and specificity for the individual and combined markers. The clinical MRI read yielded 90% sensitivity. For direct comparison, the specificities of all the other markers were calculated with cut-off values that ensured 90% sensitivity. In general, the individual DCE- and DW-MRI markers had higher specificity than clinical reading. The individual and combined DCE markers outperformed ADC and the individual and combined IVIM markers in diagnostic accuracy. The integration of DCE and IVIM markers generated the highest AUC value. Significant (P < 0.05) differences in AUC were generally found only when comparing individual and combined DCE markers, as well as integrated DCE and IVIM markers, with individual DW-MRI parameters. For the entire cohort, lesion Ktrans was found to be significantly (P < 0.05) associated with fp in a linear relationship (Fig. 2).DISCUSSION
These preliminary results suggest that both quantitative DCE- and IVIM-MRI, each with individual or combined markers, outperform standard clinical breast MRI in discriminating malignant and benign lesions, and that the integration of DCE and IVIM markers provides further improved diagnostic performance. The IVIM diagnostic accuracy in this study may be affected by its poorer spatial resolution and thus larger partial volume effect compared to DCE-MRI. With a very limited cohort size, the study findings clearly need to be validated in a much larger population. Nonetheless, one conclusion from this study is that the multi-parametric model is the way forward to reduce false positive rate in breast MRI12 and consequently, unnecessary biopsies.Acknowledgements
NIH grant R44 CA180425; Oregon Health & Science University Center for Women’s HealthReferences
Huang W, Tudorica LA, Li X, Thakur SB, Chen Y, Morris EA, et al. Discrimination of benign and malignant breast lesions by using shutter-speed dynamic contrast-enhanced MR imaging. Radiology 2011;261:394-403.
Schabel MC, Morrell GR, Oh KY, et al. Pharmacokinetic mapping for lesion classification in dynamic breast MRI. J Magn Reson Imaging 2010;31:1371-1378.
Partridge SC, Nissan N, Rahbar H, Kitsch AE, Sigmund EE. Diffusion-weighted breast MRI: clinical applications and emerging techniques. J Magn Reson Imaging 2017;45:337-355.
Lima M, Le Bihan D. Clinical intravoxel incoherent motion and diffusion MR imaging: past, present, and future. Radiology 2016;278:13-32.
Bokacheva L, Kaplan JB, Giri DD, Patil S, Gnanasigamani M, Nyman CG, et al. Intravoxel incoherent motion diffusion-weighted MRI at 3.0T differentiates malignant breast lesions from benign lesions and breast parenchyma. J Magn Reson Imaging 2014;40:813-823.
Tudorica A, Oh KY, Chui SYC, Roy N, Troxell ML, Naik A, et al. Early Prediction and Evaluation of Breast Cancer Response to Neoadjuvant Chemotherapy Using Quantitative DCE-MRI. Transl Oncol 2016;9:8-17.
Yankeelov TE, Rooney WD, Li X, Springer CS. Variation of the relaxographic “Shutter-Speed” for transcytolemmal water exchange affects the CR bolus-tracking curve shape. Magn Reson Med 2003;50:1151-1169.
Li X, Rooney WD, Springer CS. A unified pharmacokinetic theory for intravascular and extracellular contrast agents. Magn Reson Med 2005;54:1351-1359.
"American College of Radiology. Breast imaging reporting and data system (BI-RADS): breast imaging atlas," Reston, VA: American College of Radiology (2003).
Cortes C, Vapnik V. Support-vector networks. Machine Learning 1995;20:273-297.
Hanley JA, McNeil BJ. A method of comparing the areas under receiver operating characteristic curves derived from the same cases. Radiology 1983;148:839-843.
Zhang M, Horvat JV, Bernard-Davila B, Marino MA, Leithner D, Ochoa-Albiztegui RE, et al. Multiparametric MRI model with dynamic contrast-enhanced and diffusion-weighted imaging enables breast cancer diagnosis with high accuracy. J Magn Reson Imaging 2018; DOI: 10.1002/jmri.26285.
Figures