0560
Cardiorenal Sodium MRI at 7.0 Tesla Using an 8-Channel 1H/23Na RF Coil Array1Berlin Ultrahigh Field Facility (B.U.F.F.), Max Delbrück Center for Molecular Medicine in the Helmholtz Association, Berlin, Germany, 2MRI.TOOLS GmbH, Berlin, Germany, 3Institute of Radiology, University Hospital Erlangen, Erlangen, Germany
Synopsis
Cardiorenal syndrome (CRS) describes disorders of the heart and the kidneys in which a dysfunction of one of the organs induces a dysfunction in the other. Sodium MRI at ultrahigh magnetic fields offers an appealing strategy to gain a better functional and metabolic understanding of CRS and detect these diseases earlier. This work describes the design, construction and application of an 8-channel 1H/23Na RF coil tailored for cardiorenal imaging at 7.0 Tesla.
Introduction
The cardiorenal syndrome (CRS) defines the interaction between heart and kidney disorders whereby the dysfunction of one organ induces a dysfunction of the other organ1. There is ample evidence to suggest that sodium metabolism changes during CRS. Measurements of sodium concentrations might provide important information about pathophysiological changes which could be crucial in diagnosing and preventing the progression of renal and cardiac diseases2, 3. Ultrahigh field MRI has the potential to visualize sodium metabolism at a functionally relevant scale with the use of tailored radiofrequency (RF) coils. To approach this goal this work focus on the optimization and application of an 8-channel 1H/23Na RF coil4 for use in cardiorenal imaging at 7.0 Tesla (T).Methods
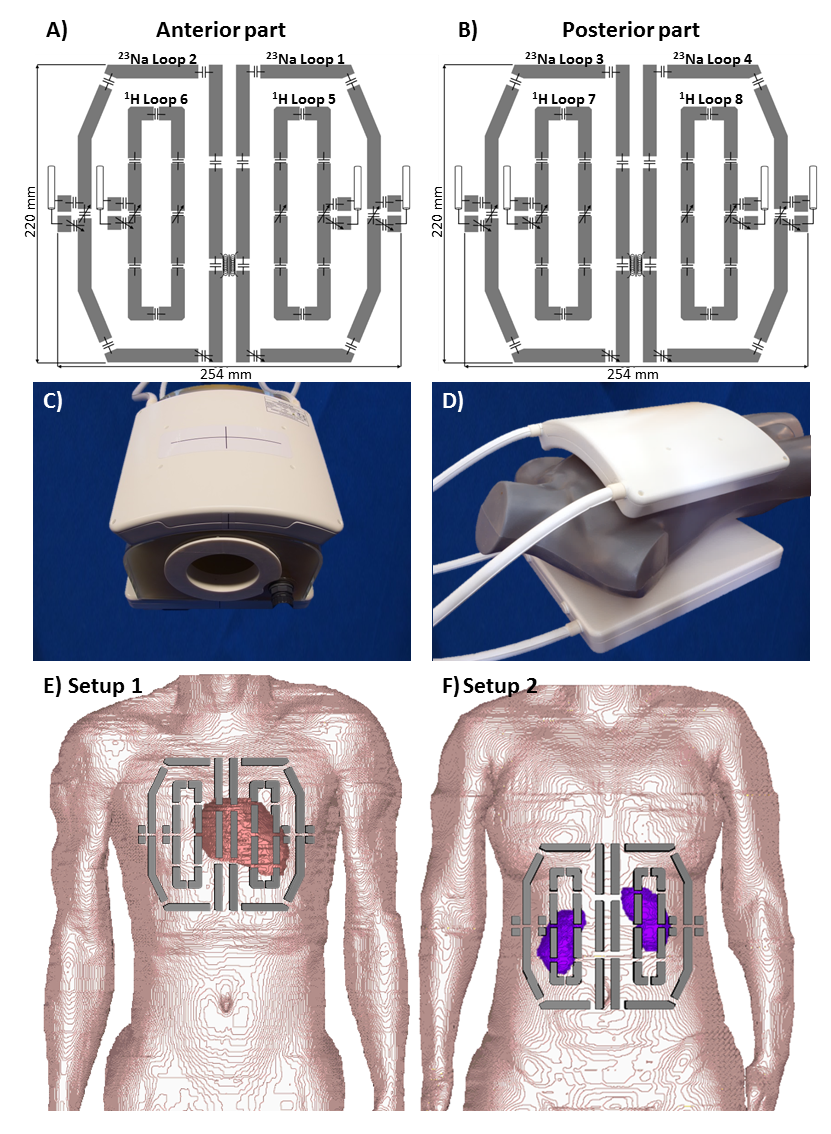
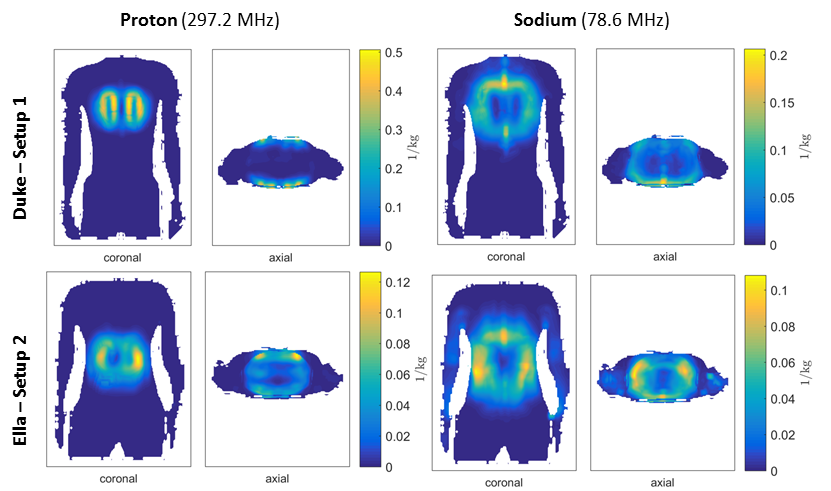
The dual-frequency RF coil described here is composed of a planar posterior section and modestly curved anterior section. Each section consists of two larger semi rectangular loop elements tailored for sodium (23Na-channel) and two smaller loopole-type5 rectangular elements customized for proton (1H-channel) as demonstrated in Figure 1 A-D. The width of the element conductors is 10 mm and the layout was manufactured from a copper coated substrate (FR-4) with a thickness of 1 mm with 35 µm of copper coating. The total size of the loop array is 310 x 235 mm. The RF coil was submitted to an independent panel and duly approved for clinical studies. Bench measurements were carried out to assess the performance of coil on an eight-channel vector network analyzer (ZVT 8, Rohde & Schwarz, Memmingen, Germany). S-parameter were measured for diverse loading conditions (phantom, female and male volunteers), then exported from the network analyzer, analyzed in MATLAB (The MathWorks, Natrick, MA, USA) and compared with simulations carried out under the same conditions (phantom, Ella, Duke). Numerical electromagnetic field (EMF) and specific absorption ratio (SAR) simulations were performed for both cardiac (Setup 1) and renal (Setup 2) setups (Fig. 1 E, F) using CST Studio Suite 2018 (CST AG, Darmstadt, Germany). B1+ maps were acquired using the phase-sensitive method6 for 23Na and pre-saturation based B1+ mapping for 1H7. All MR experiments were carried out on a 7.0T whole-body MR scanner (Magnetom Siemens Healthineers, Erlangen, Germany). A density adapted 3D radial sequence (DA-3DPR) was used for sodium imaging8. The scan parameters were: TR=11ms, TE=0.55ms, FA:70°, Projections=50000, voxel size=(5x5x5)mm³ for renal MRI, and (6x6x6)mm³ for cardiac MRI, with an acquisition time of: 18min20s. The scans were carried out under free breathing. Anatomical images were acquired with a gradient echo technique, with the following scan parameter: Setup 1: TR=4.14ms, TE=1.84ms, voxel size=(1.4x1.4x4)mm³, 2D CINE mode, number of cardiac phases=30, acquisition time=16s, Setup 2: TE=3.57ms, TR:130ms, voxel size:(0.8x0.8x3)mm³, field of view=400mm, acquisition time=31s.Results
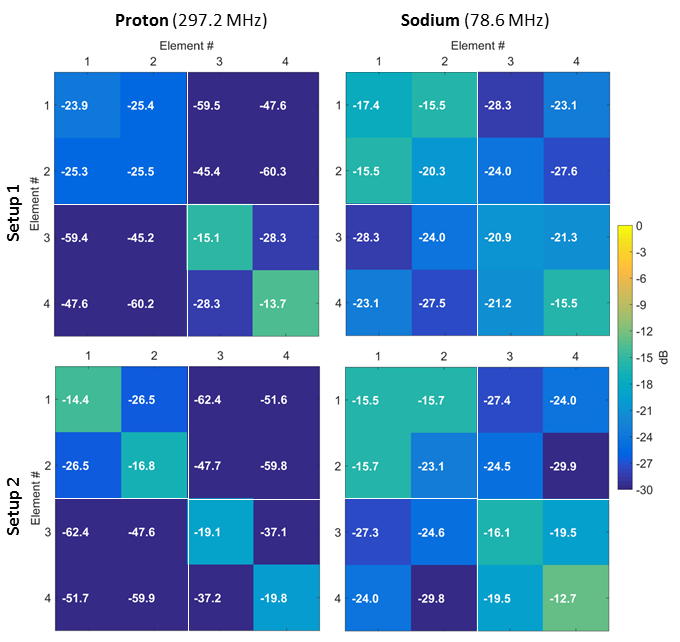
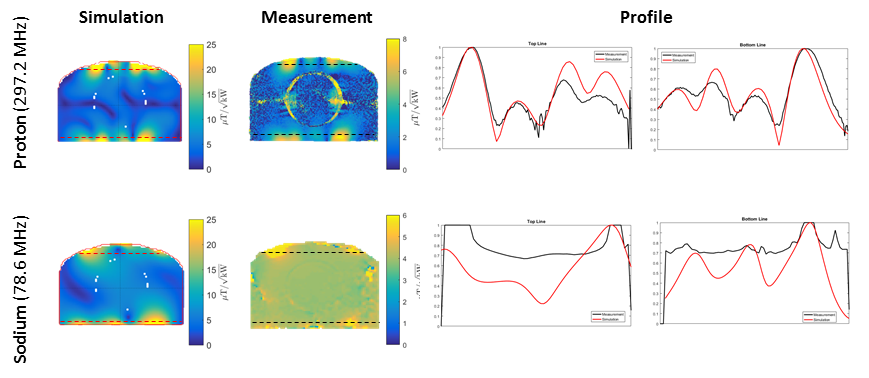
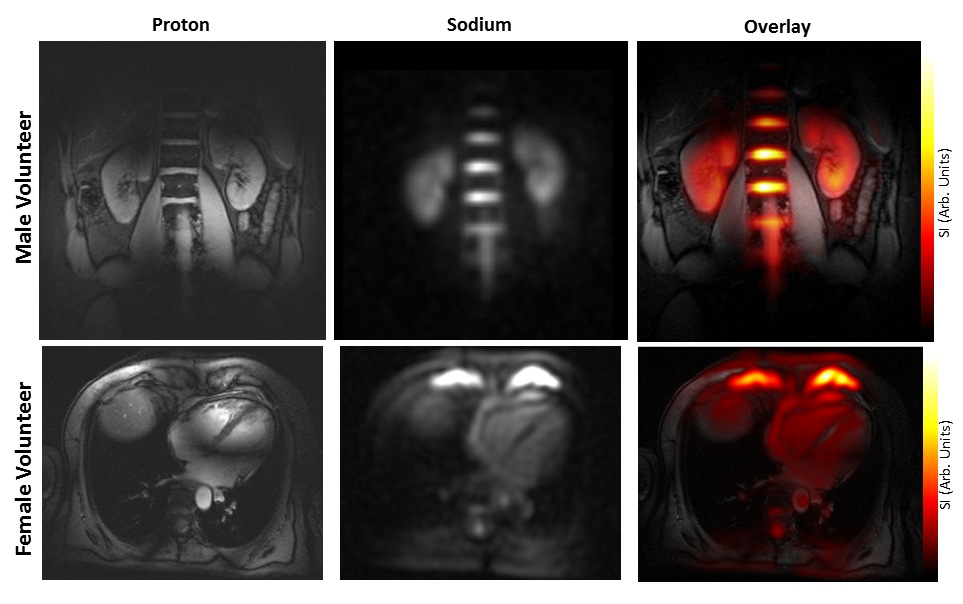
Figure 2 shows the average S-parameter values of the RF coil measured on the bench on four different volunteers and demonstrate a decoupling level (Sij) below -15.5 dB for 78.6 MHz and 297.2 MHz for the renal and cardiac MRI setup. The B1+ simulation results for both 1H and 23Na frequencies were validated in MR experiments. The central transversal B1+ map profile is shown in Figure 3 for the simulated and measured B1+ map. They show good agreement for both frequencies taking into account the losses (-2 to -3.5 dB) caused by the interface (cables, T/R switch and phase shifting cables). With the results of the SAR simulations (Figure 4) the input power was limited to 19.8 W at 297.2 MHz and 48.0 W at 78.6 MHz to stay within the SAR10g limits of 10 W/kg for the normal operating mode under IEC guidelines9. Figure 5 shows the 1H and 23Na in vivo images of the heart and kidney as well as the overlay. 23Na images were acquired in 18 min 20 s with an isotropic resolution of 5 mm (kidney) and 6 mm (heart).Discussion & Conclusion
The transceiver array described here enables sodium imaging of the human heart and kidney at 7.0T within clinical acceptable scan times. Our proof-of-principle study in healthy subjects constitutes a precursor to broader clinical studies and for further explorations into densely packed multichannel transceiver coil arrays tailored for 23Na cardiac and renal MR. Such improvements are an important step toward exploring the potential of 23Na MRI in the assessment of cardiac and renal diseases; at 7.0T such studies will help resolve questions regarding Na+ balance and storage in myocardial and renal tissues and provide a novel strategy toward diagnosing and guiding decisions about treatments for conditions affecting these tissues.Acknowledgements
This work was supported in part by the Bundesministerium für Bildung und Forschung (BMBF, German Federal Ministry for Education and Research; grants 13GW0009A, NAMRIS and 03VP00081, renalMROXY) and by the Program on personalized medicine (iMED) of the Helmholtz Association.References
1. Ronco, C., et al., Cardiorenal syndrome. J Am Coll Cardiol, 2008. 52(19): p. 1527-39.
2. Rudy, Y., Molecular basis of cardiac action potential repolarization. Ann N Y Acad Sci, 2008. 1123: p. 113-8.
3. Maril, N., et al., Detection of evolving acute tubular necrosis with renal 23Na MRI: studies in rats. Kidney Int, 2006. 69(4): p. 765-8.
4. Waiczies, H., et al., Multi-channel double-tuned TX/RX RF coil using loop elements for 23Na and loopole elements for 1H cardiac MR imaging at 7.0 Tesla, in Intl. Soc. Mag. Reson. Med.2015: Toronto, Canada.
5. Lakshmanan, K., et al., The Loopole Antenna: Capturing Magnetic and Electric Dipole Fields with a Single Structure to Improve Transmit and Receive Performance in Intl. Soc. Mag. Reson. Med. 2014: Milan, Italy.
6. Morrell, G.R., A phase-sensitive method of flip angle mapping. Magn Reson Med, 2008. 60(4): p. 889-94.
7. Yarnykh, V.L., Actual flip-angle imaging in the pulsed steady state: a method for rapid three-dimensional mapping of the transmitted radiofrequency field. Magn Reson Med, 2007. 57(1): p. 192-200.
8. Nagel, A.M., et al., Sodium MRI using a density-adapted 3D radial acquisition technique. Magn Reson Med, 2009. 62(6): p. 1565-73.
9. Medical electrical equipment - Part 2-33: Particular requirements for the basic safety and essential performance of magnetic resonance equipment for medical diagnosis in Medical Electrical Equipment, I. Geneva, Editor 2013: International Electrotechnical Commission (IEC).
Figures