0558
Water mobility spectral imaging of the spinal cord: parametrization of model-free Laplace MRI1National Institutes of Health, Bethesda, MD, United States, 2Center for Neuroscience and Regenerative Medicine, Rockville, MD, United States
Synopsis
Diffusion magnetic resonance imaging of biological systems most often results in non-monoexponential signal, due to their complexity and heterogeneity. One approach to interpreting the data without imposing microstructural models is to fit it to a multiexponential function, and to display the coefficients as a distribution of the diffusivities. Here we suggest parameterizing the measured water mobility spectra using a bimodal lognormal function. This approach allows for a compact representation of the spectrum, while also resolving overlapping spectral peaks. We apply the method on a spinal cord sample and use it to generate robust intensity images of slow and fast-diffusion components.
Introduction
An approach similar to the one used to investigate porous media with nuclear magnetic resonance (NMR) relaxation-based methods,1 multiexponential modeling of the diffusion signal can be used to characterize heterogenous biological systems.2,3 Finding the coefficients of a multiexponential function is, in theory, equivalent to performing an inverse Laplace transformation (ILT), and, therefore, these methods are often termed Laplace NMR or MRI. Treating the diffusion signal decay as a multiexponent provides a spectrum of diffusivities, which leads to a model-free description of the water mobility. Because of the heavy data requirements, diffusion-weighted Laplace approaches have most often been limited to NMR. As methods that make Laplace MRI more feasible and accessible emerge4 and are applied,5-7 there is a concomitant growing need for dimensionality reduction. Whereas traditional Laplace NMR results in one- to three-dimensional spectral data, three additional spatial dimensions are added when this approach is combined with imaging. The increased dimensionality, along with the requirement to visualize the data in a summarized manner, creates a need for a more compact representation of the spectral information. In many instances the spectral peaks are overlapping, making it hard to robustly determine their limits. In this work, we present a method to reduce the dimensionality of the nonparametric Laplace-based diffusivity spectrum by fitting it to a bimodal parametric function.
Methods
The diffusion-weighted signal attenuation, $$$A$$$, can be described by the following discrete sum:
$$A(b_{i})=\sum_{n=1}^{N}{P(D_{n})\,\exp(-b_{i}D_{n})}+\epsilon(b), (1)$$
where $$$\epsilon(b)$$$ is the experimental noise, which is assumed to be Gaussian. The measured diffusion parameter, $$$D$$$, is distributed according to $$$P(D)$$$ with $$$N$$$ discrete components.
Reports of two dominant diffusivity regimes in nerve tissue are very common in the diffusion MR literature.8,9 These studies have led Ronen et al. to use a bimodal lognormal function to describe the estimated diffusivity distributions in the brain.3 Here we are using the same parametric function to reduce the dimensionality of the nonparametric Laplace-based diffusivity spectrum and to achieve a robust separation of overlapping spectral peaks. A bimodal lognormal distribution as a function of the diffusivity is given by
$$P_{bilog}(D) =\frac{f_{slow}}{S_{slow}\sqrt{2\pi}D}e^{-(\ln D - M_{slow})^{2}/(2S_{slow}^2)} \\ + \frac{f_{fast}}{S_{fast}\sqrt{2\pi}D}e^{-(\ln D - M_{fast})^{2}/(2S_{fast}^2)}, (2)$$
where the volume fractions, $$$f$$$, and the lognormal distribution variables, $$$S$$$ and $$$M$$$, of the slow and fast diffusion components are used. Once the nonparametric diffusivity spectrum, $$$P(D)$$$, was estimated by inverting a regularized version10 of Eq. 1, it was fed into a subsequent optimization procedure that fit it to Eq. 2.
Results and Discussion
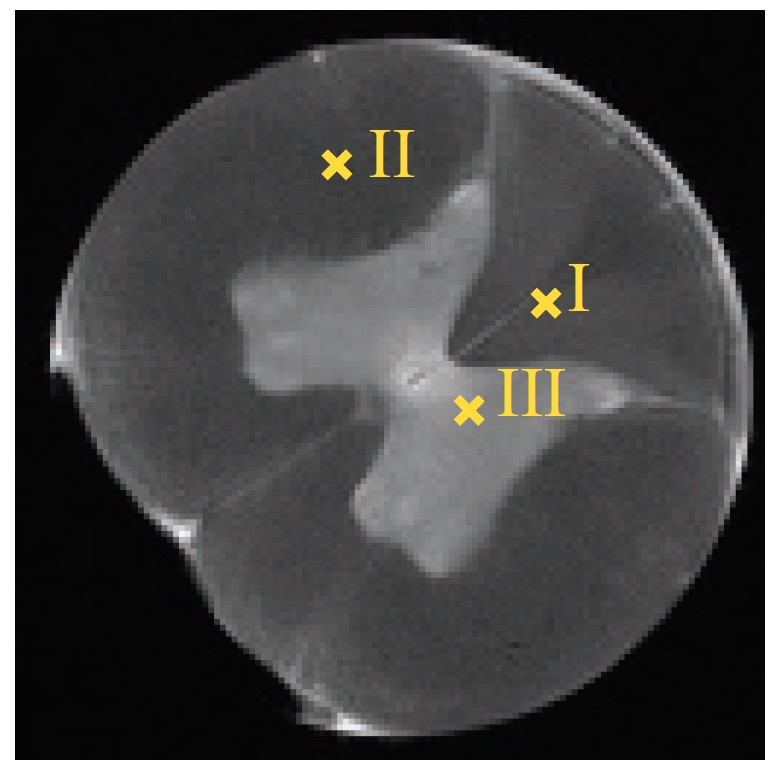
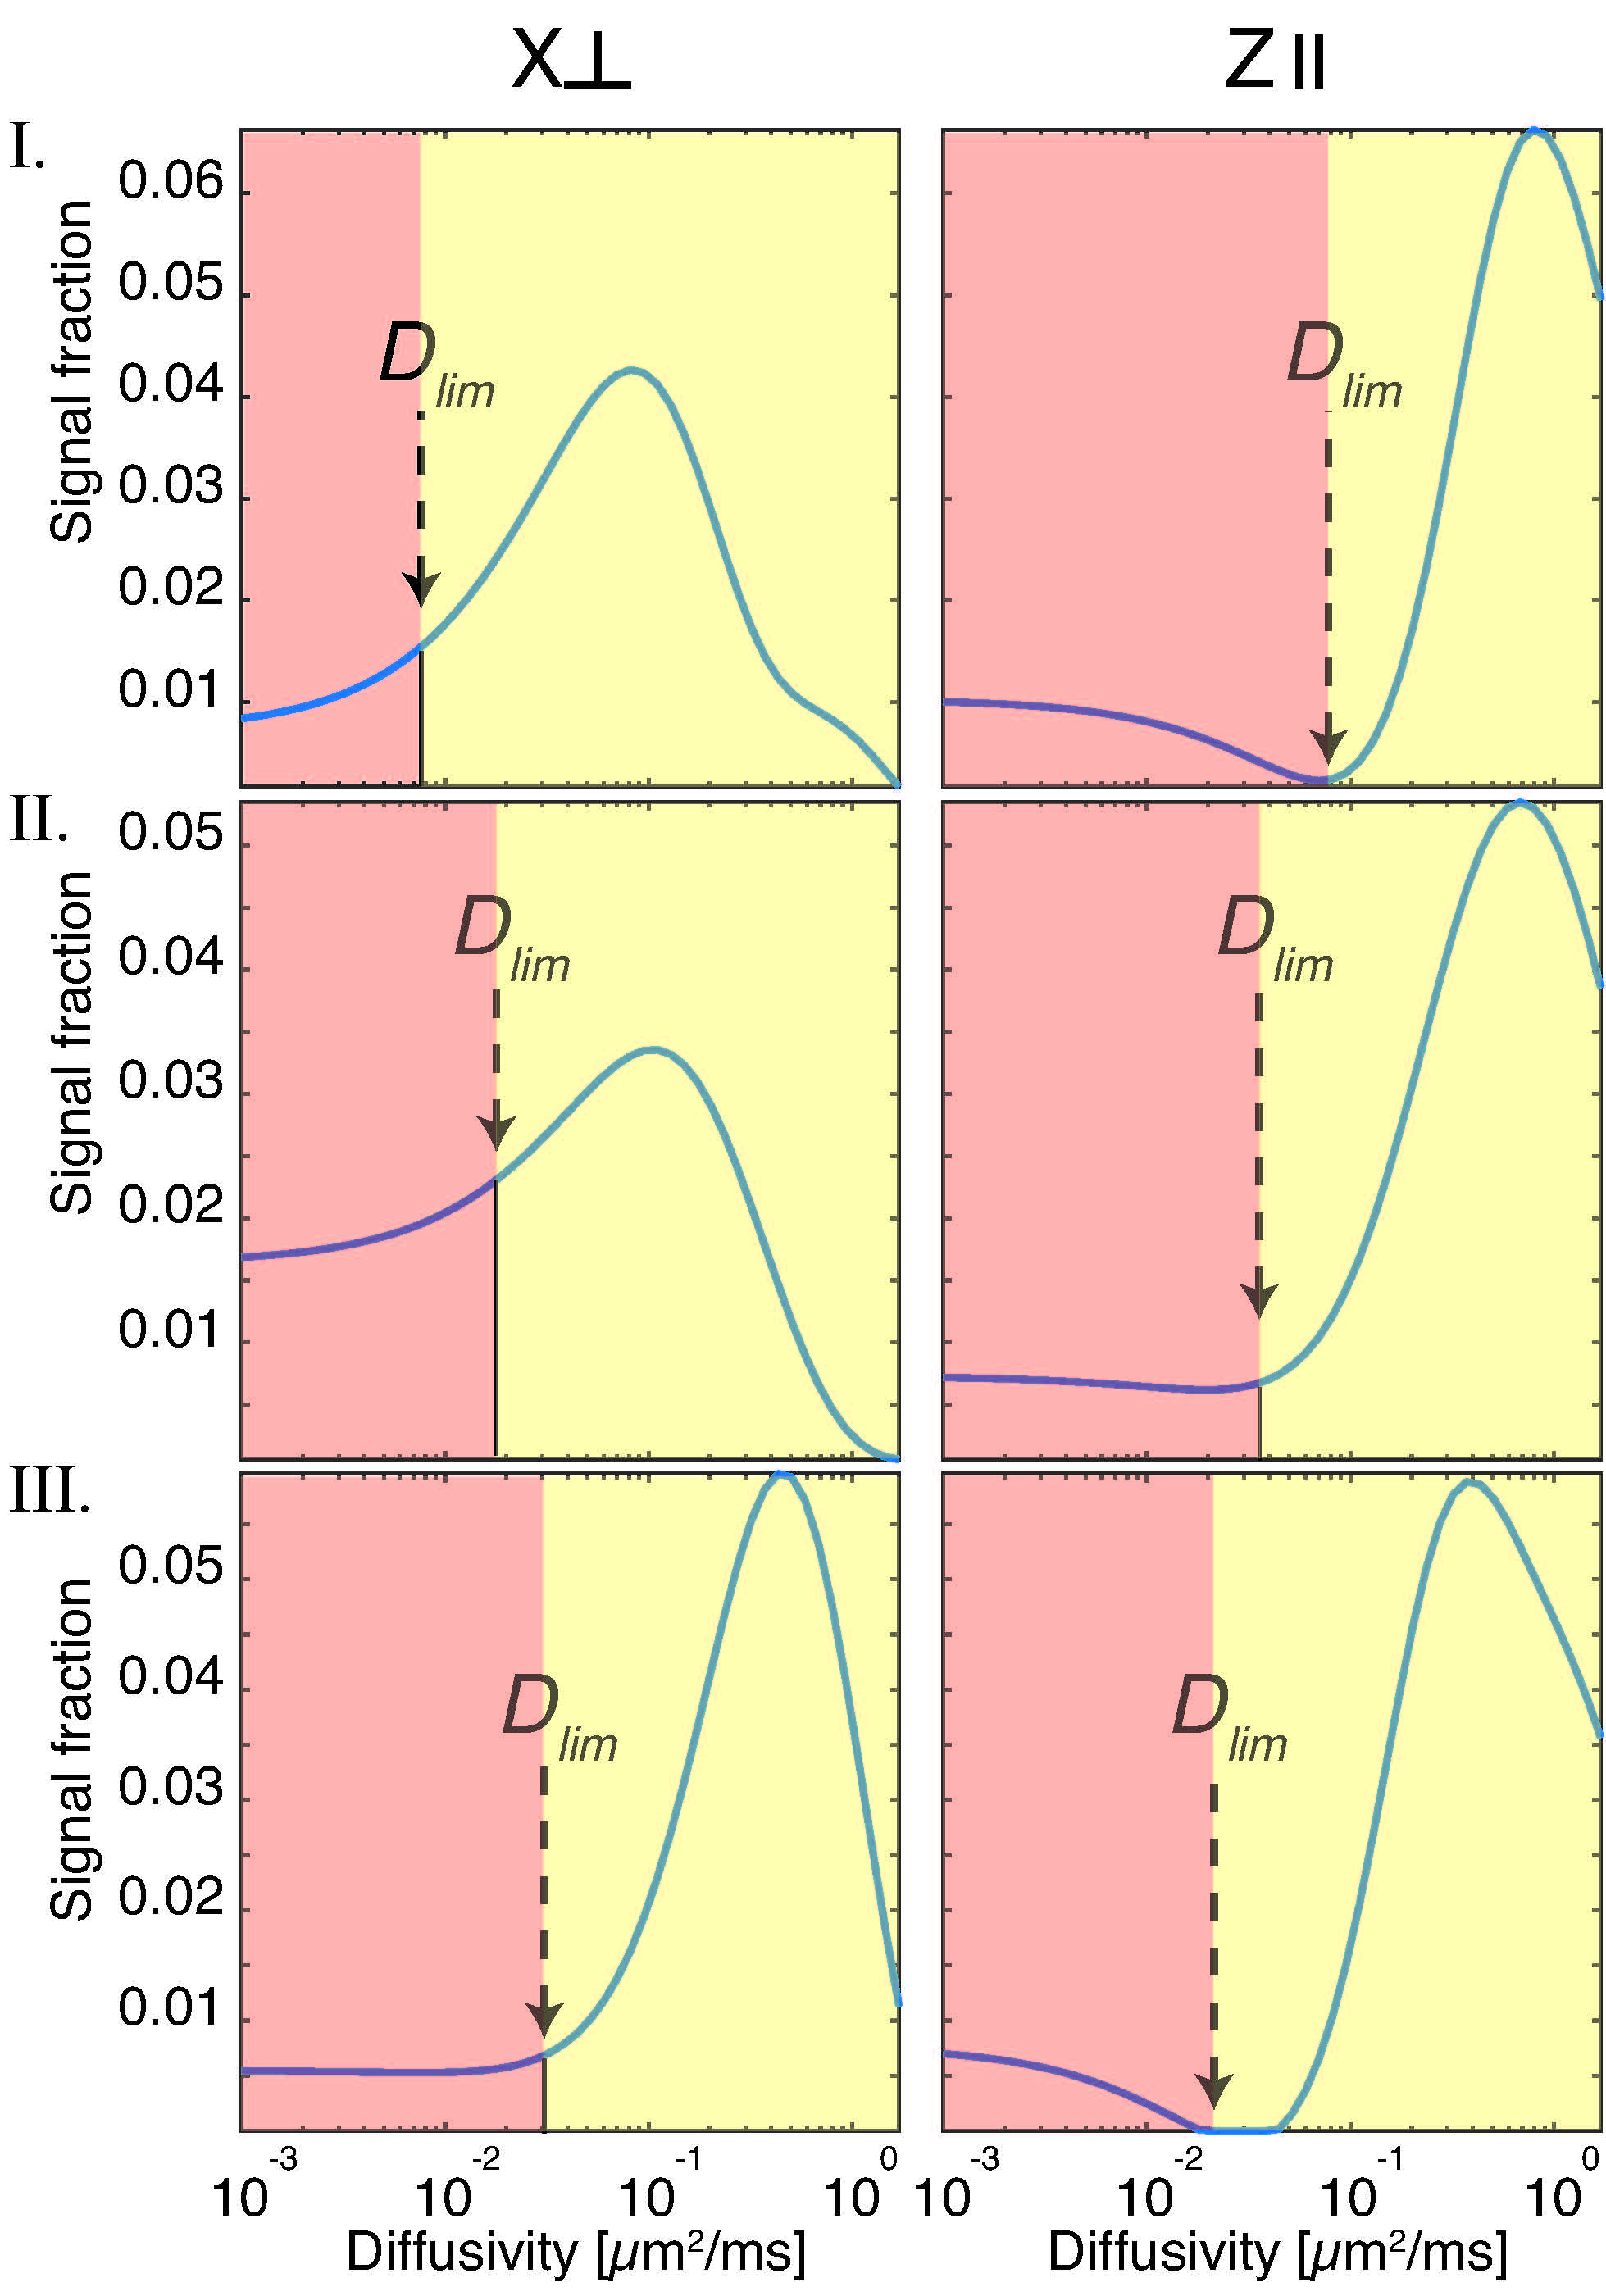
The arrows in Fig. 2 point to potential $$$D_{lim}$$$ values, which change and move as a function of tissue type and orientation. Thus, a global $$$D_{lim}$$$ value does not exist, and the choice of such value would significantly bias the resulting signal fraction. Although the nonparametric distribution (i.e., the one obtained directly from solving Eq. 1 contains the richest information compared with a parametric model, it may be challenging to interpret. Specifically, the overlapping spectral components are often hard to resolve, and the fact that their location on the spectrum is not constant, make it very difficult to automatically determine where one peak ends and the other begins. Fitting the diffusion spectrum in each voxel to the bimodal lognormal function in Eq. 2 allowed for a more robust interpretation of the data. Examples from white and gray matter, and from parallel and perpendicular orientations are shown in Fig. 3. Regardless of the tissue type or orientation, the parametrization captured most of the information contained within the nonparametric distributions.
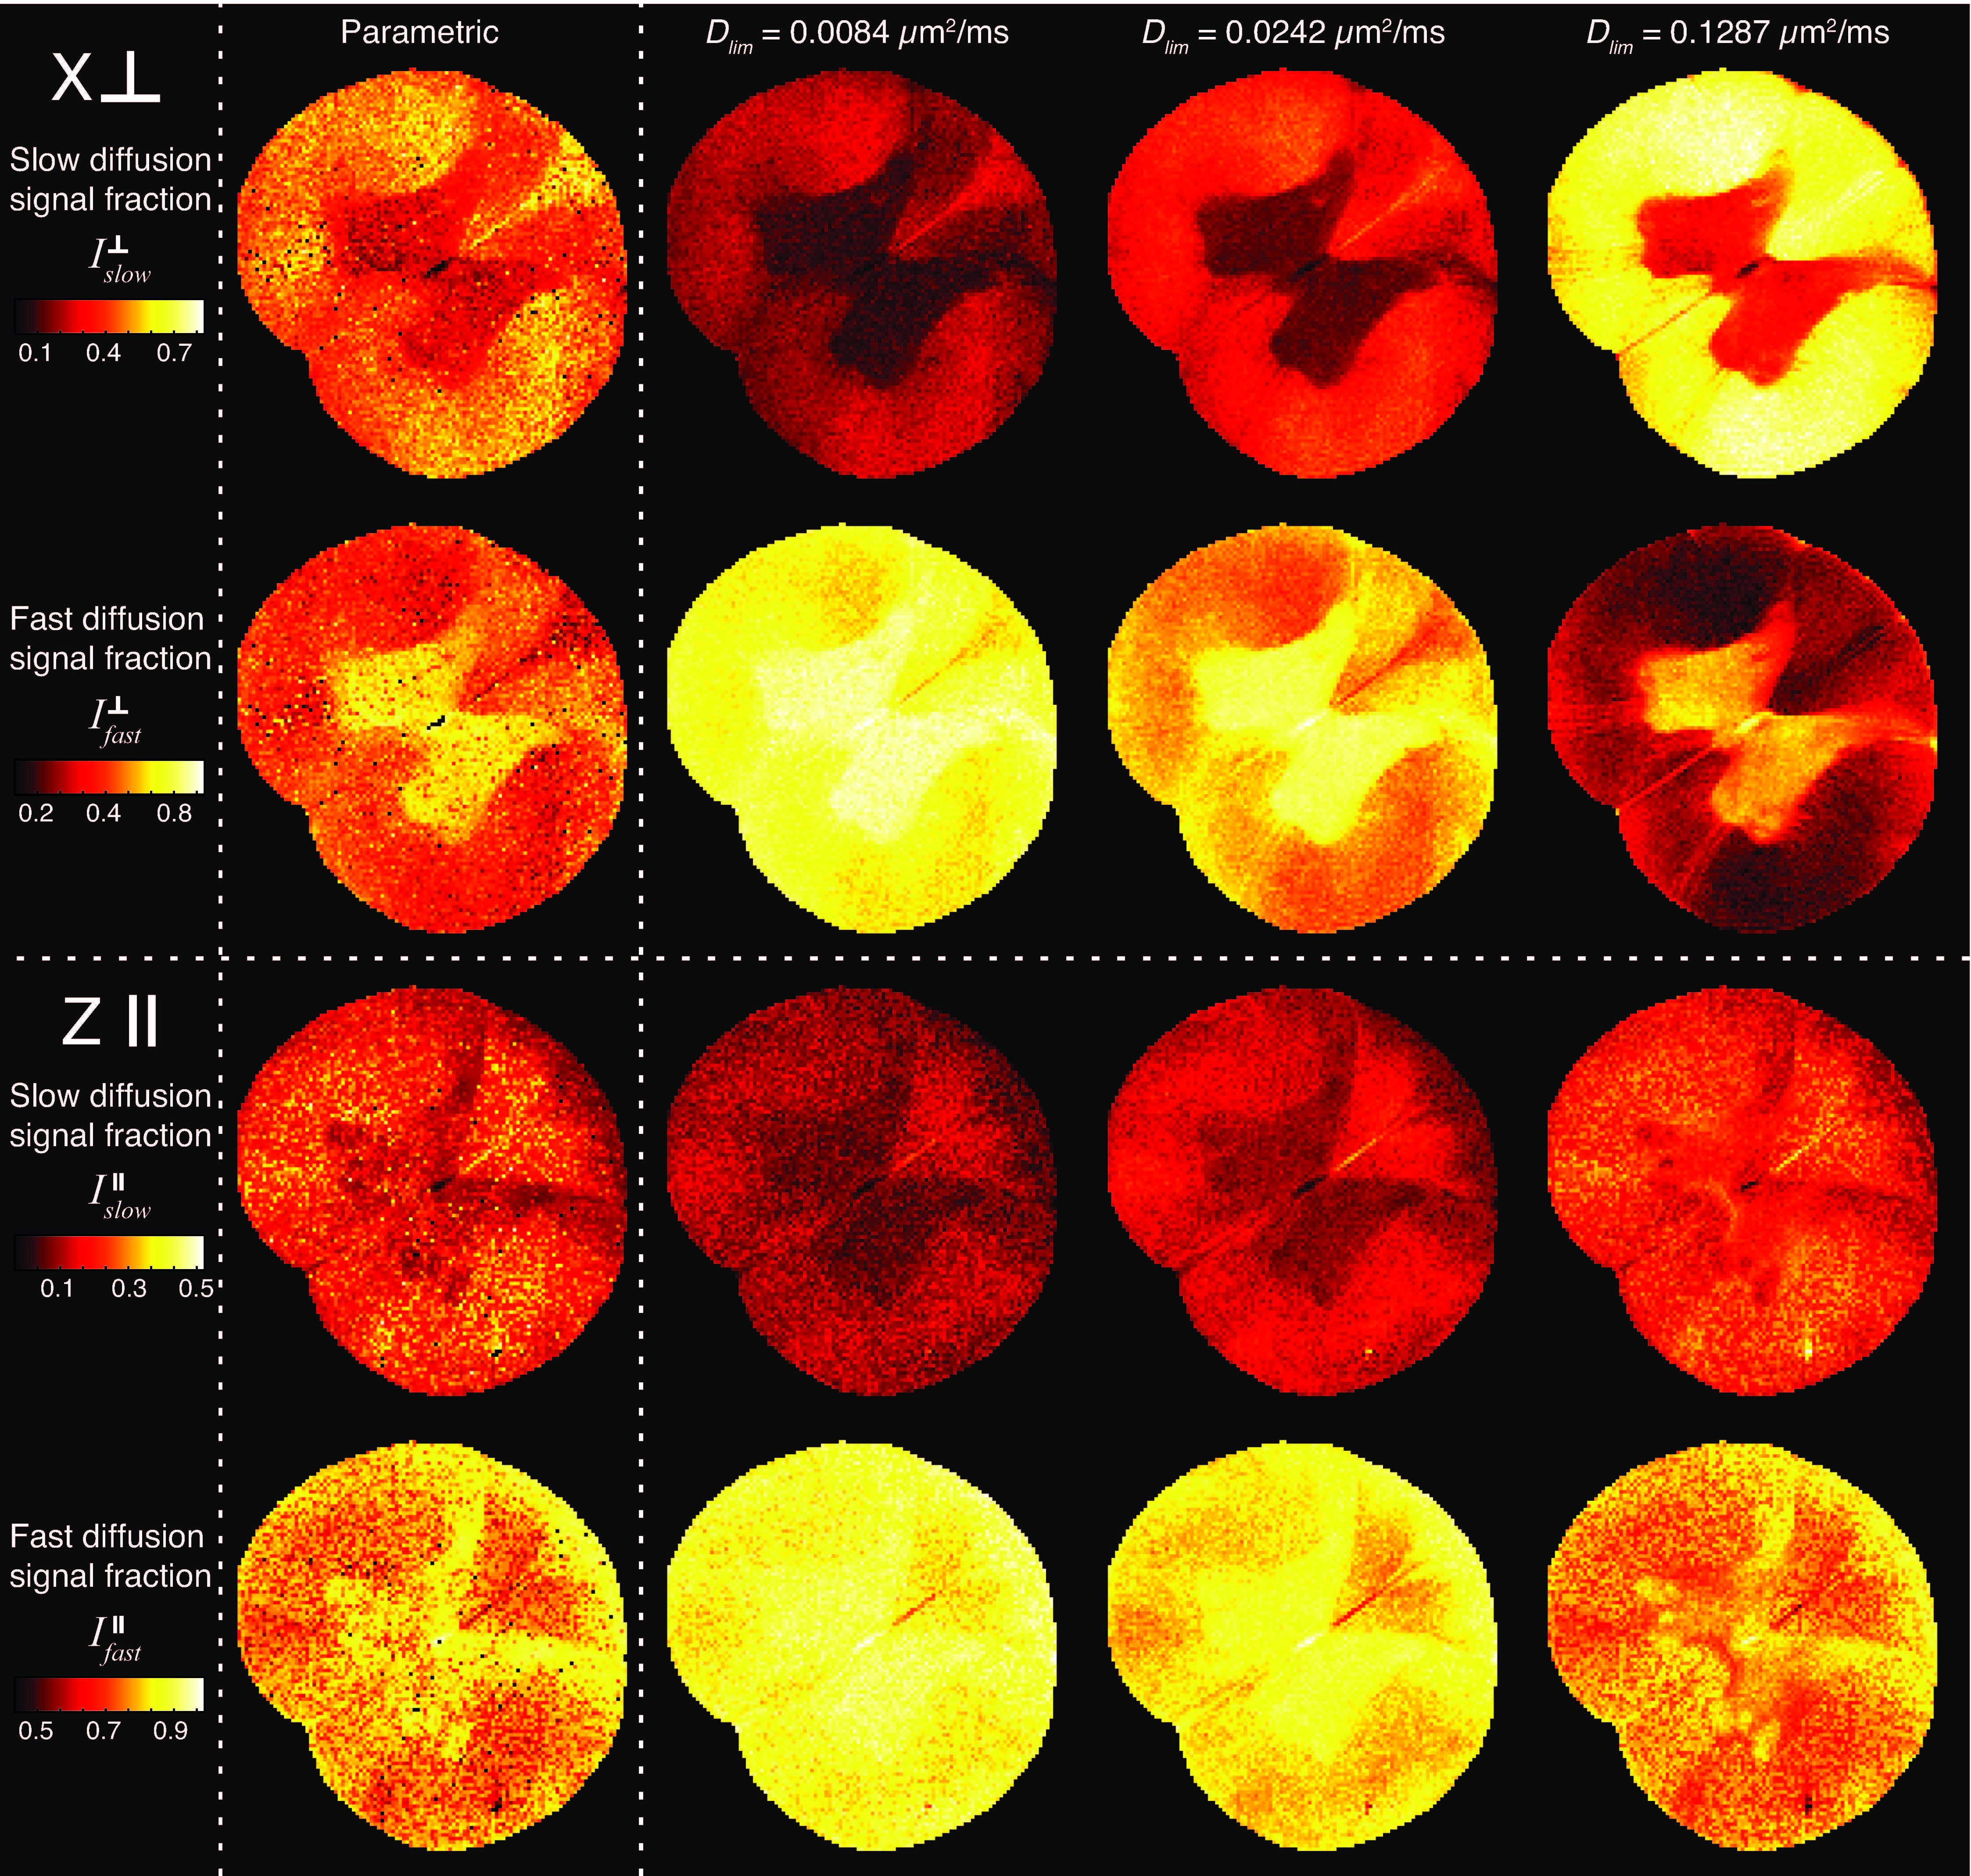
When a voxelwise analysis is desired, the large number of voxels requires a completely automated and robust method to identify the peaks and their point of separation and to resolve them. Knowing the parametric form of the slow and the fast diffusion spectral components allows for a simple integration over their entire range, which results in their respective signal fractions images, shown in Fig. 4. The parametric $$$X$$$ diffusion images demonstrated a typical white-gray matter contrast, which is attributed to the higher density and content of barriers perpendicular to the spine's axis of symmetry in white matter, compared with gray matter.6
Conclusions
In this paper we suggested parameterizing the empirically measured diffusivity spectra obtained from Laplace dMRI spinal cord data. The advantage is twofold: (1) the parametric form has a compact representation of the spectra, which can be used to infer useful statistical quantities, and (2) it provides a robust method to resolve overlapping spectral peaks. We note that this parametrization approach is not limited to diffusion-based Laplace applications but can also be used to process relaxation spectra (e.g., $$$T_1$$$ and $$$T_2$$$ distributions), and to characterize and reduce the dimensionality of multidimensional Laplace MRI data, such as $$$D$$$-$$$T_1$$$.6
Acknowledgements
This work was supported by funds provided by the Intramural Research Program of the Eunice Kennedy Shriver National Institute of Child Health and Human Development (grant number ZIAHD000266).References
- Whittall KP, MacKay AL. Quantitative interpretation of NMR relaxation data. Journal of Magnetic Resonance. 1989;84:134152.
- Pfeuffer J, Provencher SW, Gruetter R. Water diffusion in rat brain in vivo as detected at very large b values is multicompartmental. Magma. 1999;8:98-108.
- Ronen I, Moeller S, Ugurbil K, et al. Analysis of the distribution of diffusion coefficients in cat brain at 9.4T using the inverse Laplace transformation. Magnetic Resonance Imaging. 2006;24:61-68.
- Benjamini D, Basser PJ. Use of marginal distributions constrained optimization (MADCO) for accelerated 2D MRI relaxometry and diffusometry. Journal of Magnetic Resonance. 2016;271:40-45.
- Benjamini D, Komlosh ME, Basser PJ. Imaging Local Diffusive Dynamics Using Diffusion Exchange Spectroscopy MRI. Physical Review Letters. 2017;118:158003.
- Benjamini D, Basser PJ. Magnetic resonance microdynamic imaging reveals distinct tissue microenvironments. NeuroImage. 2017;163:183-196.
- Kim D, Doyle EK, Wisnowski JL, et al. Diffusion-relaxation correlation spectroscopic imaging: A multidimensional approach for probing microstructure. Magnetic Resonance in Medicine. 2017;78:2236-2249.
- Le Bihan D, Moonen CT, van Zijl PC, et al. Measuring random microscopic motion of water in tissues with MR imaging: a cat brain study. Journal of Computer Assisted Tomography. 1991;15:19-25.
- Niendorf T, Dijkhuizen RM, Norris DG, et al. Biexponential diffusion attenuation in various states of brain tissue: implications for diffusion-weighted imaging. Magnetic Resonance in Medicine. 1996;36:847-57.
- Hansen PC. Analysis of Discrete Ill-Posed Problems by Means of the L-Curve. SIAM Review. 1992;34:561-580.
Figures
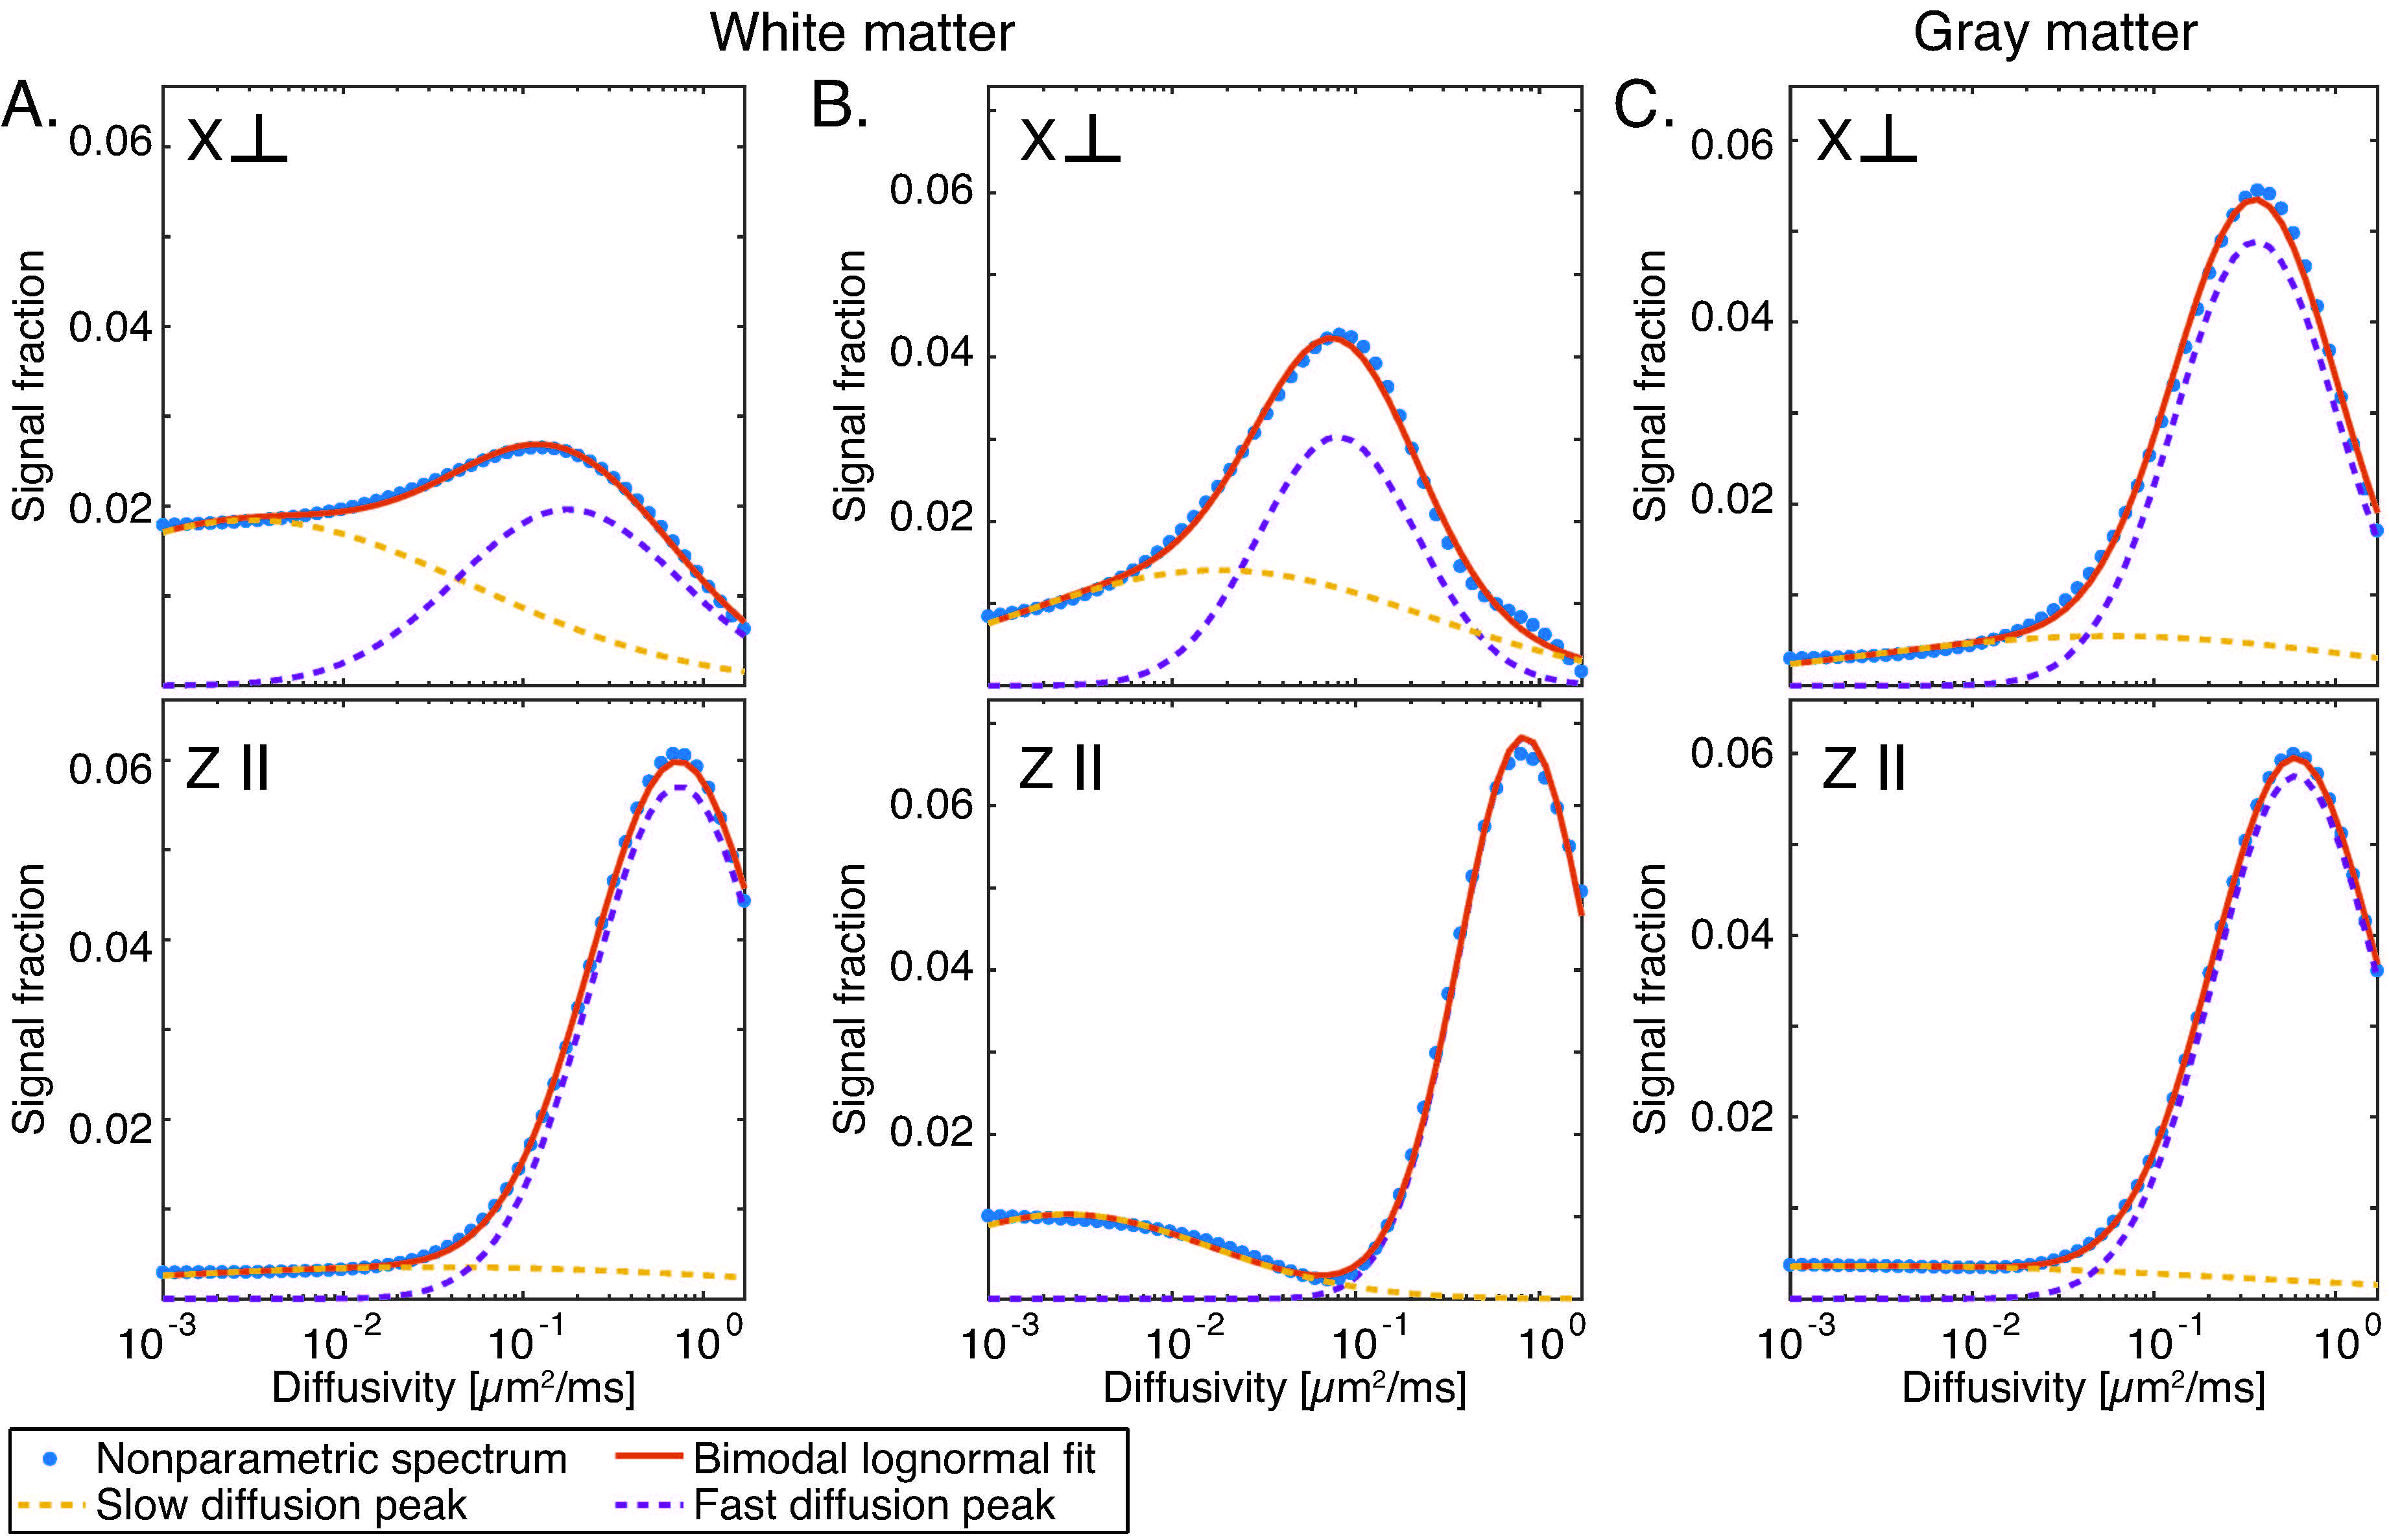
The nonparametric distributions and their fitted parametric models. Spectra from three representative voxels: two in white matter (A and B) and one in gray matter (C), with diffusion encoding perpendicular and parallel to spinal cord. Using a bimodal function to fit the data involves the assumption that the diffusivity spectrum should not contain more than two resolvable peaks. This assumption sounds very limiting; however, a continuously growing body of research demonstrates that dMRI or dNMR signal from nerve tissue contains two observable diffusion regimes, and numerically inverting such one-dimensional data very rarely results in more than two distinct spectral peaks.