0556
Improved precision and accuracy in q-space trajectory imaging by model-based super-resolution reconstruction1imec-Vision Lab, Dept. of Physics, University of Antwerp, Antwerp, Belgium, 2Brigham and Women's Hospital, Boston, MA, United States, 3Harvard Medical School, Boston, MA, United States, 4Medical Radiation Physics, Lund University, Lund, Sweden
Synopsis
Q-space trajectory imaging (QTI) facilitates tensor-valued diffusion encoding with variable shapes and provides more specific parameters than those available from conventional stick-shaped encoding. However, it generally requires longer echo times than conventional encoding, impacting the spatial resolution, scan time or signal-to-noise ratio. In this work, we propose a super-resolution acquisition and reconstruction approach for QTI that allows high-resolution parameter maps to be estimated from multiple low-resolution images. Using simulations and real data, we show that this does not only improve QTI’s precision, it also significantly improves its accuracy, as it avoids deleterious signal bias caused by the noise floor.
Introduction
Q-space trajectory imaging (QTI) facilitates tensor-valued diffusion encoding with variable shapes, such as planar and spherical encoding, which can provide additional information not available with conventional stick shaped b-tensors1,2. By assuming that the diffusion in heterogeneous tissue can be modelled by a diffusion tensor distribution (DTD), the addition of b-tensors with different shapes can be used to disentangle variation in diffusivity from variation in microscopic anisotropy and orientation dispersion. This provides more specific parameters than those available from conventional diffusion MRI (dMRI). However, tensor-valued encoding generally requires longer echo times than conventional encoding, impacting the spatial resolution, scan time or signal-to-noise ratio (SNR). To address this issue, we propose a new model-based super-resolution acquisition and reconstruction approach for QTI.Methods
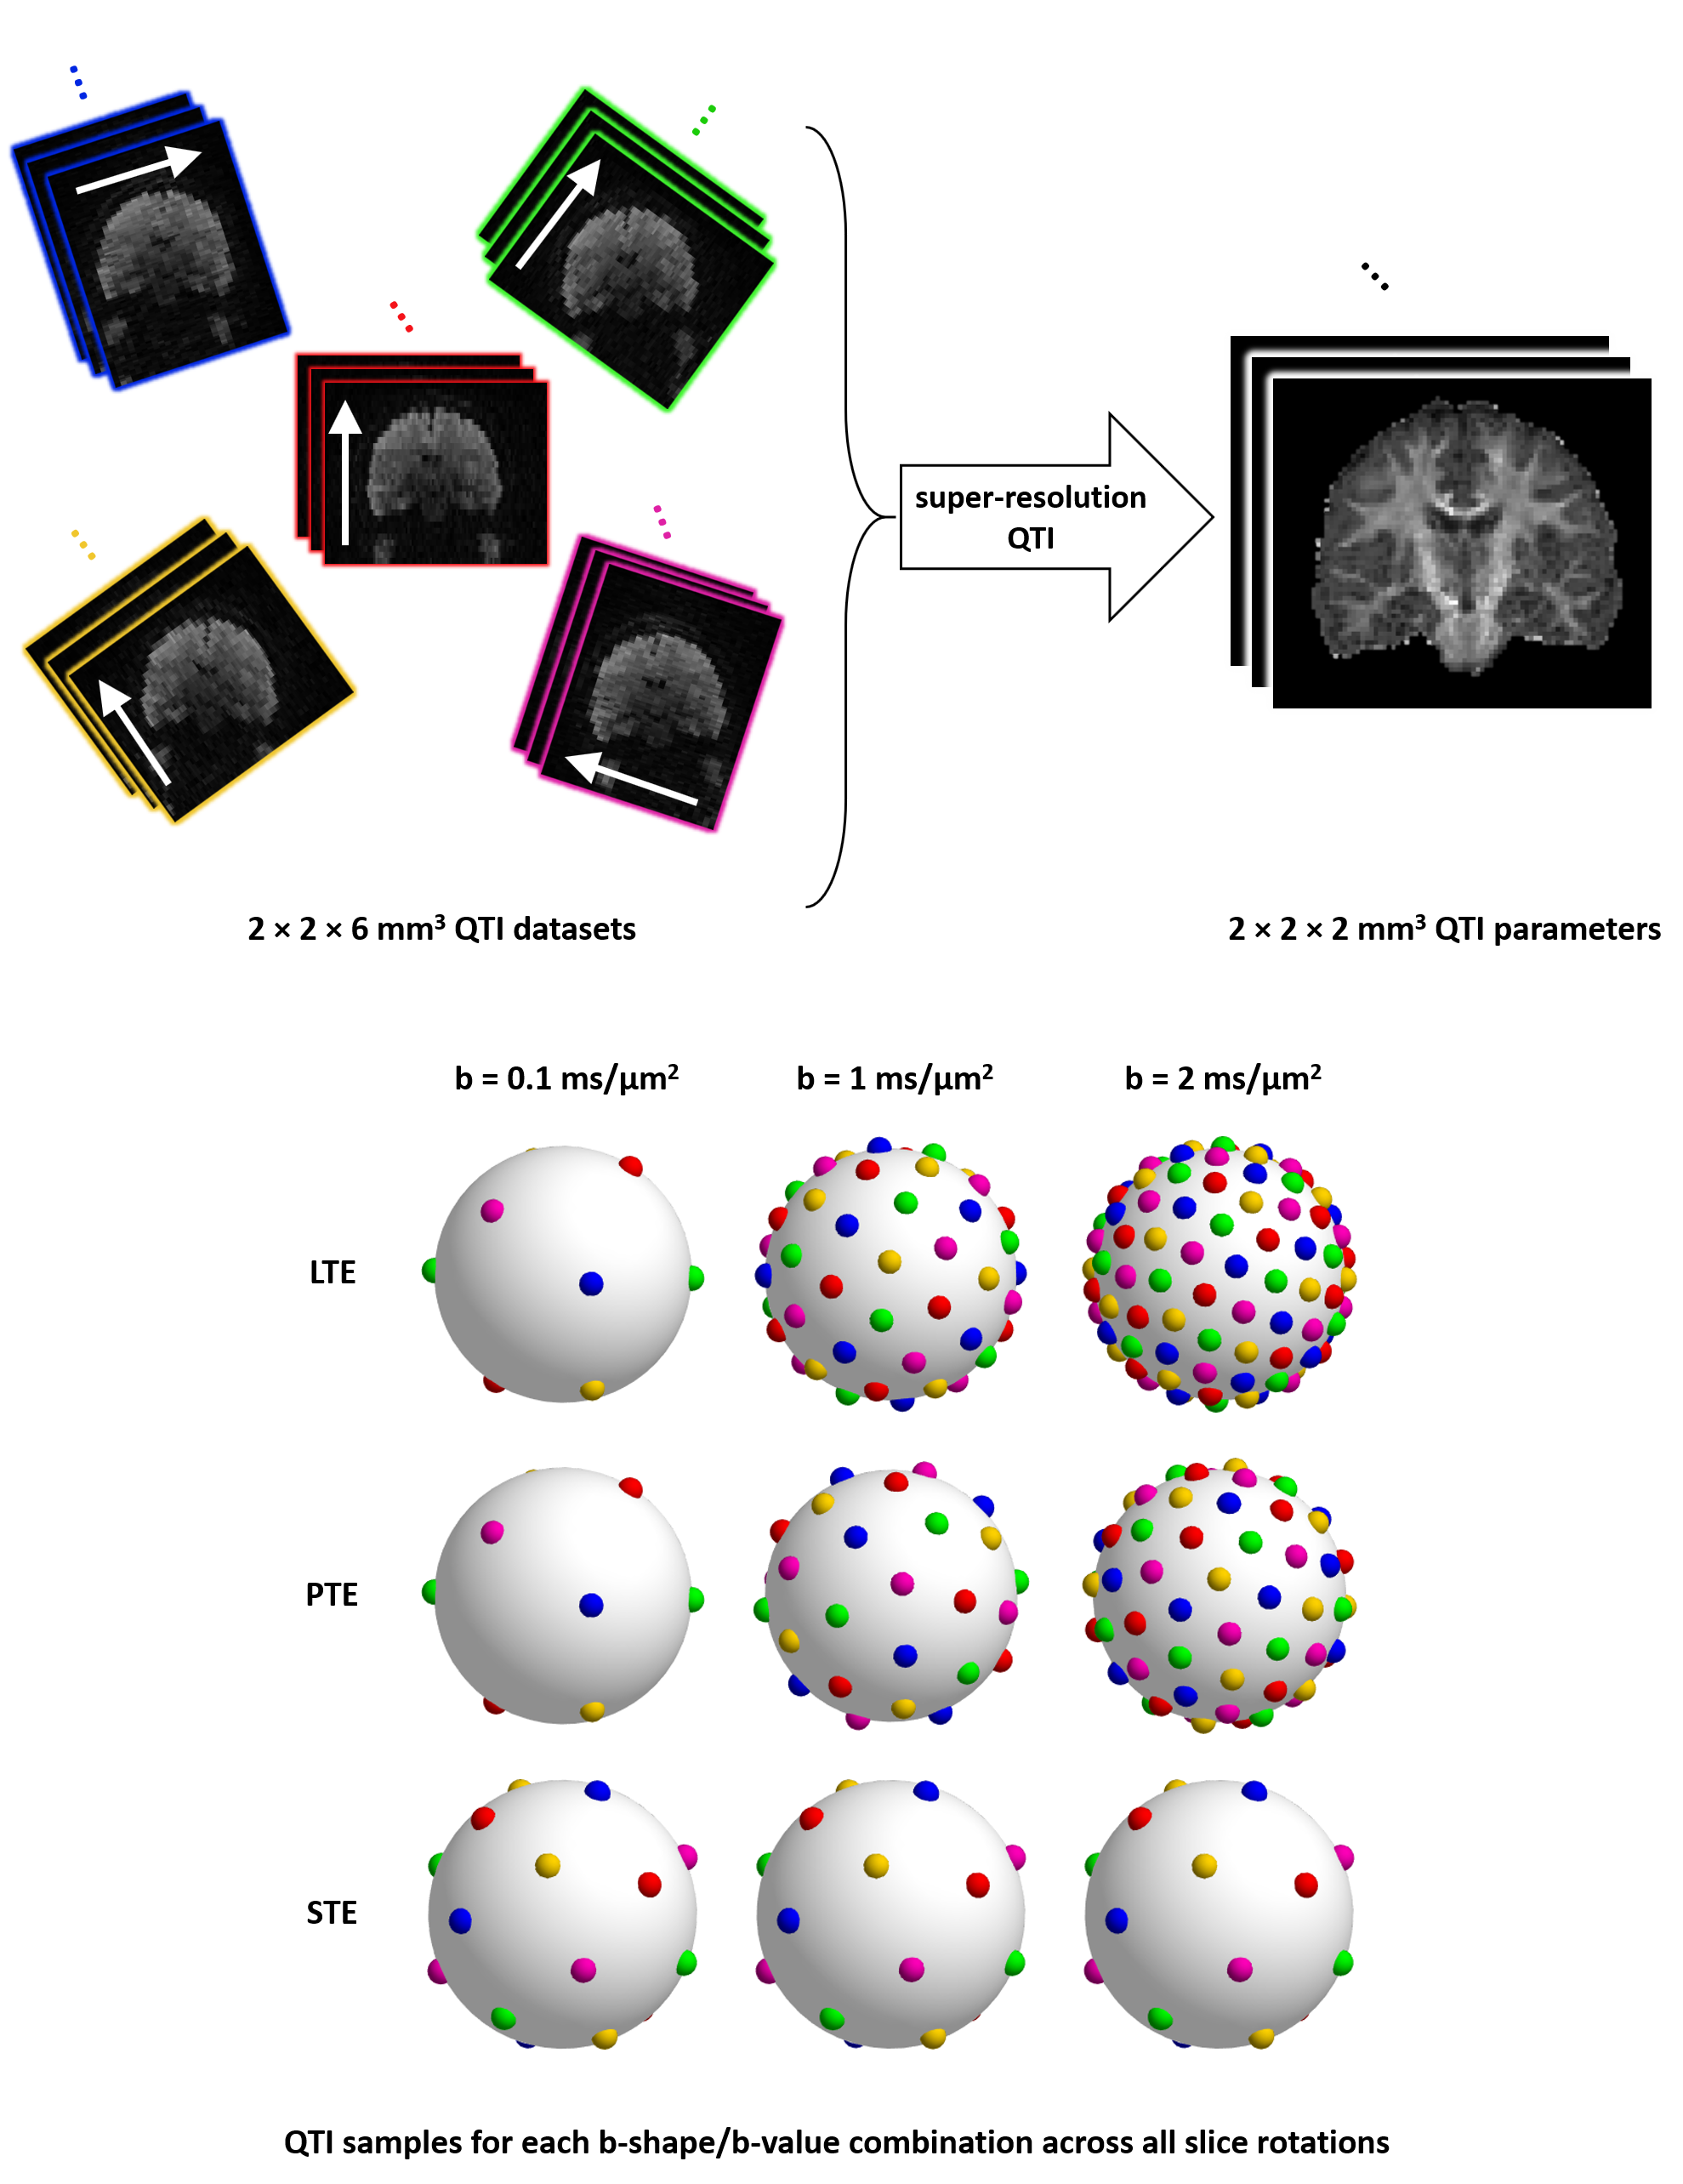
Model-based super-resolution reconstruction is the process of producing a high-resolution parameter map directly from a sequence of low-resolution images3. Acquiring data sets with thick slices results in reduced acquisition time and increased SNR; the loss of resolution along the slice direction can be recovered by combining multiple data sets with different slice orientations (see Fig.1).
Acquisition
dMRI data were acquired on a 3T MAGNETOM Prisma with a 20-channel head coil array (Siemens Healthcare, Erlangen, Germany) with a prototype spin-echo sequence that enables linear (LTE), planar (PTE) and spherical tensor encoding (STE)1,2. The gradient waveforms were asymmetric and optimized for minimal TE4, and compensated for concomitant fields5.
Super-resolution-QTI: 5 data sets with spatial resolution 2×2×6mm3 were acquired, each with a unique slice rotation = [-72°,-36°,0°,36°,72°], targeting 2×2×2mm3 super-resolution reconstruction (see Fig.1). Each data set contained a unique set of 31 samples combining b = [0.1,1,2]ms/μm2; and LTE, PTE and STE shapes, resulting in 155 unique samples across all rotations6. TR/TE was 3900ms/91ms, resulting in a total acquisition time of approximately 10 minutes.
Direct acquisition: Within the same acquisition time, a direct 2×2×2mm3 data set was acquired with TR/TE=11600ms/91ms, accommodating 55 unique QTI samples.
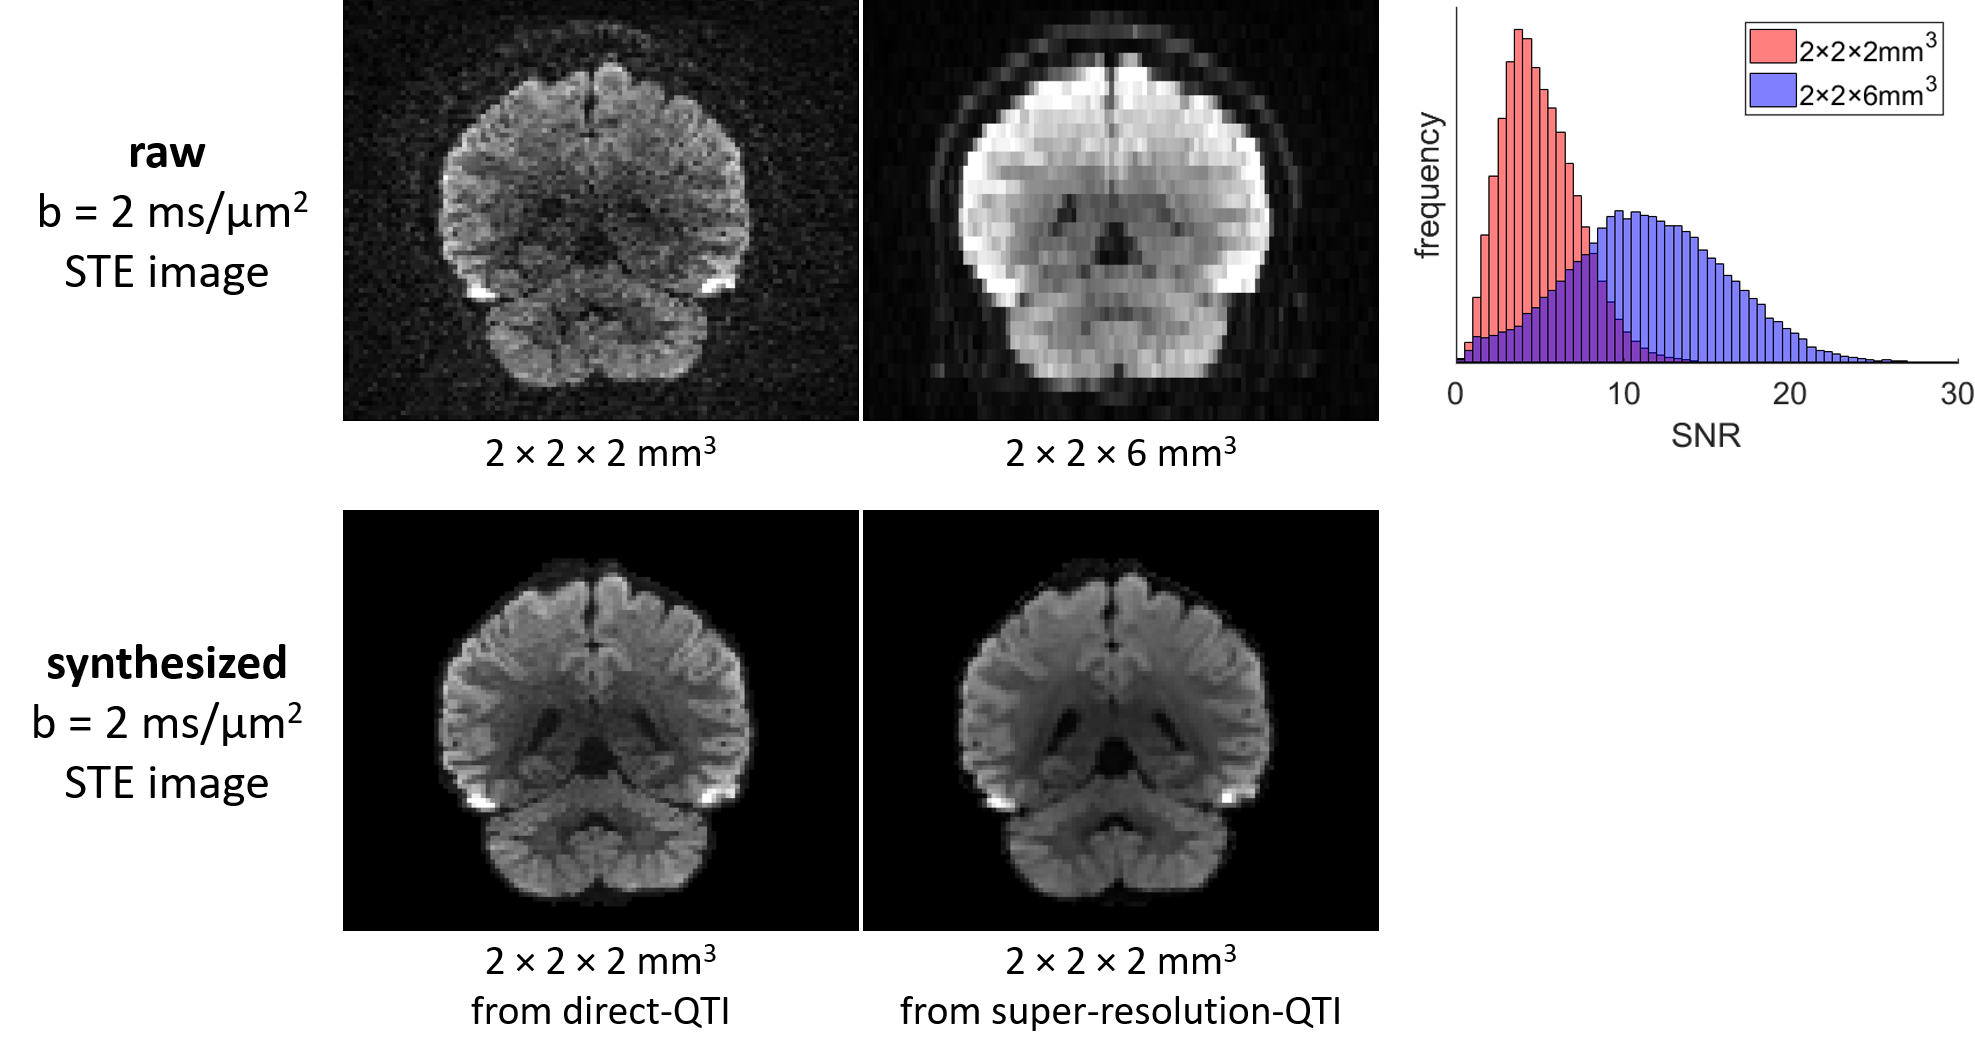
In white matter, SNR of the raw b=0.1ms/μm2 images was approximately 30 for the super-resolution and 10 for the direct acquisition7.
Modeling and super-resolution reconstruction
QTI is typically performed voxel-wise and can be cast as a least squares problem:
$$\hat{\mathbf{x}}=\text{arg}\min\limits_{\mathbf{x}}\,\lVert \exp(\mathbf{B}\mathbf{x})−\mathbf{y}\rVert_2^2\quad\text{subject to}\quad\mathbf{C}\mathbf{x} \ge \mathbf{0}\quad\quad\small{\text{(1)}}$$
where $$$\small{\exp(\mathbf{B}\cdot)}$$$ is the forward modelling operation relating the log of the non-diffusion-weighted signal, the DTD mean and the DTD covariance, represented in parameter vector $$$\small{\mathbf{x}}$$$, to the vector of measured dMRI intensities, $$$\small{\mathbf{y}}$$$. We also include a constraint matrix $$$\small{\mathbf{C}}$$$ enforcing non-negative diffusivities and kurtoses as well as monotonic signal decay with increasing b-value8.
Eq. 1 can be extended to support volume-wise super-resolution estimation of the QTI parameters:
$$\hat{\mathbf{x}}^\prime=\text{arg}\min\limits_{\mathbf{x^\prime}}\,\lVert\mathbf{A} \exp(\mathbf{B}^\prime\mathbf{x}^\prime)−\mathbf{y}^\prime\rVert_2^2\quad\text{subject to}\quad\mathbf{C}^\prime\mathbf{x}^\prime \ge \mathbf{0}$$
where $$$\small{\exp(\mathbf{B}^\prime\cdot)}$$$ is the volume-wise forward modelling operation and $$$\small{\mathbf{A}}$$$ is the super-resolution sampling matrix, relating the signal intensities expected in all high-resolution voxels to the acquired dMRI signal intensities in all low-resolution voxels9, $$$\small{\mathbf{y}^\prime}$$$; and $$$\small{\mathbf{C}^\prime}$$$ is the volume-wise constraint matrix.
Evaluation
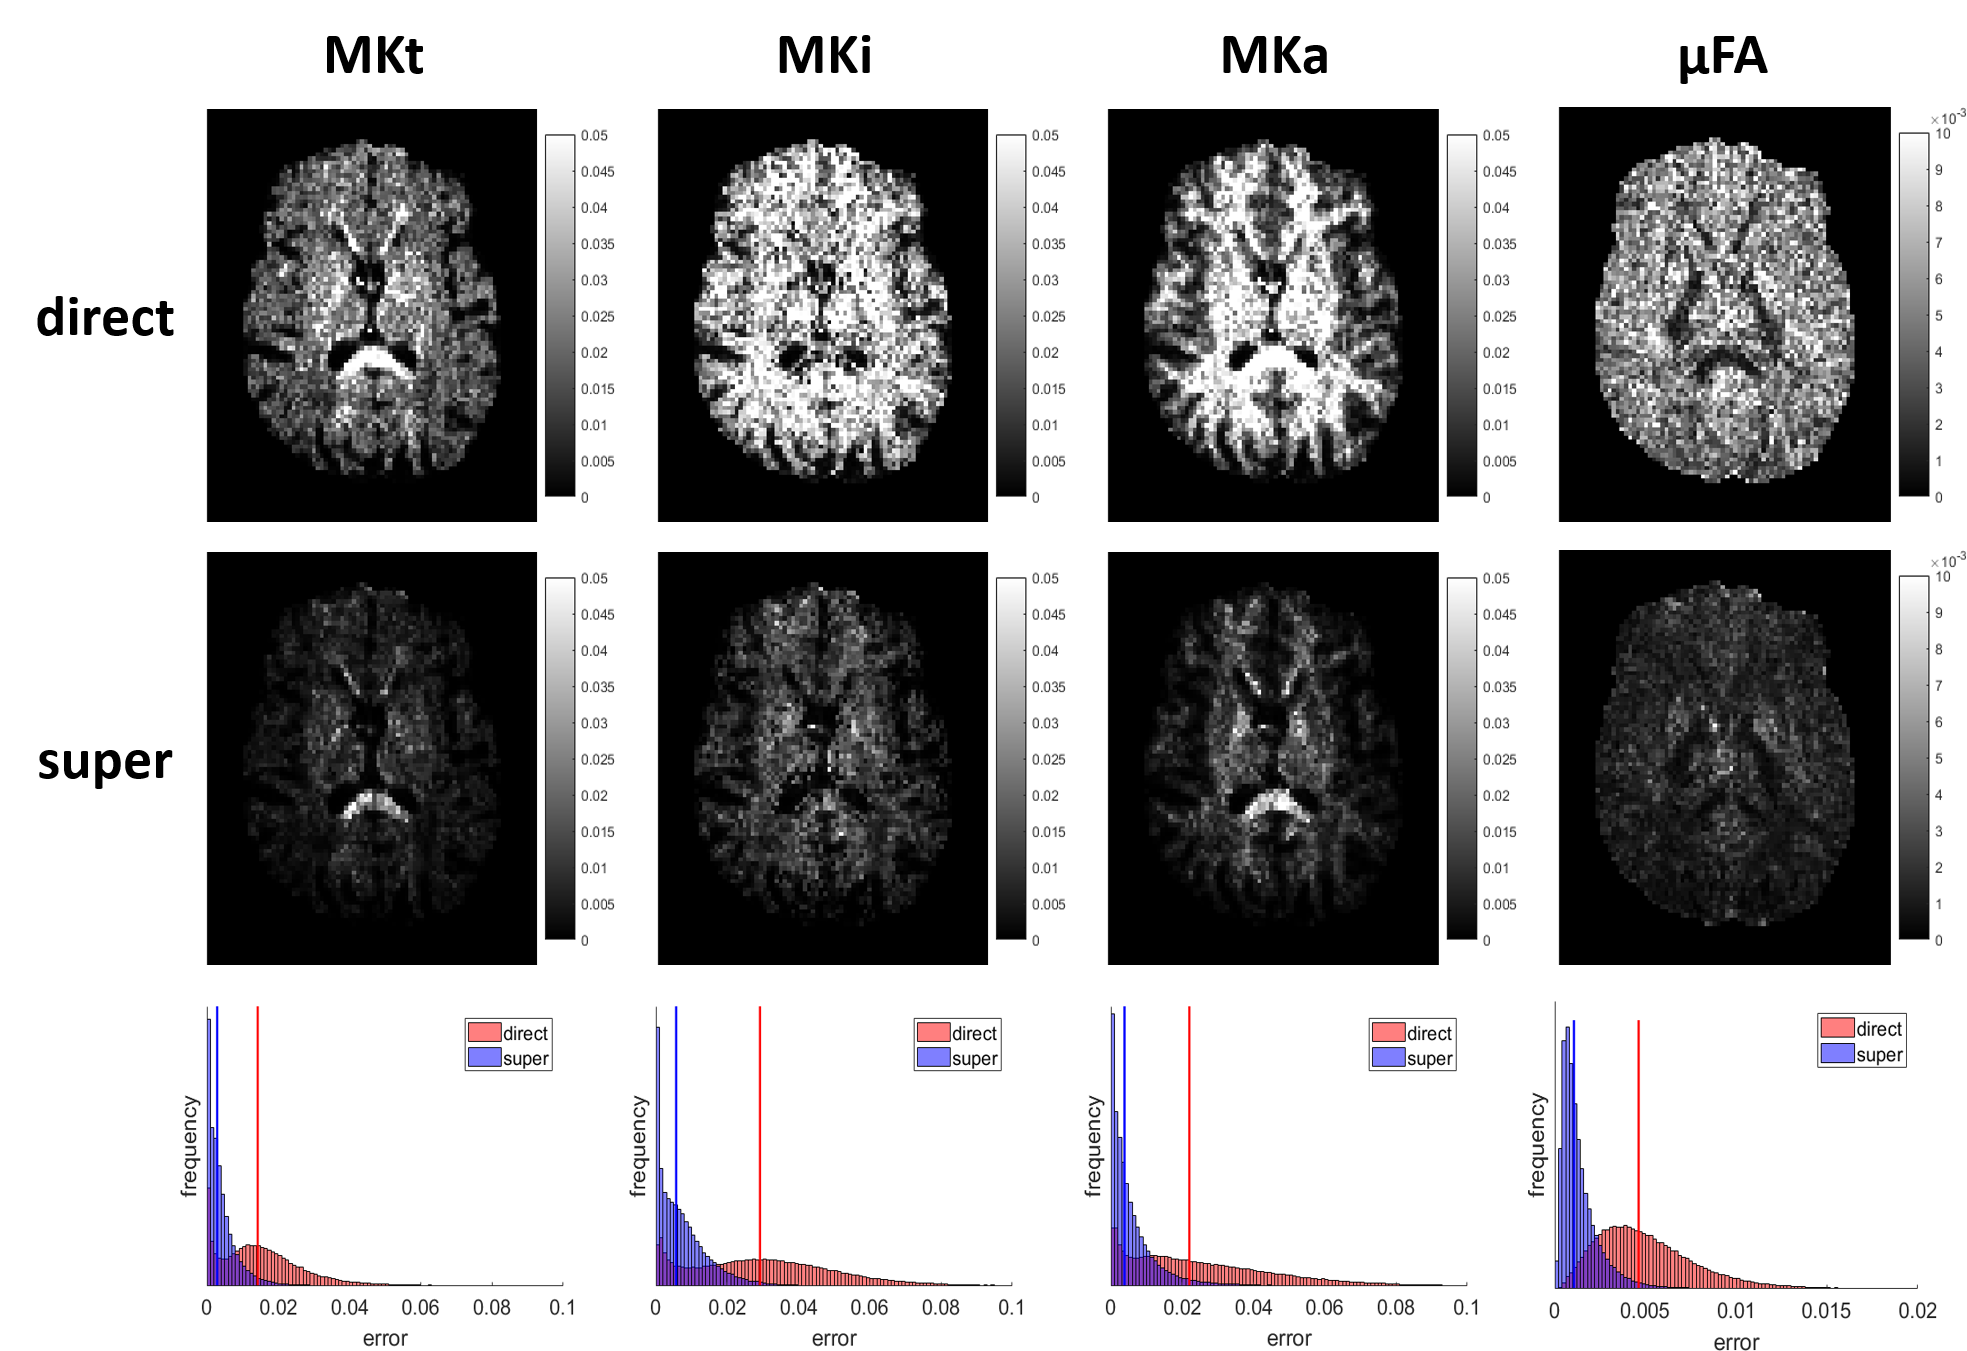
Both acquisition and estimation approaches were evaluated using both simulations and a real data experiment. From ground-truth whole-brain QTI parameters, both a direct and a super-resolution data set were synthesized using the forward (super-resolution) QTI model and the real-data characteristics. For each data set, 20 noisy realizations (Rician distributed) were generated, enabling quantitative analysis of precision and accuracy of direct- vs. super-resolution-QTI. Real data were assessed qualitatively.
Results
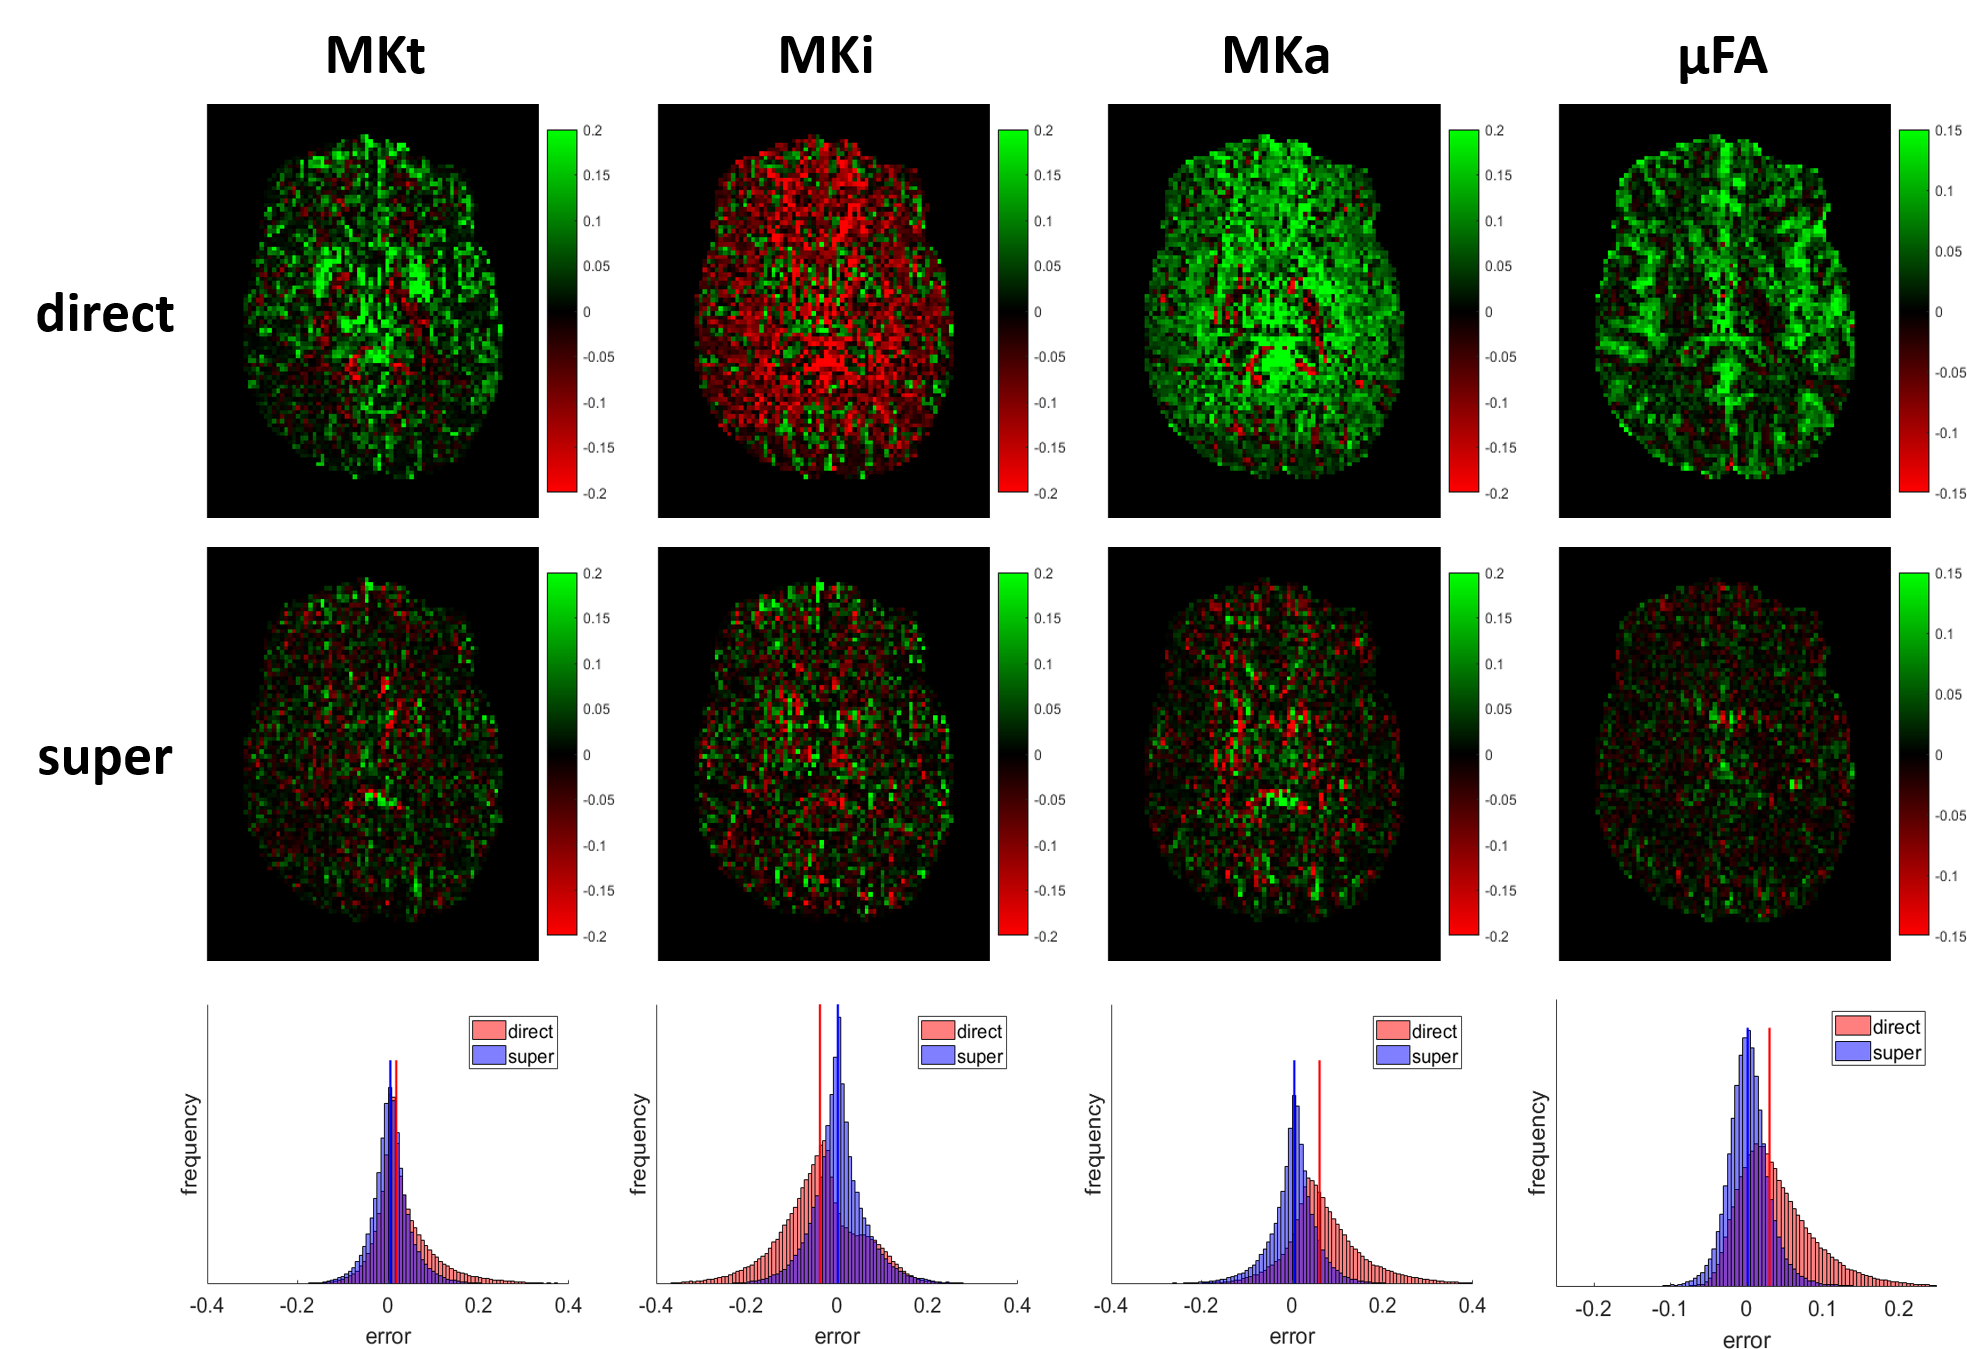
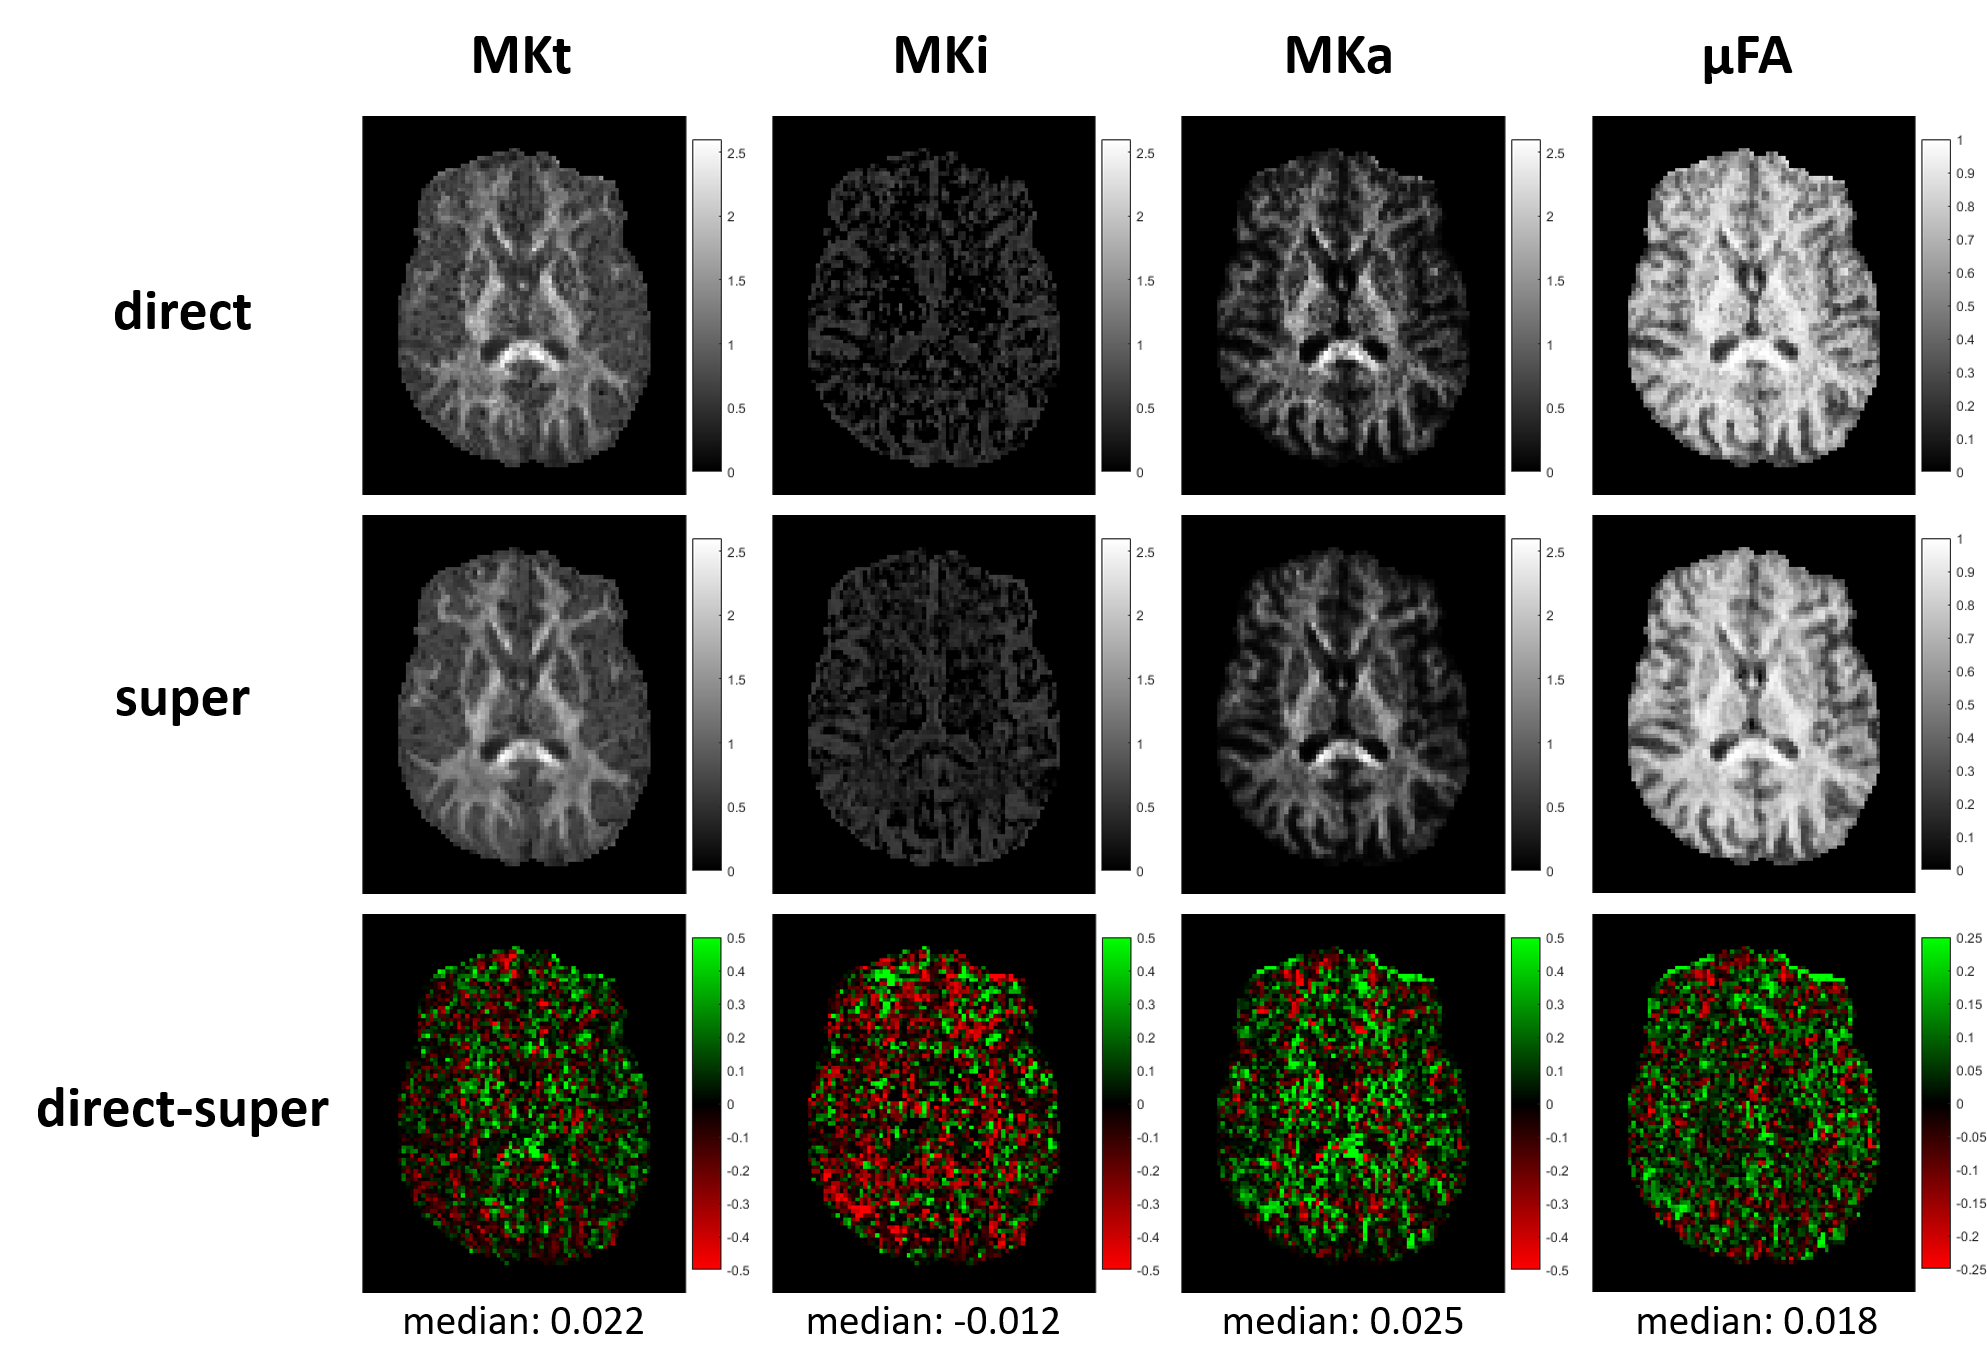
Real data results in Fig.2 demonstrate that super-resolution-QTI can recover the fine details in the slice direction and produces synthesized dMRI data that contain less noise than those acquired directly. Simulation results in Fig.3 show that super-resolution-QTI clearly improves precision of the QTI parameters compared to direct-QTI. Fig.4 demonstrates that direct-QTI overestimates MKt, MKa and μFA, and underestimates MKi. Interestingly, this bias can be reduced almost completely by using super-resolution-QTI, which elevates the baseline signal away from the noise floor using thick slices. These simulation results are corroborated by the real-data results in Fig.5: super-resolution-QTI parameter maps appear less noisy and the difference maps between direct and super-resolution-QTI exhibit the same trend as the bias maps in Fig.4.Discussion
We have demonstrated QTI with super-resolving capabilities, allowing high-resolution parameter maps to be estimated from multiple low-resolution images. By acquiring data with thick slices, we can boost the raw SNR and accelerate the acquisition. Using simulations and real data, we have shown that not only does this improve the precision of QTI, it also significantly improves its accuracy, as we can avoid deleterious signal bias caused by the noise floor. We expect this approach to improve the statistical characteristics of QTI parameters, leading to higher statistical power10, as well as facilitate use of tensor-valued diffusion encoding on systems with lower hardware performance11.Acknowledgements
We thank Siemens Healthcare for access to the pulse sequence programming environment. BJ is a postdoctoral fellow of the Research Foundation Flanders, Belgium (FWO: 12M3119N). FSz and CF acknowledge the following grants NIH P41EB015902, NIH R01MH074794, SSF Framework grant AM13-0090, VR 2016-04482.References
1. Westin C-F, Knutsson H, Pasternak O, Szczepankiewicz F, Özarslan E, van Westen D, Mattisson C, Bogren M, O’Donnell LJ, Kubicki M, Topgaard D, Nilsson M. Q-space trajectory imaging for multidimensional diffusion MRI of the human brain. Neuroimage. 2016;135: 345–362.
2. Topgaard D. Multidimensional diffusion MRI. J Magn Reson. 2017;275: 98–113.
3. Van Steenkiste G, Jeurissen B, Veraart J, den Dekker AJ, Parizel PM, Poot DHJ, Sijbers J. Super-resolution reconstruction of diffusion parameters from diffusion-weighted images with different slice orientations. Magn Reson Med. 2016;75: 181–195.
4. Sjölund J, Szczepankiewicz F, Nilsson M, Topgaard D, Westin C-F, Knutsson H. Constrained optimization of gradient waveforms for generalized diffusion encoding. J Magn Reson. 2015;261: 157–168.
5. Szczepankiewicz F, Nilsson M. Maxwell-compensated waveform design for asymmetric diffusion encoding. submitted to Proc Intl Soc Mag Reson Med 26. 2018.
6. Cheng J, Shen D, Yap P-T, Basser PJ. Single- and Multiple-Shell Uniform Sampling Schemes for Diffusion MRI Using Spherical Codes. IEEE Trans Med Imaging. 2017; doi:10.1109/TMI.2017.2756072
7. Veraart J, Fieremans E, Novikov DS. Diffusion MRI noise mapping using random matrix theory. Magn Reson Med. 2016;76: 1582–1593.
8. Tabesh A, Jensen JH, Ardekani BA, Helpern JA. Estimation of tensors and tensor-derived measures in diffusional kurtosis imaging. Magn Reson Med. 2011;65: 823–836.
9. Poot DHJ, Van Meir V, Sijbers J. General and efficient super-resolution method for multi-slice MRI. Med Image Comput Comput Assist Interv. 2010;13: 615–622.
10. Szczepankiewicz F, Lätt J, Wirestam R, Leemans A, Sundgren P, van Westen D, Ståhlberg F, Nilsson M. Variability in diffusion kurtosis imaging: impact on study design, statistical power and interpretation. Neuroimage. 2013;76: 145–154.
11. Szczepankiewicz F, Sjölund J, Ståhlberg F, Lätt J, Nilsson M. Whole-brain diffusional variance decomposition (DIVIDE): Demonstration of technical feasibility at clinical MRI systems [Internet]. arXiv [physics.med-ph]. 2016. Available: http://arxiv.org/abs/1612.06741
Figures