0553
Technical validation of b-tensor encoding shows the need for standardized acquisition protocols1Dept. of Translational Medicine, Division of Medical Radiation Physics, Lund University, Malmö, Sweden, 2Dept. of Clinical Sciences, Division of Radiology, Lund University, Lund, Sweden, 3Brigham and Women's Hospital, Boston, MA, United States, 4Harvard Medical School, Boston, MA, United States, 5Lund University, Lund, Sweden
Synopsis
Tensor-valued diffusion encoding can be used to separate effects of microscopic anisotropy, orientation dispersion, and isotropic kurtosis. The aim of this work was to determine the impact of encoding tensor shapes and sizes (b-values) on the estimated model parameters using in-vivo data and simulated signals from several microdiffusion environments. We found that some signal sampling protocol had a relevant impact on the estimated diffusion parameters and may negatively impact the parameter reproducibility. This demonstrates the need for a standardization of sampling schemes to facilitate study comparisons, data pooling, and meta analysis.
Introduction
Tensor-valued diffusion encoding can be used to separate effects of microscopic anisotropy, orientation dispersion, and isotropic kurtosis [1] with potential applications in both neurological disorders and tumour imaging [2]. Imaging protocols have included combinations of linear and spherical encoding tensors (e.g. magic angle spinning of the q-vector, qMAS) [3,4], linear and planar tensors (e.g. double diffusion encoding) [5,6], and combinations multiple shapes [7]. However, the impact of the imaging protocol on the estimated image parameters has not been systematically investigated. The aim of this work is to determine the impact of encoding tensor shapes and sizes (b-values) on the estimated model parameters.Methods
Tensor-valued diffusion encoding enables estimation of the mean diffusivity (MD) as well as the anisotropic kurtosis (MKA) and the isotropic kurtosis (MKI) via a signal representation [3,4,7]:
$$ S(b,b_\Delta) = \exp(-b \textrm{MD} + b^2\textrm{MD}^2\textrm{MK}_\textrm{I}/6+b_{\Delta}^2b^2\textrm{MD}^2\textrm{MK}_\textrm{A}/6)$$
These parameters can be estimated from data acquired with a full imaging protocol that comprises linear (L; bΔ = 1), spherical (S; bΔ = 0), and planar (P; bΔ = –1/2) encoding tensors at b-values (.1, .7, 1.4, 2.0 ms/µm2) using the diffusion encoding directions detailed in Fig 1. However, the parameters can also be estimated from subsets of the full protocol. We investigated five subsets of the full protocol: linear and spherical (LS), linear and planar (LP), planar and spherical (PS) and two protocols omitting the highest b-value for the spherical encoding (LPSlow b and LSlow b). The latter type of protocols improve SNR because they alleviate the bottleneck of employing spherical encoding at the maximal b-value.
Imaging
A single healthy subject was scanned at 3 T (80 mT/m) with a prototype spin-echo sequence that enables b-tensor diffusion encoding using TR=3.2 s, TE=91 ms, FOV=220x220x60 mm3, resolution 2.4 mm isotropic, partial-Fourier=7/8, iPAT=2 using the full protocol. Gradient waveforms for tensor encoding were asymmetric and numerically optimized [8] and compensated for concomitant fields [9]. Total scan time was 22:25 min.
Analysis
All data was corrected for motion and eddy-currents using extrapolated reference images [10], and for Gibbs ringing using subvoxel-shifts [11]. Parameter maps were calculated using the full dataset (LPS) and the five subsets (LS, LP, PS, LPSlow b, LSlow b).
Simulations
Signals from three diffusion microenvironments were simulated to model signals from the brain. The parameters were estimated from a noise-free signal and from 500 realizations of rician noise at SNR = 30 at b = 0, to investigate the accuracy and precision of the estimated parameters.
Results
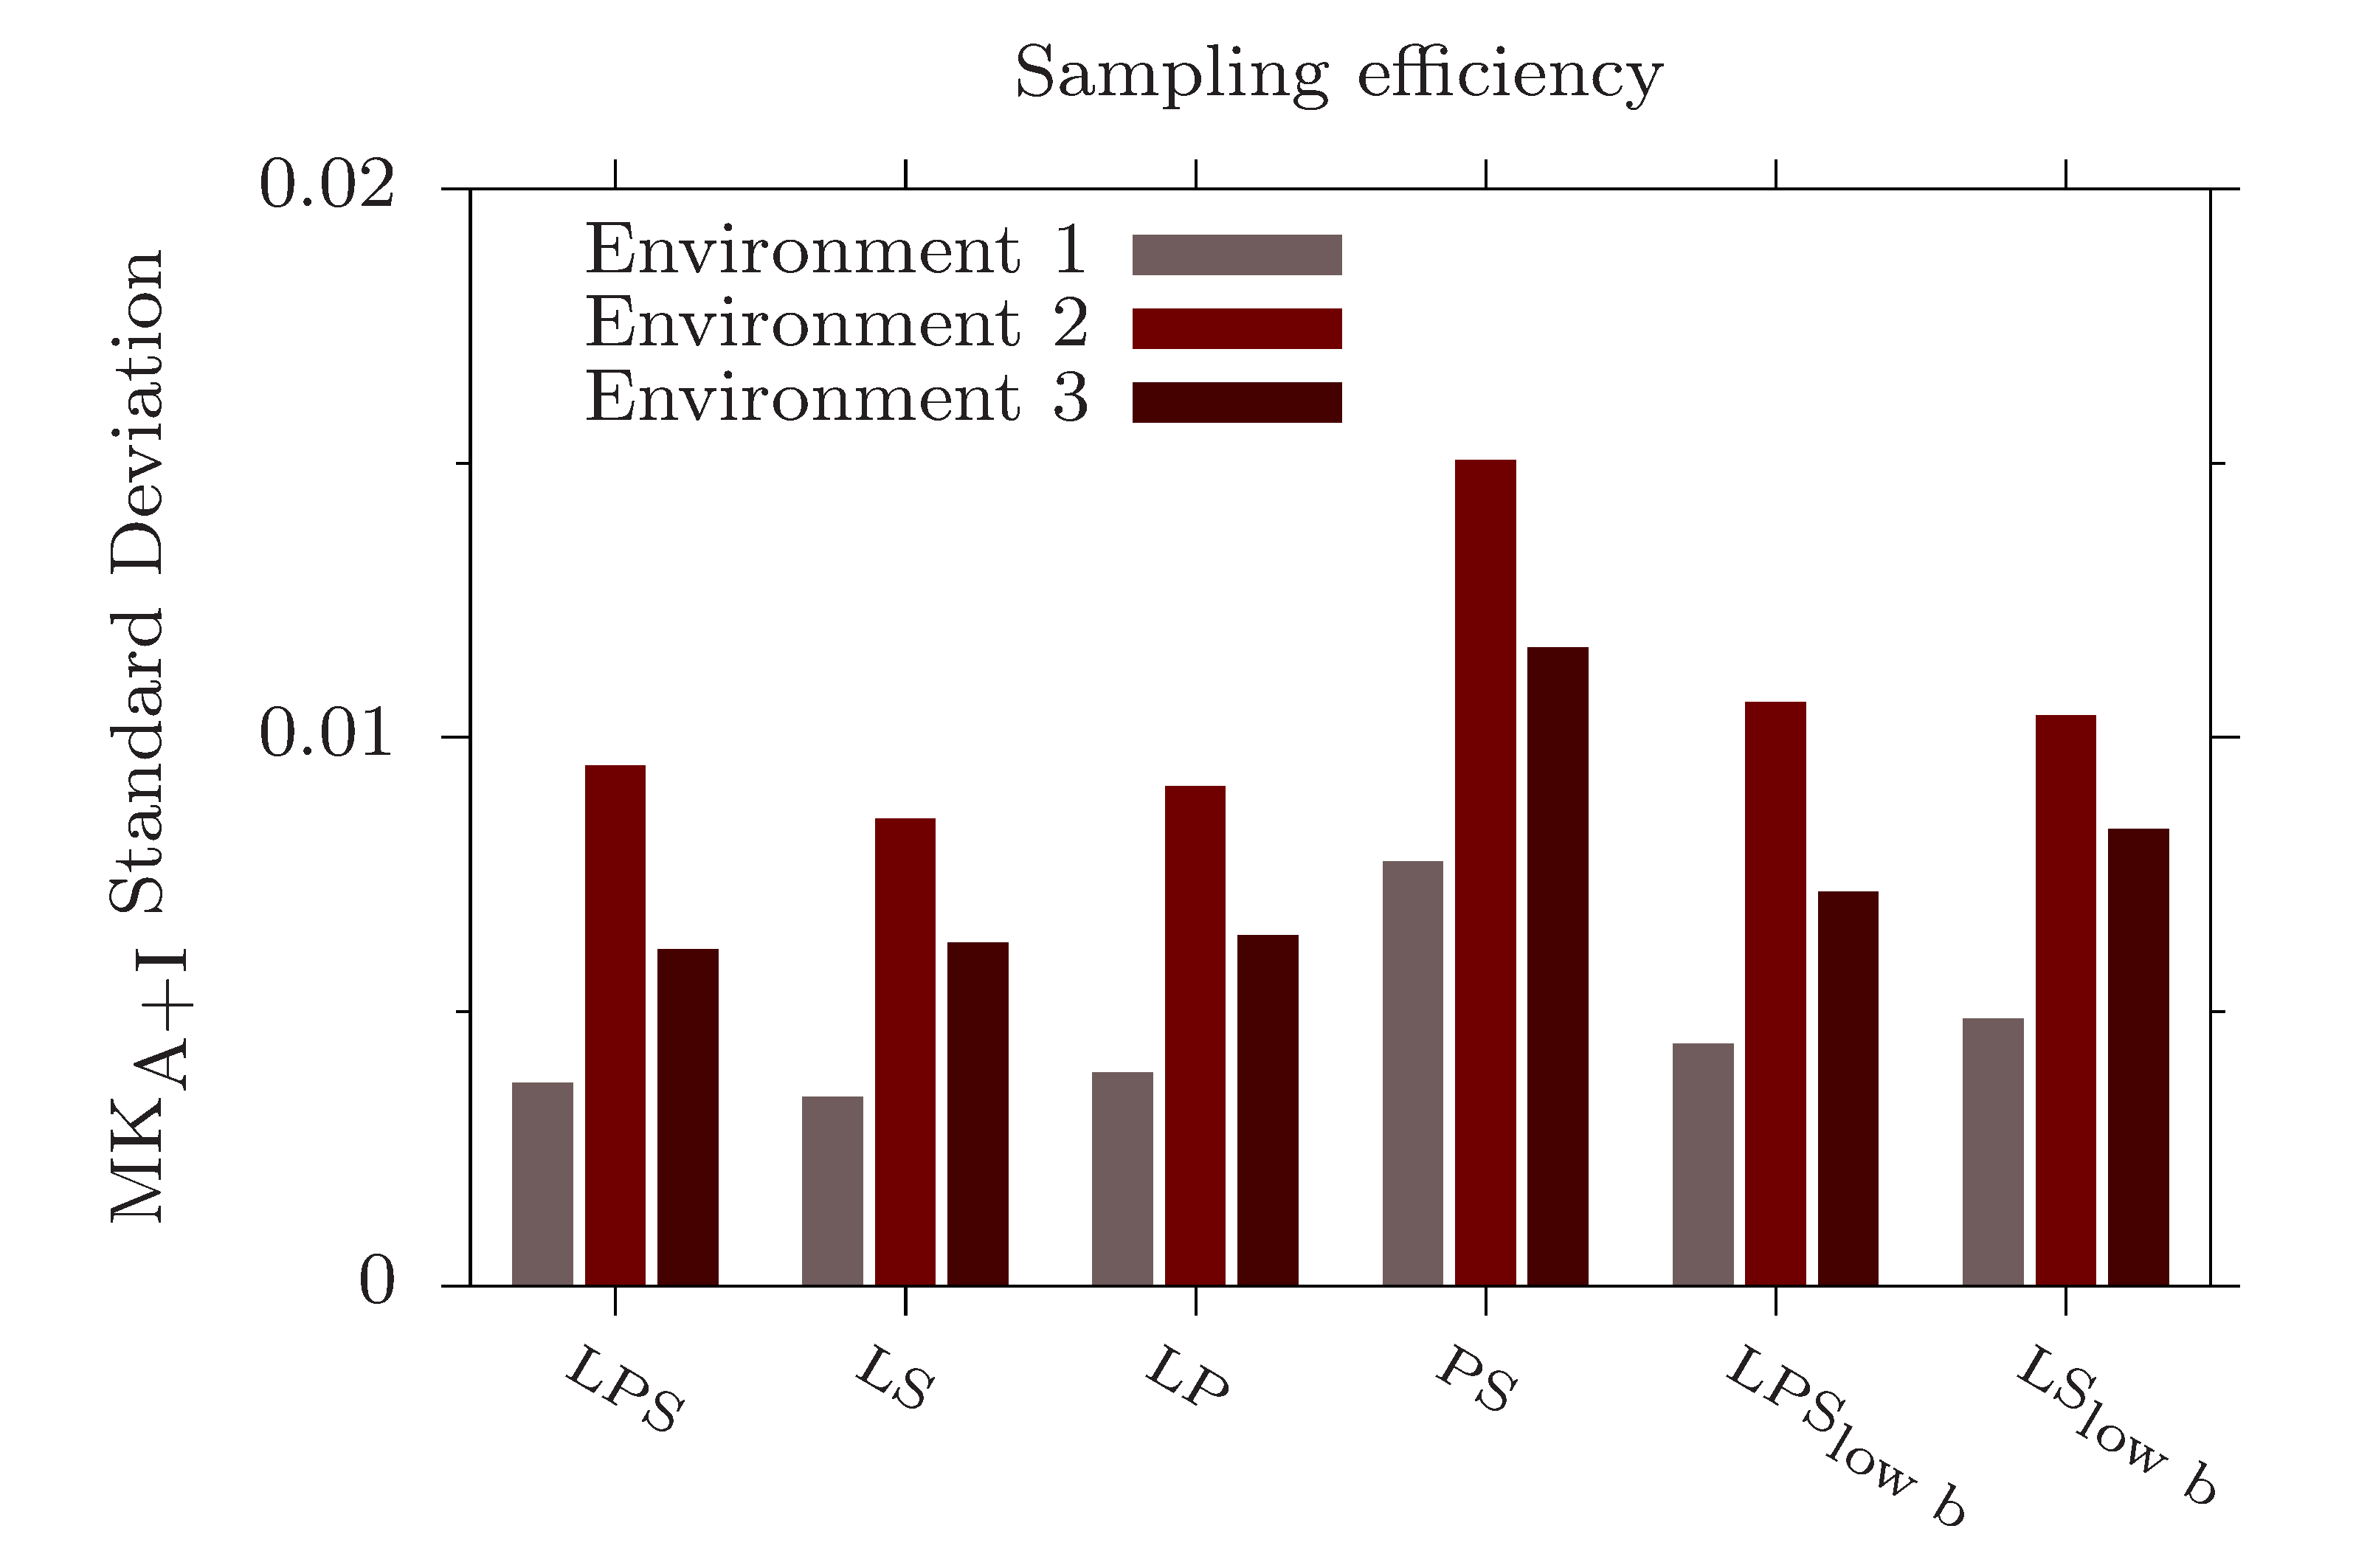
Figure 2 shows the the parameter difference to LPS of each subset, and the distribution of corresponding parameter values in white matter. All signal subsets show a bias in the white matter tissue compared to the LPS, and the variance of the difference changes for different subsets and parameters (Table 1). Figure 3 shows parameter values calculated from three synthetic environments, represented in column 1. The boxplots show distributions of MD, MKA, MKI, fractional anisotropy (FA) and microscopic fractional anisotropy (μFA) calculated from noisy signals. The parameter results are similar between most subsets, but LSlow b shows lower accuracy and PS shows lower precision and accuracy for MKA, MKI, FA and μFA. Figure 4 shows the total standard deviation of MKA and MKI scaled with the number of samples in each subset to yield the efficiency per unit of scan time. PS is the least efficient sampling scheme for MKA and MKI standard deviations.Discussion and conclusions
We demonstrate, from simulations and in-vivo data, that changing the signal sampling protocol can have an impact on the estimated parameters. This is expected for any signal representation based on approximations of a more complex model. We also show that the bias due to noise varies between environments with different diffusion properties. If a full sampling scheme is not possible, the PS and LSlow b sampling scheme should be avoided. We conclude that the parameters depend on the signal sampling scheme, which means that differences in acquisition protocols may negatively impact the parameter reproducibility. This demonstrates the need for a standardization of sampling schemes to facilitate study comparisons, data pooling, and meta analysis; this will be addressed in a future work. Acknowledgements
We thank Siemens Healthcare for access to the pulse sequence programming environment. FSz and CF acknowledge the following grants NIH P41EB015902, NIH R01MH074794, SSF Framework grant AM13-0090, VR 2016-04482.References
[1] CORY, D. G., GARROWAY, A. N. & MILLER, J. B. 1990. Applications of Spin Transport as a Probe of Local Geometry. Abstracts of Papers of the American Chemical Society, 199, 105.
[2] Szczepankiewicz F, van Westen D, Englund E, et al. The link between diffusion MRI and tumor heterogeneity: Mapping cell eccentricity and density by diffusional variance decomposition (DIVIDE). Neuroimage. 2016;142:522-532.
[3] LASIČ, S., SZCZEPANKIEWICZ, F., ERIKSSON, S., NILSSON, M. & TOPGAARD, D. 2014. Microanisotropy imaging: quantification of microscopic diffusion anisotropy and orientational order parameter by diffusion MRI with magic-angle spinning of the q-vector. Frontiers in Physics, 2, 11.
[4] SZCZEPANKIEWICZ, F., VAN WESTEN, D., ENGLUND, E., WESTIN, C. F., STAHLBERG, F., LATT, J., SUNDGREN, P. C. & NILSSON, M. 2016. The link between diffusion MRI and tumor heterogeneity: Mapping cell eccentricity and density by diffusional variance decomposition (DIVIDE). Neuroimage, 142, 522-532.
[5] LAWRENZ, M. & FINSTERBUSCH, J. 2011. Detection of microscopic diffusion anisotropy on a whole-body MR system with double wave vector imaging. Magn Reson Med, 66, 1405-15.
[6] YANG, G., TIAN, Q., LEUZE, C., WINTERMARK, M. & MCNAB, J. A. 2017. Double diffusion encoding MRI for the clinic. Magn Reson Med.
[7] WESTIN, C. F., KNUTSSON, H., PASTERNAK, O., SZCZEPANKIEWICZ, F., ÖZARSLAN, E., VAN WESTEN, D., MATTISSON, C., BOGREN, M., O'DONNELL, L. J., KUBICKI, M., TOPGAARD, D. & NILSSON, M. 2016. Q-space trajectory imaging for multidimensional diffusion MRI of the human brain. Neuroimage, 135, 345-62.
[8] SJÖLUND, J., SZCZEPANKIEWICZ, F., NILSSON, M., TOPGAARD, D., WESTIN, C. F. & KNUTSSON, H. 2015. Constrained optimization of gradient waveforms for generalized diffusion encoding. J Magn Reson, 261, 157-168.
[9] SZCZEPANKIEWICZ, F. & NILSSON, M. Maxwell-compensated waveform design for asymmetric diffusion encoding. ISMRM, 2018 Paris, France.
[10] Nilsson, M., Szczepankiewicz, F., Van Westen, D., & Hansson, O. (2015). Extrapolation-based references improve motion and eddy-current correction of high B-value DWI data: Application in Parkinson’s disease dementia. PLoS ONE, 10(11), 1–22.
[11] Kellner, E. , Dhital, B. , Kiselev, V. G. and Reisert, M. (2016),
Gibbs‐ringing artifact removal based on local subvoxel‐shifts. Magn.
Reson. Med., 76: 1574-1581.
Figures