0549
Quantitative Magnetization Transfer Detects Renal Fibrosis in Swine Kidney with Renal Artery Stenosis1Division of Nephrology and Hypertension, Mayo Clinic, Rochester, MN, United States
Synopsis
Quantitative magnetization transfer (qMT) was used on swine kidneys with renal artery stenosis (RAS). The reproducibility of qMT at 1.5 and 3.0 T was tested in two RAS pigs and its utility in measuring renal fibrosis investigated in seven pigs at 3.0 T by comparing to histology. The Henkelman-Ramani equation was used to derive the bound pool fraction f. Comparable f values were obtained at 1.5 and 3.0 T. Measured f also correlated well with renal fibrosis by histology. In conclusion, qMT is reproducible at different field strengths and can be used to measure renal fibrosis in swine with RAS.
Introduction
Quantitative magnetization transfer (qMT) is an emerging MR technique for measurement of renal fibrosis. One recent study showed that the qMT could detect cortical fibrosis in murine kidneys with diabetic nephropathy.1 However, its utility in measuring renal fibrosis in human-like kidneys and its reproducibility at different clinical field strengths have not been tested. In this study, we investigated these two aims in swine kidneys with unilateral renal artery stenosis (RAS).Methods
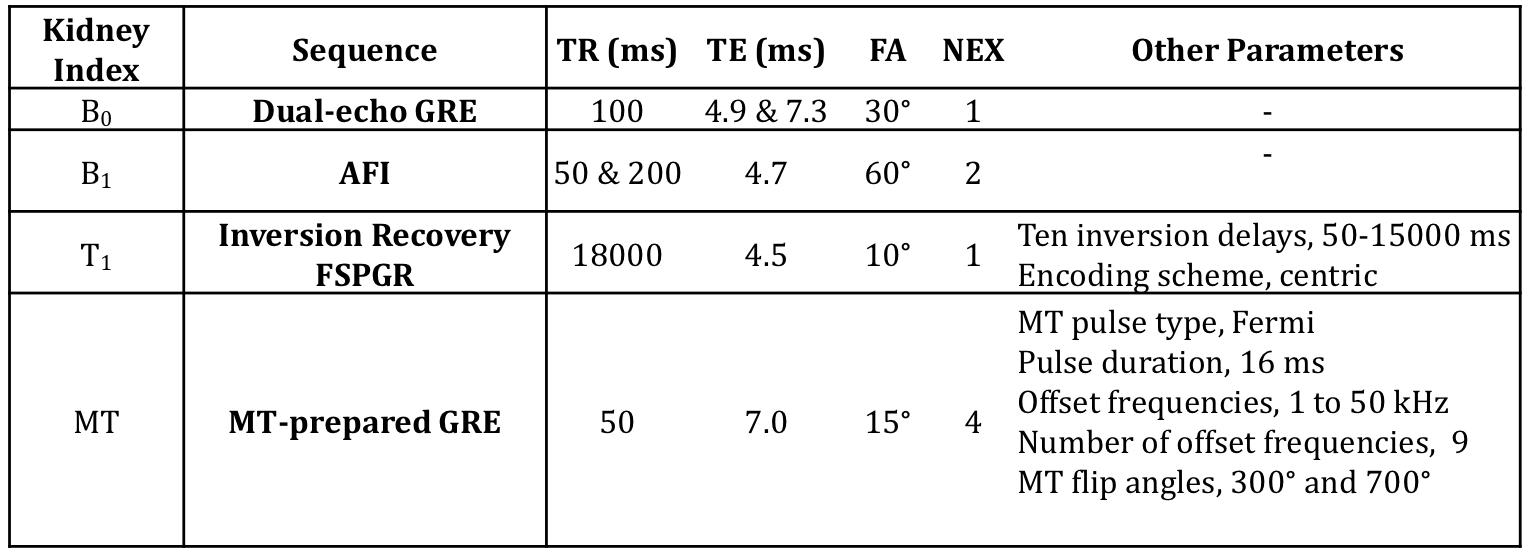
MRI. MRI studies were performed on GE Signa HDxt 1.5 and 3.0 T scanners (GE Healthcare, Waukeshau, WI). The reproducibility of qMT at 1.5 and 3.0 T was tested in two pigs with RAS and its utility in measuring renal fibrosis investigated in seven RAS pigs at 3.0 T. RAS was induced by implanting a balloon-expandable local irritant coil in the right renal artery. At 16 weeks of RAS, all pigs underwent endotracheal intubation for mechanical ventilation and qMT imaging comprised of MT scans and B0, B1, and T1 mapping. MT-weighted images were acquired using a gradient echo sequence with various MT offset frequencies and flip angles. B0 and B1 mapping were performed using the dual-echo gradient echo4 and actual flip angle imaging5 methods, respectively. Kidney T1 maps were acquired using an inversion recovery fast spoiled gradient recalled acquisition in steady state sequence. For each pig, one coronal 5-mm-thick slice was imaged with a FOV of 26×26 cm2 and matrix size of 256×128. Other imaging parameters are shown in Fig. 1. All MRI scans were performed with suspended respiration.
Image Analysis. The B0 maps were calculated from the phase difference between the two gradient echo images2 and used to achieve the actual offset frequencies of the MT pulses. For B1 mapping, the actual flip angle was calculated3 and normalized by the nominal flip angle. Then the B1 maps were used to calculate the actual MT saturation power. Pixel-wise mono-exponential fitting was used to generate the T1 maps. The bound pool fraction f maps were generated by pixel-wise fitting of the MT images using the Henkelman-Ramani equation.4 Cortical and medullary regions of interest were manually traced on the MT images with the best corticomedullary contrast. In the reproducibility study, measured f from the cortex and medulla of stenotic and contralateral kidneys of the two pigs were used for comparison, resulting in a sample size of eight. In the qMT utility study, the cortical and medullary f of the seven stenotic kidneys was compared to the renal fibrosis by histology.
Histology. After MRI, all pigs were euthanized and the kidneys harvested for histology. Masson’s trichrome staining was performed on 5-µm kidney tissue sections, from which renal fibrosis was measured as the fraction of fibrotic area.
Results
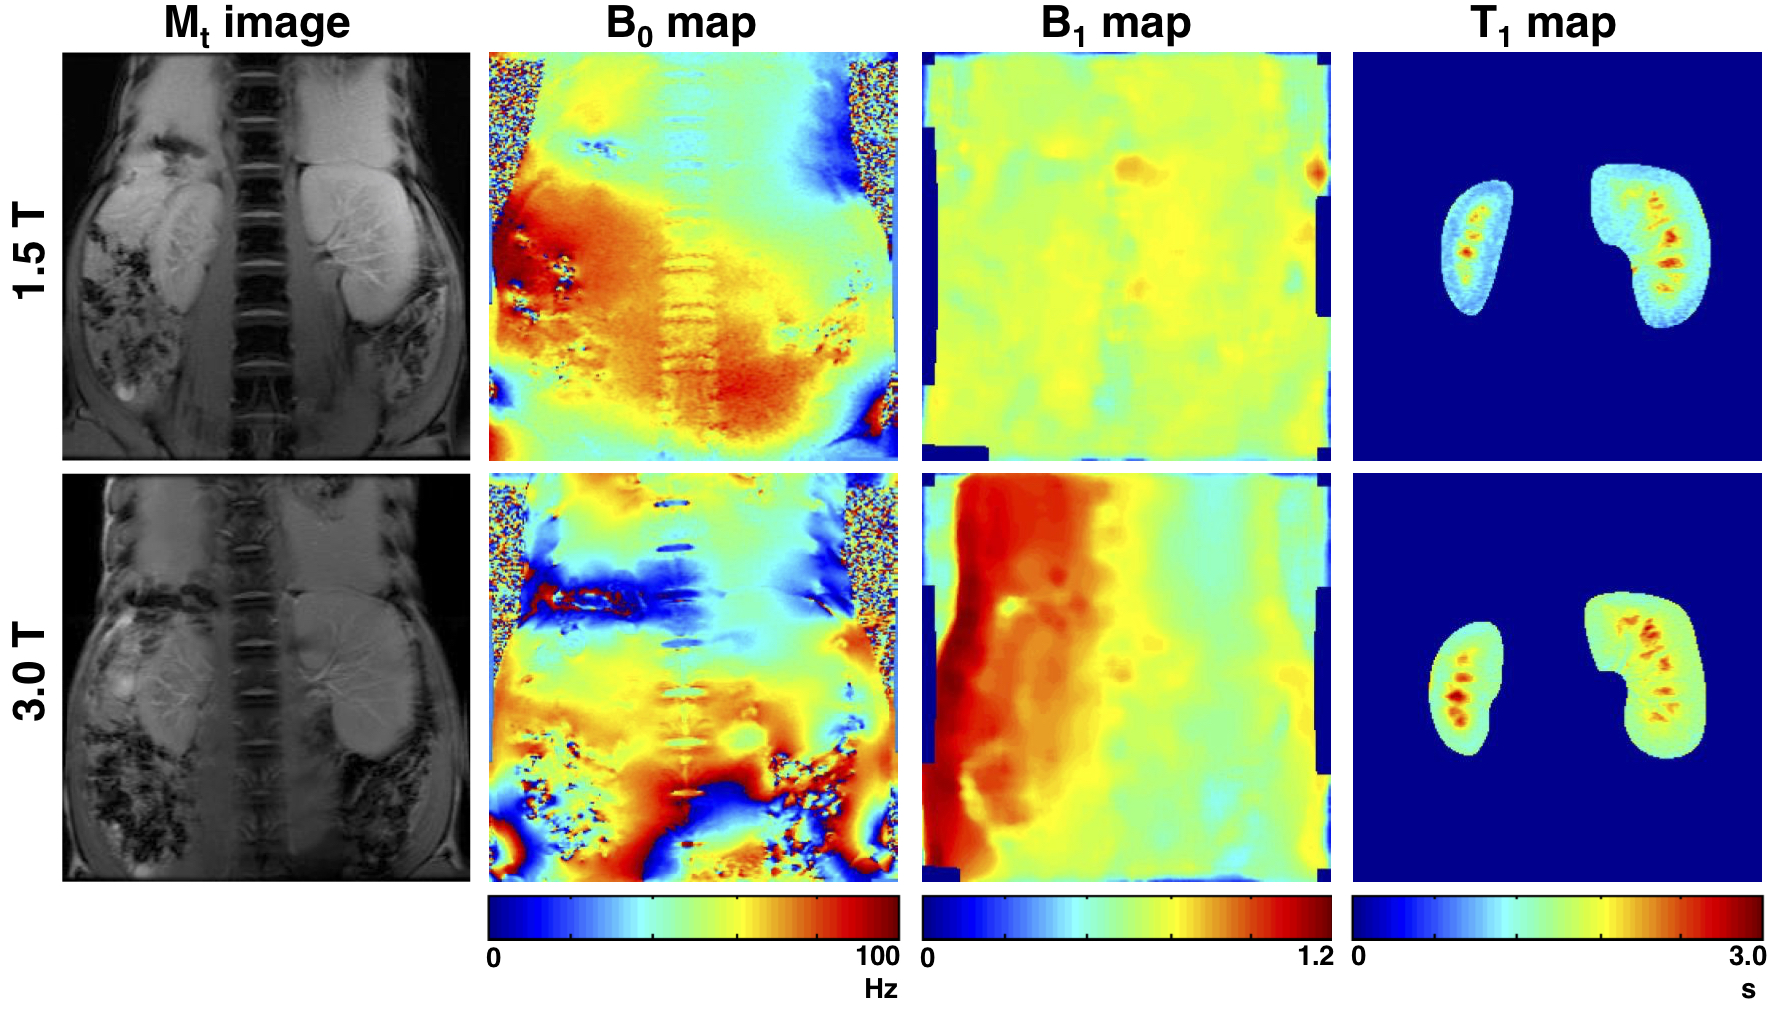
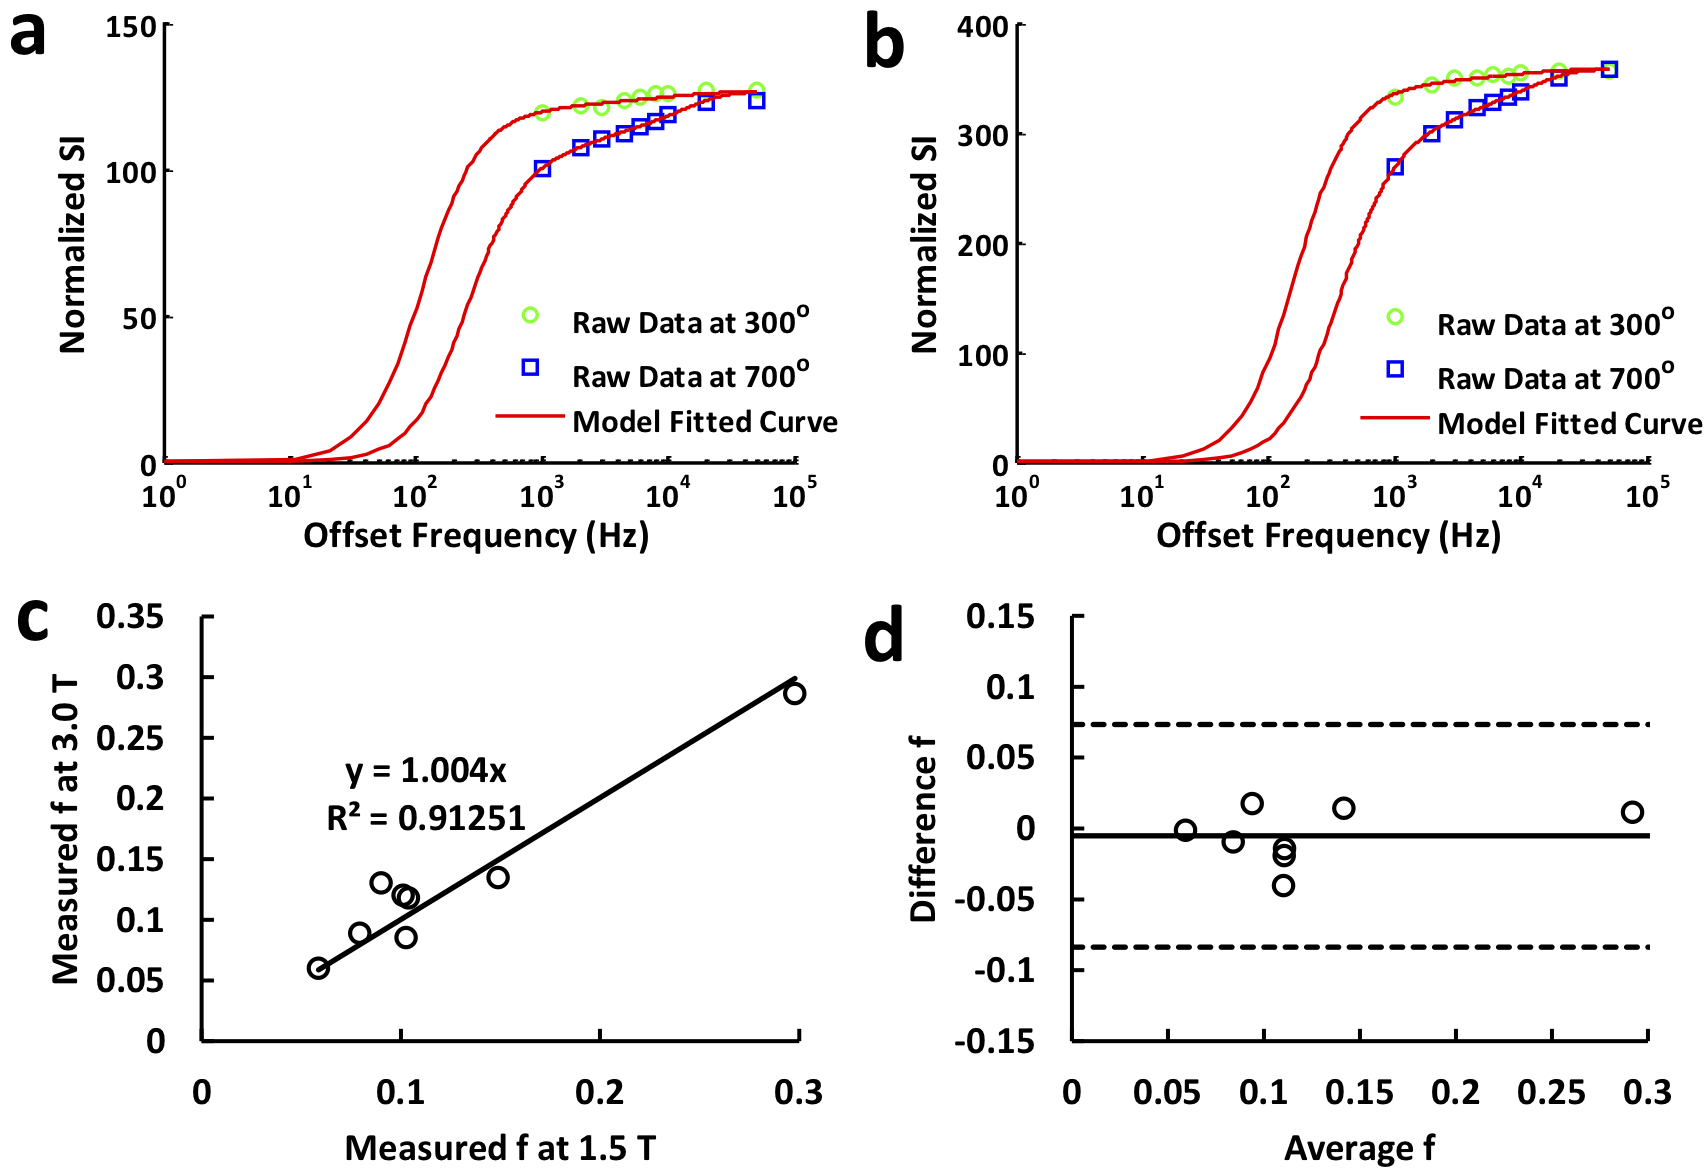
Shown in Fig. 2 are the representative MT-weighted (Mt) images acquired with the MT offset frequency at 1000 Hz and flip angle at 700°, as well as the corresponding B0, B1, and T1 maps of the same slice at 1.5 and 3.0 T. Representative qMT fittings of experimentally-acquired MT data acquired at 1.5 and 3.0 T are shown in Fig. 3a and b, respectively. The derived bound pool fraction f values at 1.5 and 3.0 T showed good consistency, as indicated by the correlation (Fig. 3c) and Bland-Altman (Fig. 3d) analysis.
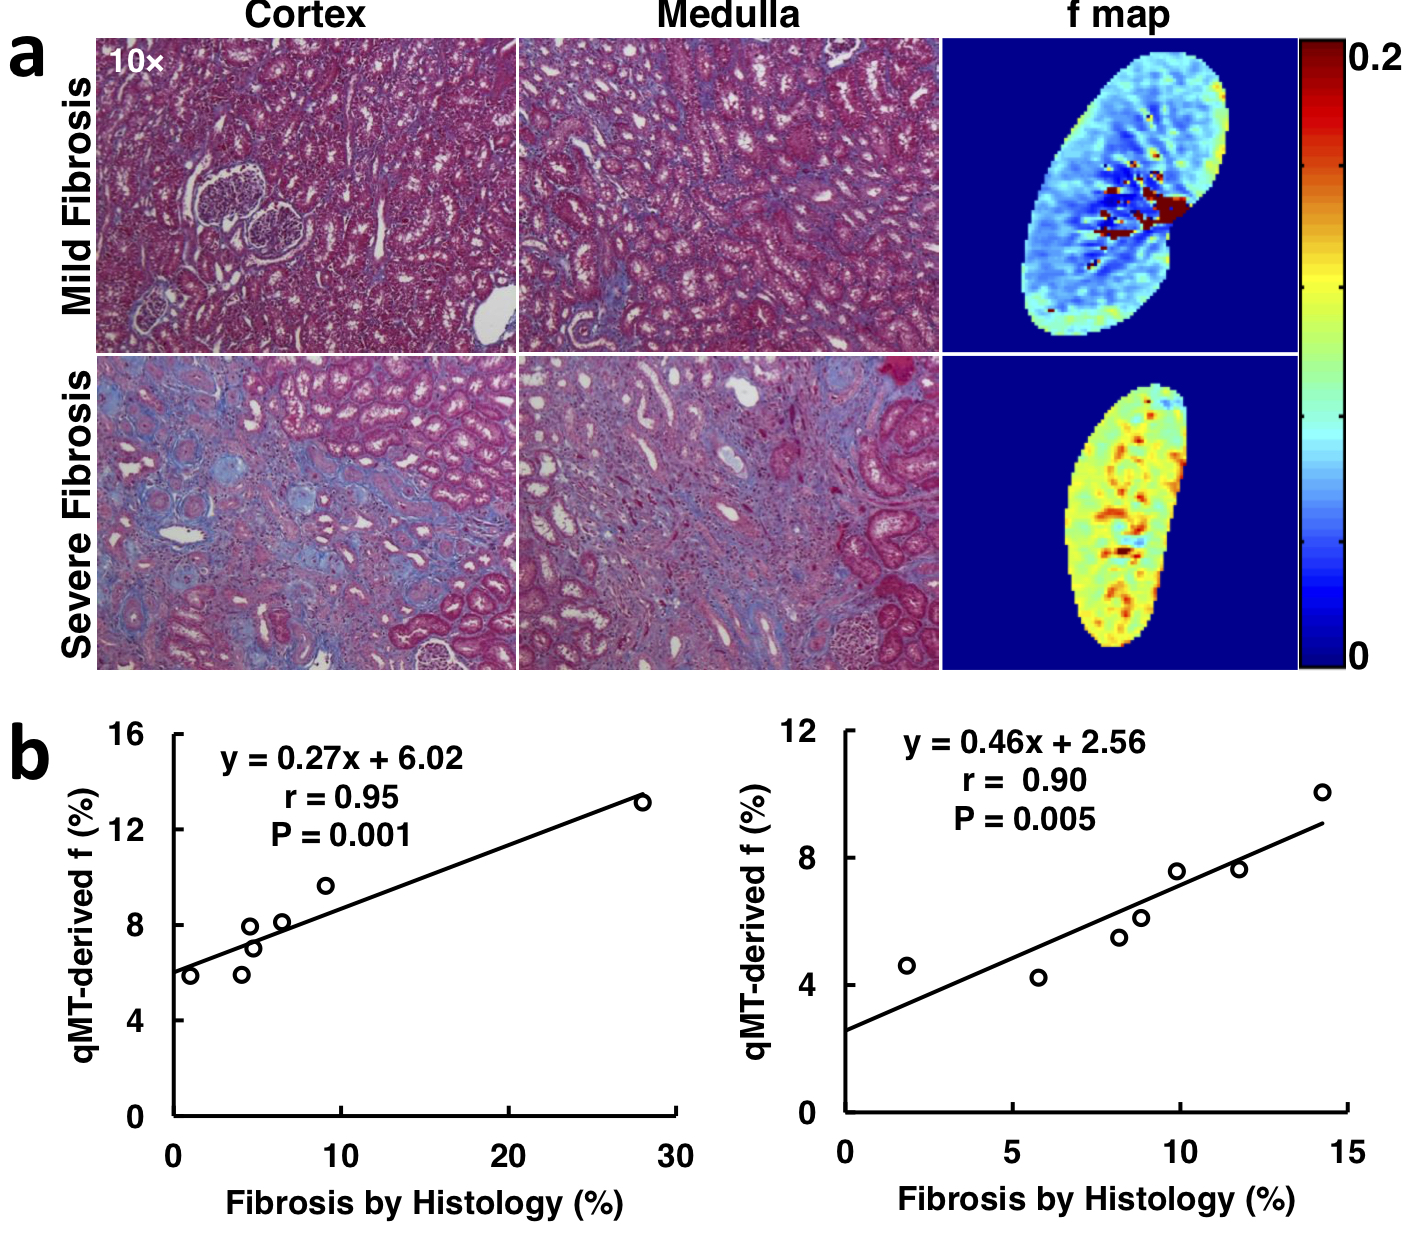
Shown in Fig. 4a are the representative trichrome–stained cortical (left) and medullary (middle) tissues as well as the f maps (right) of pig kidneys with mild (upper) and severe (lower) fibrosis. The renal fibrosis by histology showed a good correlation with qMT-derived f in both renal cortex (Fig. 4b left) and medulla (Fig. 4b right).
Discussion
The magnetization transfer ratio (MTR) by conventional magnetization transfer imaging has recently been shown to be a useful biomarker for renal fibrosis.5,6 Nevertheless, MTR measurement is inherently semi-quantitative and susceptible to sequence parameters, scanner hardware, and tissue properties, rendering its poor reproducibility at different field strengths and across sites.7 In contrast, qMT provides a direct measurement of the bound pool fraction by accounting for these physical and biological factors and is believed to be more reproducible. Our study, for the first time, demonstrated the good reproducibility of qMT at different magnetic field strengths in swine kidneys. Furthermore, we showed that the qMT-derived bound pool fraction correlated well with histology-measured renal fibrosis in both renal cortex and medulla, suggesting that qMT may provide a useful biomarker for assessment of swine renal fibrosis.Conclusion
Quantitative magnetization transfer is reproducible at 1.5 and 3.0 T on swine kidneys and may provide a good biomarker for noninvasive measurement of renal fibrosis.Acknowledgements
NAReferences
1. Wang F, Katagiri D, Li K, et al. Assessment of renal fibrosis in murine diabetic nephropathy using quantitative magnetization transfer MRI. Magn Reson Med. 2018.
2. Skinner TE, Glover GH. An extended two-point Dixon algorithm for calculating separate water, fat, and B0 images. Magn Reson Med. 1997;37(4):628-630.
3. Yarnykh VL. Actual flip-angle imaging in the pulsed steady state: a method for rapid three-dimensional mapping of the transmitted radiofrequency field. Magn Reson Med. 2007;57(1):192-200.
4. Ramani A, Dalton C, Miller DH, Tofts PS, Barker GJ. Precise estimate of fundamental in-vivo MT parameters in human brain in clinically feasible times. Magn Reson Imaging. 2002;20(10):721-731.
5. Jiang K, Ferguson CM, Ebrahimi B, et al. Noninvasive Assessment of Renal Fibrosis with Magnetization Transfer MR Imaging: Validation and Evaluation in Murine Renal Artery Stenosis. Radiology. 2017;283(1):77-86.
6. Jiang K, Ferguson CM, Woollard JR, Zhu X, Lerman LO. Magnetization Transfer Magnetic Resonance Imaging Noninvasively Detects Renal Fibrosis in Swine Atherosclerotic Renal Artery Stenosis at 3.0 T. Invest Radiol. 2017;52(11):686-692.
7. Sinclair CD, Samson RS, Thomas DL, et al. Quantitative magnetization transfer in in vivo healthy human skeletal muscle at 3 T. Magn Reson Med. 2010;64(6):1739-1748.
Figures