0546
In vivo MRI of mouse liver glycogen based on the nuclear Overhauser enhancement (NOE) with water (glycoNOE)1The Russell H. Morgan Department of Radiology, The Johns Hopkins University School of Medicine, Baltimore, MD, United States, 2F.M. Kirby Research Center for Functional, Brain Imaging Kennedy Krieger Institute, Baltimore, MD, United States
Synopsis
Glycogen is abundant in different tissues and plays a central role in glucose homeostasis. We propose a new method for imaging glycogen using the nuclear Overhauser enhancement (NOE) between glycogen and water. We mapped the glycogen NOE signal in the Z-spectral range around -1 ppm from water, both in phantoms and in mouse liver in vivo. For validation, we performed a fasting protocol and glucagon infusions. Glycogen levels were greatly reduced after 24 hours fasting and after the intraperitoneal injection of glucagon (100 ml, 1mg/ml). This glycoNOE MRI has the potential for non-invasive imaging of liver glycogen levels in vivo.
Introduction
Glycogen, a branched polymeric form of glucose, is an important endogenous marker for a variety of diseases such as cancer1,2, diabetes3,4, glycogen storage diseases5,6 and liver diseases. The glycoCEST (chemical exchange saturation transfer imaging of glycogen) method7 was previously proposed as a promising proton detection method for glycogen. However, results from subsequent studies suggested the glycoCEST method did not work well in vivo.8,9 Here, we demonstrate a new way of imaging glycogen based on the glycogen proton NOE with water. For the first time, we show that the “glycoNOE” signal can be used as a practical indicator to map relative glycogen levels in vivo.
Materials and Methods
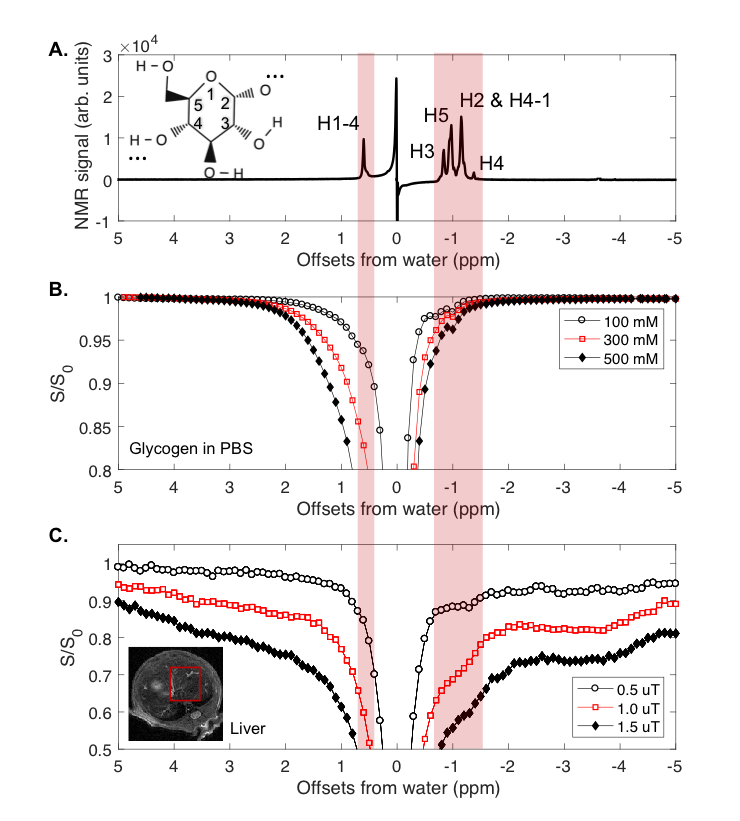
1. Phantom: Bovine liver glycogen was dissolved in PBS (37°C, pH 7.4), scanned in a 17.6 T Bruker Avance III. Z-spectra were collected using a 4 s CW pre-saturation pulse at B1 amplitude of 0.37 µT (16 Hz).
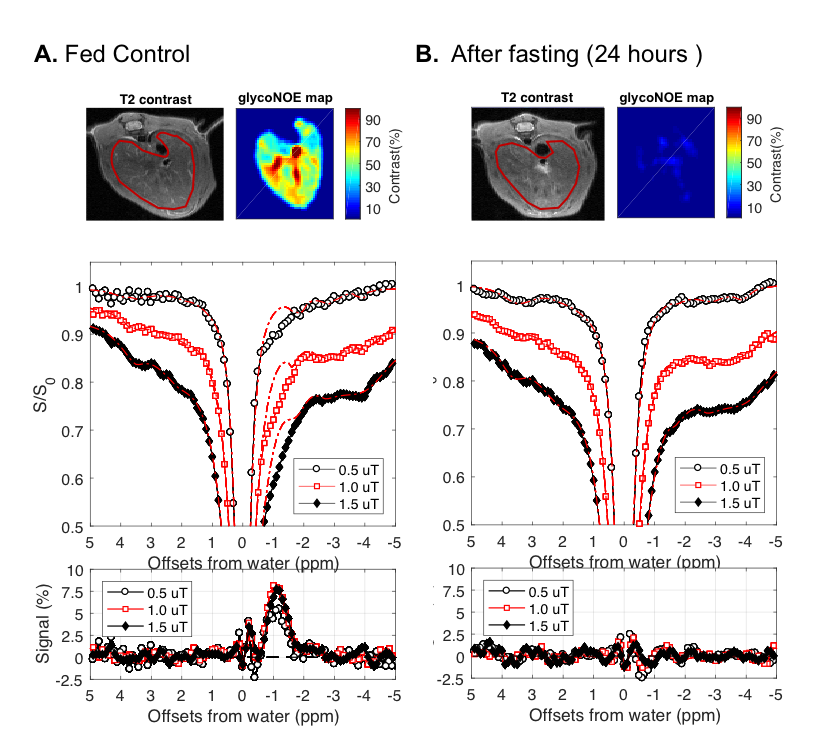
2. CEST on the liver of fed and fasted mice: 5 healthy fed adult mice were scanned before fasting and after 24~28h of fasting on an 11.7 T Bruker Biospec preclinical scanner. A radial-sampling steady-state CEST (rs-SSCEST) that is based on ultra-short echo time (UTE) sequence was used with 2 mm thickness. In each repetition time (TR, 30 ms), a 20 ms Gaussian saturation pulses with a power of 0.5, 1.0 or 1.5 µT, was used followed by a UTE readout. The effective echo time (TE) was 0.38 ms. The inter-pulse delay mixing time was 10 ms, the excitation pulse for the UTE readout was a 0.3 ms Gaussian pulse.
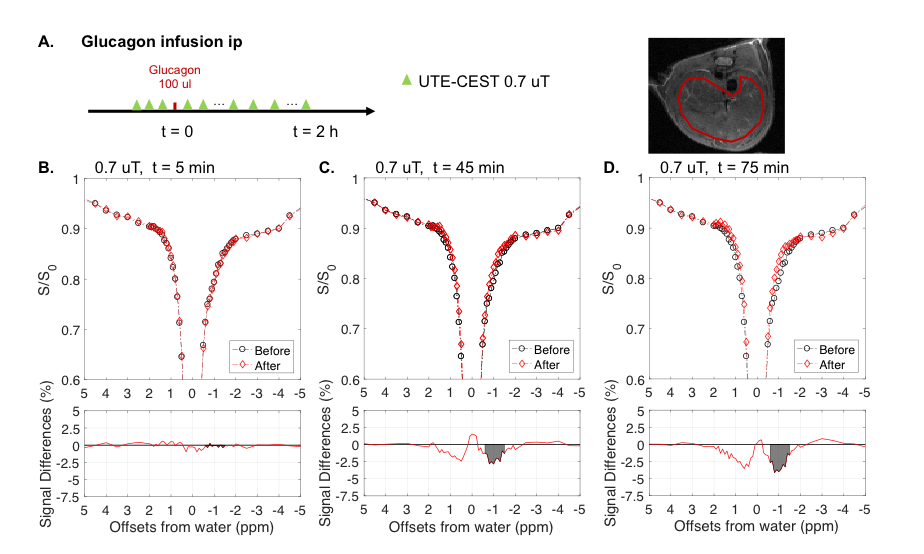
3. Intraperitoneal injection of glucagon: 5 healthy fed adult mice were scanned with MRI. Prior to the glucagon infusion (100 ul, 1mg/ml), three Z-spectra with B1 power of 0.7 µT were acquired for reference. Immediately after the injection, repetitive rs-SSCEST scans with a B1 of 0.7 µT were conducted for 120 mins. Each Z-spectrum scan took 10 mins.
4. Data analysis: To corrected Z-spectra caused by static field (B0) inhomogeneity, shifting Z-spectra was completed pixel by pixel according to the WASSR method.10 The Z-spectra were fitted by multiple-Lorentzian shapes11. 8 Lorentzian peaks centered at “0 ppm water peak”, “+3.5 ppm Amide”, “+2.0 ppm Amine”, “+0.5 ppm glycogen H1-4 NOE”, “-1.0 ppm glycoNOE”, “-1.8 ppm NOE”, “-2.9 ppm NOE” and “-3.8 ppm NOE”, plus a constant magnetization transfer background were set as the inputs in the fitting.
Results
The NOE peaks from -0.7 to -1.1 ppm in the glycogen phantom Z-spectra were attributed to glycogen protons H3, H5, and H2+H4-1 (Figure 1A, B) based on previously published aliphatic spectra12. There also was a broad saturation transfer peak between +0.3 to +1.5 ppm, a characteristic of intermediate to fast exchanging hydroxyl protons coalescing with the water signal.7
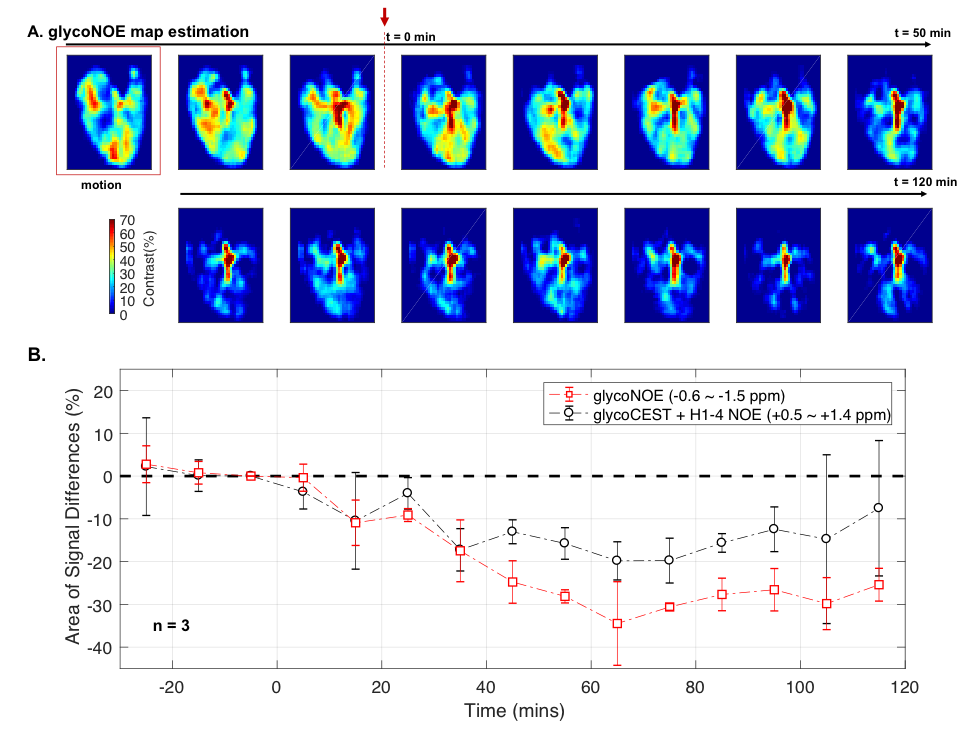
Based on Lorentzian fitting, the area (sum of 10 points) of glycoNOE peak (from -0.6 to -1.5 ppm) was used as a relative measurement of the glycoNOE levels. The data in Figure 2 show that the glycoNOE signal contribution for the whole liver in this mouse reached about 55%, while the signal reached as high as 100% locally (Figure 2A). After 24~28 hours of fasting, the liver glycoNOE signal decreased from 49.6 +/-13.4% to 8.1 +/- 10.0% on average (n = 5, B1 = 1.0 µT).
Figure 3 shows changes in Z-spectra as a function of time after injection of glucagon, a hormone that induces the rapid breakdown of liver glycogen. There were signal decreases for both the glycoNOE (centered around -1 ppm) and “glycoCEST” (around +0.6 ppm, glycoCEST + H1-4 NOE) ranges.
We also used the area (sum of 10 points) of signal differences as a relative measurement for signal changes at the glycoNOE and “glycoCEST” positions (Figure 4).
Discussion
In the phantom experiments, we showed that glycogen produced NOE signal at about -1 ppm. For in vivo experiments of fasted mice and glucagon injected mice, there was a large decrease in the glycoNOE signal as liver glycogen levels were greatly reduced. Therefore, we believe that the “-1 ppm” peak in the Z-spectrum for liver was mainly from glycogen. The results in the current study suggest that the distribution of glycogen in mouse liver is heterogeneous. In addition, it can be seen that asymmetry analysis should not be used to assess glycogen changes as the NOE and CEST signals compensate each other.
Conclusion
We demonstrate a new method for mapping glycogen based on glycoNOE signal. As glycogen levels are high in tissues like liver, heart, skeletal muscle, brain, and even tumor tissues, this glycogen quantification method has the potential to be applied in clinical diagnosis of a variety of diseases.
Acknowledgements
No acknowledgement found.References
References
1. Favaro, E. et al. Glucose utilization via glycogen phosphorylase sustains proliferation and prevents premature senescence in cancer cells. Cell Metab. (2012). doi:10.1016/j.cmet.2012.10.017
2. Rousset, M., Fogh, J. & Zweibaum, A. Presence of glycogen and growth–related variations in 58 cultured huma tumor cell lines of various tissue origins. Cancer Res. (1981).
3. Magnusson, I., Rothman, D. L., Katz, L. D., Shulman, R. G. & Shulman, G. I. Increased rate of gluconeogenesis in type II diabetes mellitus. A 13C nuclear magnetic resonance study. J. Clin. Invest. (1992). doi:10.1172/JCI115997
4. Krssak, M. et al. Alterations in Postprandial Hepatic Glycogen Metabolism in Type 2 Diabetes. Diabetes (2004). doi:10.2337/diabetes.53.12.3048
5. Adeva-Andany, M. M., González-Lucán, M., Donapetry-García, C., Fernández-Fernández, C. & Ameneiros-Rodríguez, E. Glycogen metabolism in humans. BBA Clinical (2016). doi:10.1016/j.bbacli.2016.02.001
6. Hicks, J., Wartchow, E. & Mierau, G. Glycogen storage diseases: A brief review and update on clinical features, genetic abnormalities, pathologic features, and treatment. Ultrastruct. Pathol. (2011). doi:10.3109/01913123.2011.601404
7. van Zijl, P. C., Jones, C. K., Ren, J., Malloy, C. R. & Sherry, A. D. MRI detection of glycogen in vivo by using chemical exchange saturation transfer imaging (glycoCEST). Proc Natl Acad Sci U S A (2007). doi:10.1073/pnas.0700281104
8. Koji Sagiyama; Shanrong Zhang; Ivan Dimitrov; A. Dean Sherry; and Masaya Takahashi. In Vivo Monitoring of Liver Glycogen by Chemical Exchange Saturation Transfer Imaging (GlycoCEST) in Live Mice. in Proc. Intl. Soc. Mag. Reson. Med. 22 (2014) (2014).
9. Deng, M. et al. Chemical Exchange Saturation Transfer (CEST) MR Technique for Liver Imaging at 3.0 Tesla: an Evaluation of Different Offset Number and an After-Meal and Over-Night-Fast Comparison. Mol. Imaging Biol. (2016). doi:10.1007/s11307-015-0887-8
10. Kim, M., Gillen, J., Landman, B. A., Zhou, J. & Van Zijl, P. C. M. Water saturation shift referencing (WASSR) for chemical exchange saturation transfer (CEST) experiments. Magn. Reson. Med. (2009). doi:10.1002/mrm.21873
11. Zhang, X. Y. et al. A new NOE-mediated MT signal at around -1.6 ppm for detecting ischemic stroke in rat brain. Magn. Reson. Imaging (2016). doi:10.1016/j.mri.2016.05.002
12. Zang, L. H., Howseman, A. M. & Shulman, R. G. Assignment of the 1H chemical shifts of glycogen. Carbohydr. Res. (1991). doi:10.1016/0008-6215(91)80001-4
13. Chen, W., Zhu, X. H., Shulman, R. G. & Avison, M. J. Nuclear Magnetic Resonance Relaxation of Glycogen H1 in Solution. Biochemistry (1993). doi:10.1021/bi00087a021
Figures