0543
Hemodynamic imaging in brain tumors using dextran1-enhanced CEST MRI1Department of Biomedical Engineering, Johns Hopkins University, Baltimore, MD, United States, 2Department of Radiology, Johns Hopkins University, Baltimore, MD, United States, 3F.M. Kirby Research Center for Functional Brain Imaging, Kennedy Krieger Institute, Baltimore, MD, United States, 4Department of Oncology, Johns Hopkins University, Baltimore, MD, United States, 5Department of Medical Radiation Physics, Lund University, Lund, Sweden
Synopsis
Sugar-based compounds have shown potential as biodegradable contrast agents for cancer detection. Recently, a multi-size dextran MRI approach was developed for detecting permeability-related properties in tumors. Here, we explored a small size dextran, dextran1 (MW~ 1 kD), as a new MRI contrast agent for detecting brain tumor hemodynamic properties including
Introduction:
Diamagnetic agents-based Chemical Exchange Saturation Transfer (CEST) MRI agents have been developed recently to overcome the limitations of Gd-based agents1. A recent study showed that the use of dextrans (a highly branched polymerized glucose) of different sizes could be used as new MRI agents for assessing tumor permeability2. Here, we investigated the ability of the smallest FDA-approved dextran, dextran1, as a new CEST MRI agent for assessing blood-brain barrier (BBB) integrity and cerebral blood volume in a mouse brain tumor model.Methods:
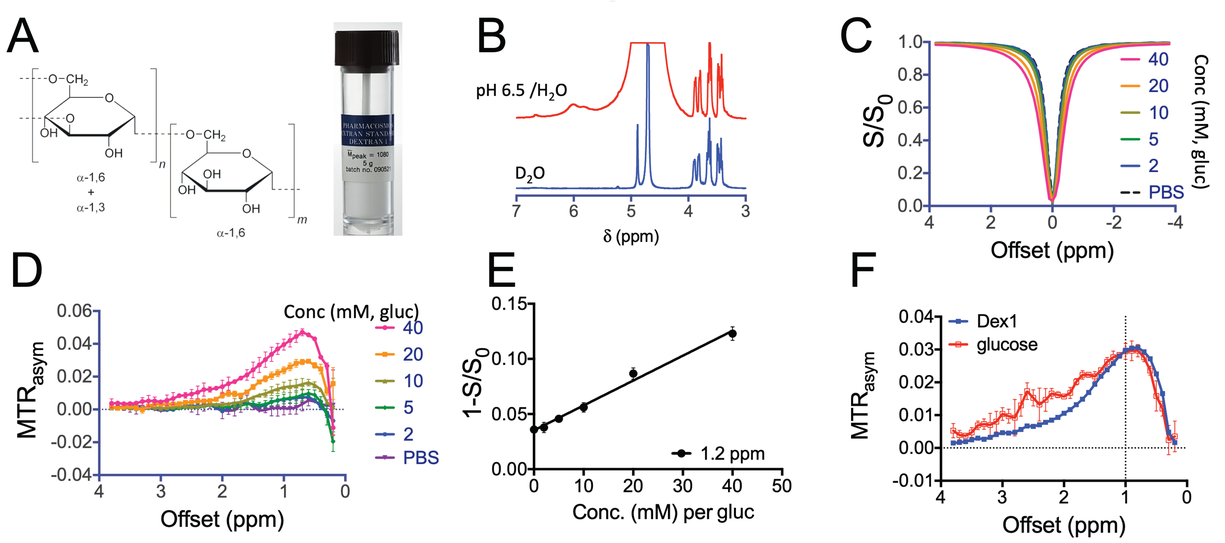
In vitro experiments: Dextran1 (Figure 1A, MW= 1 kD), was prepared in PBS buffer at different concentrations and pH values and studied with CEST MRI using a vertical bore Bruker 11.7 T MRI scanner. CEST MR images were acquired using RARE sequence with a continuous wave pre-saturation pulse (B1=1.8 µT, 3 sec) swept from -5 to +5 ppm (step=0.2 ppm) for the full Z-spectrum; TR/TE=6.0s/5 ms, RARE factor=16.
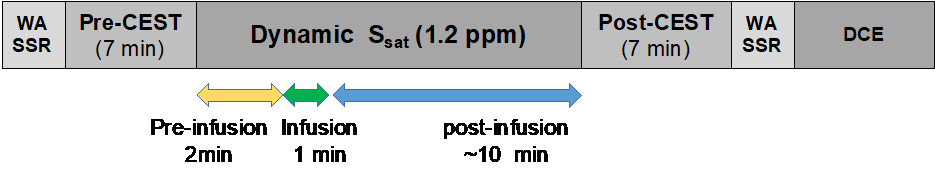
In vivo MR studies were carried out on a Biospec11.7 T horizontal MRI scanner equipped with a 23 mm mouse brain volume coil. MR images were acquired dynamically after i.v. injection of dextran1 (2 g/kg) in C57BL6 mice (female, 5-6 weeks, n=5 ) bearing GL261 orthotopic brain tumors at 21 days after stereotactically injecting 2x10⁴ GL261 cells at a depth of 3 mm below the dura, according to the imaging scheme shown in Figure 2. All CEST MR images were acquired using a modified fat-suppressed RARE sequence (CW saturation pulse, B1=1.8 µT and 3 seconds, TR/TE=5000/5 ms, RARE factor=23). B0 inhomogeneity was measured and corrected using the WASSR method. Steady-state full Z-spectra acquisitions were acquired from -4 to +4 ppm (0.2 ppm steps) and dynamic CEST was acquired at 1.2 ppm at a temporal resolution of 10s. DCE-MRI was performed using a standard procedure with details provided in the figure caption.
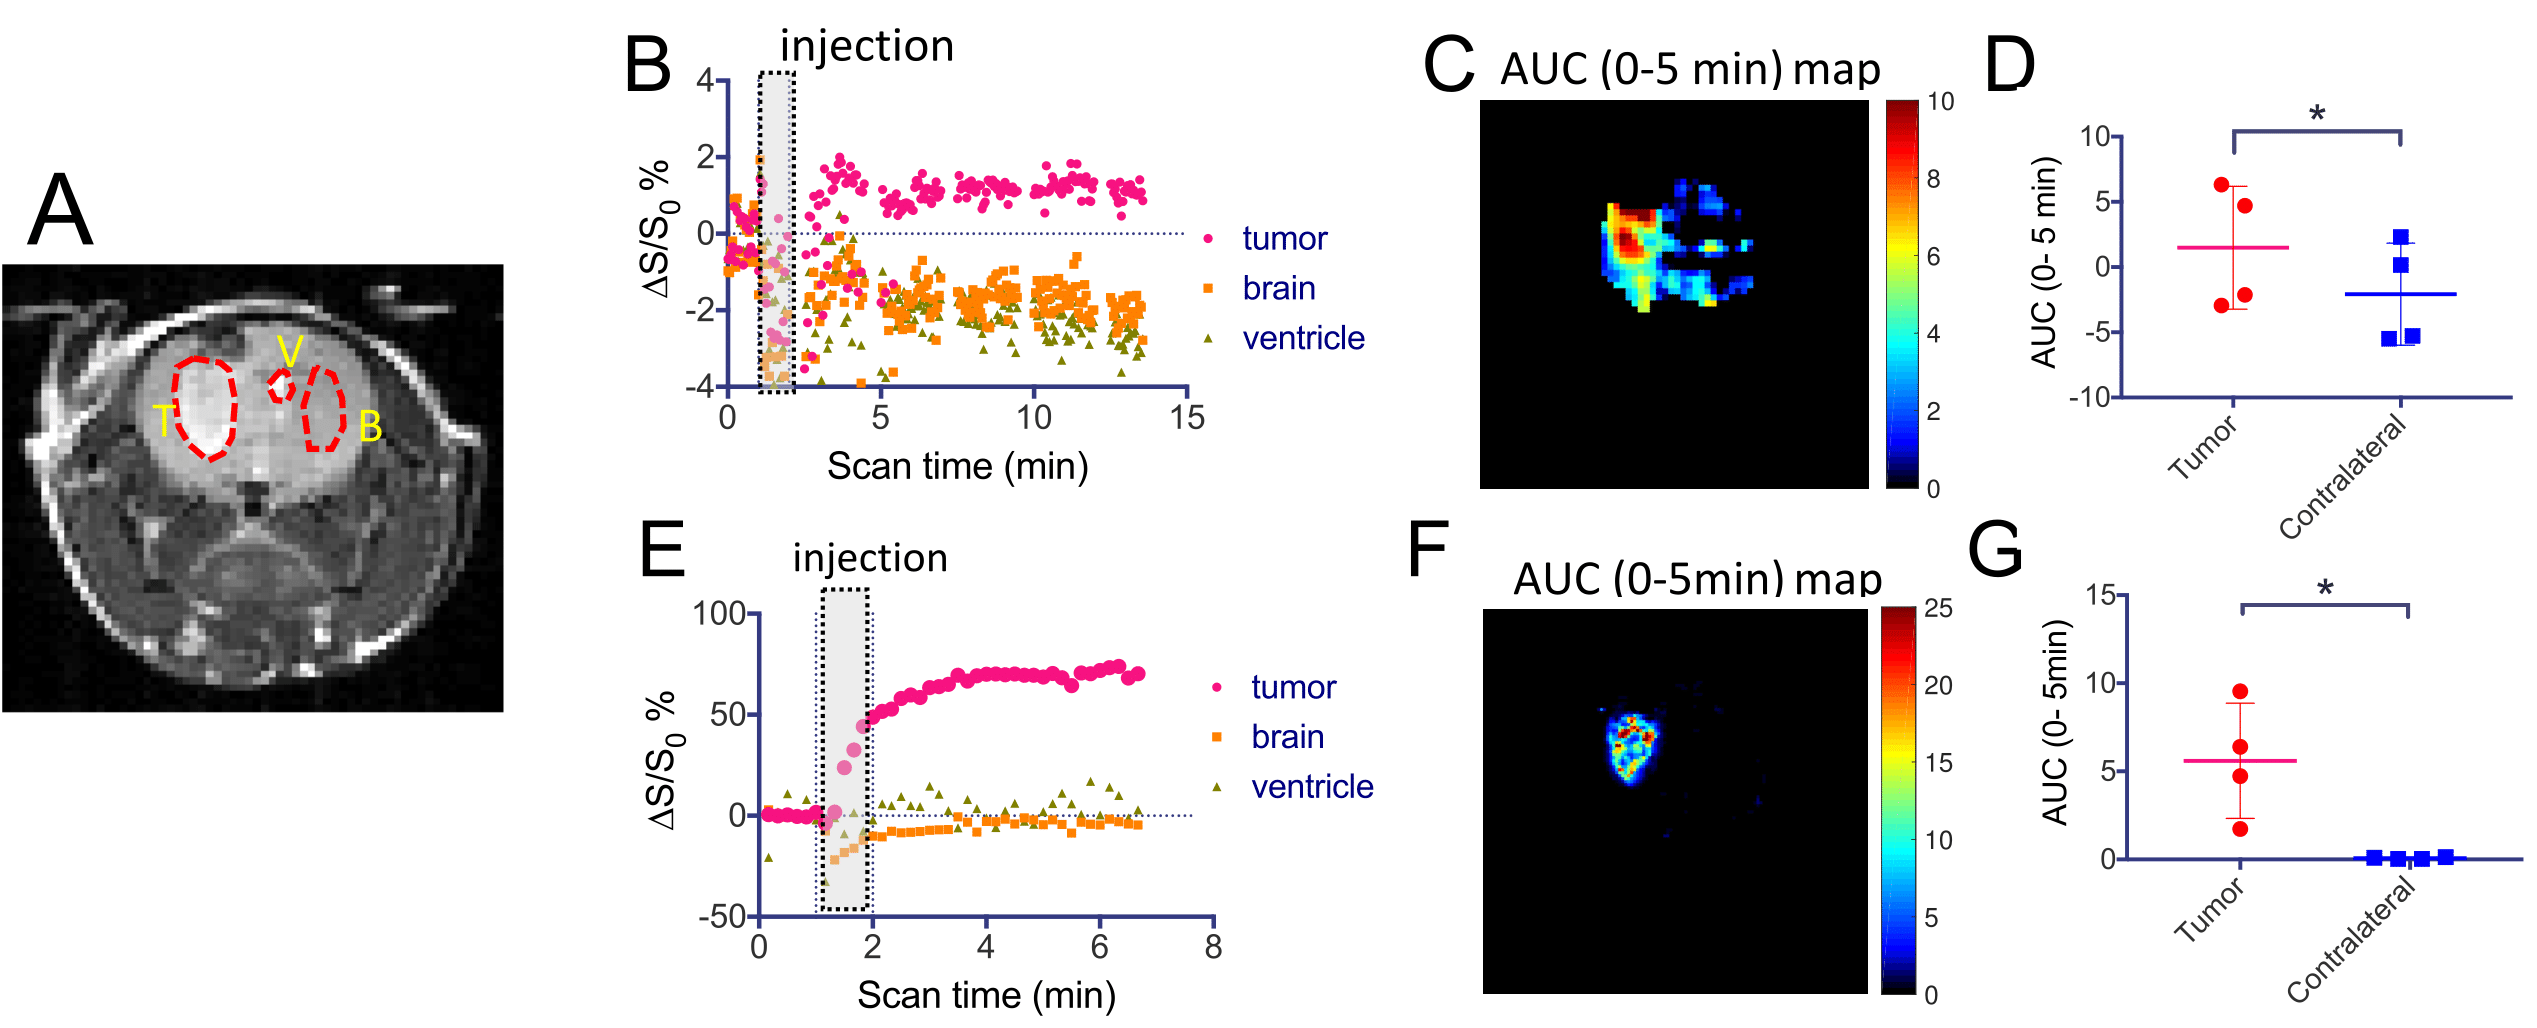
Data processing: The in vivo CEST contrast was quantified by the MTRasym=(S-Δω – S+Δω)/S0 at 1.2 ppm. The dynamic CEST contrast was quantified by ∆S1.2ppm/S0 (t)%= [S1.2ppm/S0 (t=0)- S1.2ppm/S0 (t)]x100%. The area under the curve (AUC) values were calculated pixel-by-pixel for the period of 0-5 min after injection4,5. The DCE-MRI data were quantified by the AUC between 0-5 min. Paired two-tailed Student's t-test was used in the statistical analysis.
Results:
Consistent with our previous reports2,7, dextran1 has exchangeable hydroxyl protons resonating at ~1.2 ppm relative to water, which is confirmed by NMR (Figure 1B). As shown in Figures 1C&D, these hydroxyl protons provide detectable CEST MRI signal between 0.5 to 2 ppm with respect to the water resonance frequency. To verify the single offset approach used for acquiring dynamic CEST at a high temporal resolution, we plotted the S1.2ppm/S0 vs. concentration, which showed a linear relationship in the concentration range of 2- 40 mM (per glucose). At the same glucose concentration, the CEST contrast of dextran1 at 1 ppm is comparable to that of glucose (Figure 1F), indicating the detectability of dextran1 is approximately five times higher than that of glucose (MW=180) on a per molecule basis.
The dynamic CEST MRI contrast changes were studied in three ROIs of tumor, brain and ventricle in a representative mouse (Figure 3A). After injection, the CEST contrast (∆S1.2ppm/S0) in the tumor substantially increased after the initial oscillation but not in the contralateral brain (Figure 3B). The ventricle area showed a similar dynamic as the brain, indicating that dextran1 can’t enter cerebrospinal fluid (CSF). The quantitative AUC map (Figures 3C-D) showed significantly higher uptake in the tumor as compared to the brain (9.74 vs 2.83, P=0.0194), consistent with that by Gd-based DCE (Figures 3E-G).
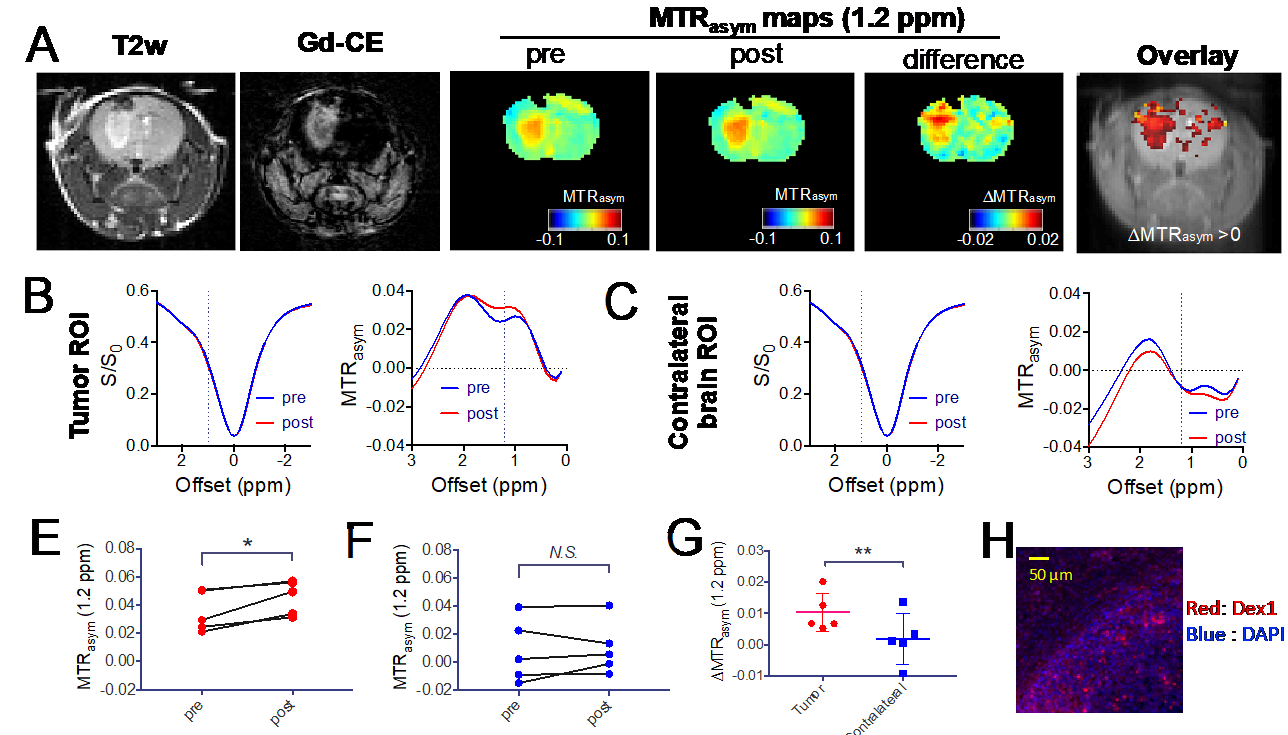
The full Z-spectral analysis (Figure 4), which allows a more comprehensive comparison of the pre- and post-injection contrast after correction for B0 inhomogeneity, showed a marked CEST contrast enhancement in the tumor than in the brain. Interestingly, there are also some areas showing noticeable CEST contrast outside the tumor, which is being investigated. The comparison of pre- and post-injection mean ROI CEST contrast (Figures 4B-C) revealed a noticeable contrast at ~1.2 ppm in the tumor (P=0.0201) but not in the contralateral brain (P=0.6290). The contrast enhancement in the tumor is significantly higher than that in the brain (∆MTRasym=1.04 ±0.62% and 0.19±0.82% respectively, P=0.0069). Finally, the MRI findings were also validated using fluorescence microscopy (Figure 4H).
Conclusion:
In summary, we successfully developed the smallest dextran, dextran1, as a novel MRI contrast agent and applied it to assess the BBB permeability and hemodynamic behaviors in the brain tumors. Dextran1 has an excellent safety profile with a relatively higher detectability per molecule than D-glucose and no contamination from CSF uptake, making it potentially a clinically useful MRI contrast agent.Acknowledgements
Supported by NIH grants R01CA211087 and R21CA215860.References
- Xu, X., et al. Dynamic Glucose-Enhanced (DGE) MRI: Translation to Human Scanning and First Results in Glioma Patients. Tomography : a journal for imaging research 1, 105-114 (2015).
- Li, Y., et al. Characterization of tumor vascular permeability using natural dextrans and CEST MRI. Magn. Reson. Med. 79, 1001-1009 (2018).
- Liu, G., Gilad, A.A., Bulte, J.W., van Zijl, P.C. & McMahon, M.T. High-throughput screening of chemical exchange saturation transfer MR contrast agents. Contrast Media Mol. Imaging 5, 162-170 (2010).
- Alic, L., et al. Heterogeneity in DCE-MRI parametric maps: a biomarker for treatment response? Phys. Med. Biol. 56, 1601-1616 (2011).
- Sehgal, A.A., et al. CEST MRI of 3-O-methyl-D-glucose uptake and accumulation in brain tumors. Magn. Reson. Med. (2018).
- Cardenas-Rodriguez, J., Howison, C.M. & Pagel, M.D. A linear algorithm of the reference region model for DCE-MRI is robust and relaxes requirements for temporal resolution. Magn. Reson. Imaging 31, 497-507 (2013).
- Chan, K.W., et al. Natural D-glucose as a biodegradable MRI contrast agent for detecting cancer. Magn. Reson. Med. 68, 1764-1773 (2012).
- Zaiss, M., et al. Inverse Z-spectrum analysis for spillover-, MT-, and T -corrected steady-state pulsed CEST-MRI - application to pH-weighted MRI of acute stroke. NMR Biomed. (2014).
- Chandran, S.S., Banerjee, S.R., Mease, R.C., Pomper, M.G. & Denmeade, S.R. Characterization of a targeted nanoparticle functionalized with a urea-based inhibitor of prostate-specific membrane antigen (PSMA). Cancer Biol. Ther. 7, 974-982 (2008).
Figures