0542
Sequential and Deep Multi-Pool CEST MR Fingerprinting in In-Vivo Tumor-Bearing Mice1A. A. Martinos Center for Biomedical Imaging, Massachusetts General Hospital and Harvard Medical School, Charlestown, MA, United States, 2Memorial Sloan Kettering Cancer Center, New York, NY, United States, 3Brigham and Women’s Hospital and Harvard Medical School, Boston, MA, United States
Synopsis
Magnetic resonance fingerprinting (MRF) was recently suggested for fast and quantitative chemical exchange saturation transfer (CEST) imaging. However, for in-vivo pathologies, multiple tissue parameters will vary simultaneously, thereby reducing the schedule discrimination ability and increasing the reconstruction time. Herein, we propose the sequential utilization of three MRF acquisition schedules and their incorporation in deep-learning reconstruction networks (DRONE). The technique outputs 6 quantitative maps (water, semi-solid, and amide pool properties) with acquisition and reconstruction times of 365s and <200ms, respectively. The method was evaluated in a longitudinal brain-tumor mouse study, yielding comparable parameter values to ground-truth and traditional Z-spectrum evaluations.
Introduction
Chemical exchange saturation transfer (CEST) MRI is a molecular imaging technique, which detects proteins and metabolites with labile protons.1 However, the commonly employed CEST implementation is qualitative and the image contrast is influenced by multiple exchangeable proton pools,2 including the solute, semi-solid magnetization transfer (MT), and nuclear overhauser effect pools, as well as the water T1 and T2 relaxation times.3 Although several quantitative CEST methods were previously developed,4 most implementations were confined to in-vitro studies,5 while the fully quantitative multi-Z-spectra fitting approach, needed for in-vivo studies, requires very long acquisition times.
Recently, a CEST magnetic resonance fingerprinting (MRF6) approach was developed, in which the saturation pulse power and/or length were pseudo-randomly varied.7,8 The resulting signal trajectories were then matched to a CEST-MRF dictionary, resulting in quantitative CEST maps. Although preliminary results in phantoms and healthy rodents were promising, several challenges should be considered when addressing pathological scenarios: (1) Changes in water T1 and T2 significantly affect the signal trajectory; (2) The accuracy is limited by the resolution of the matching dictionary; (3) The dictionary size must increase substantially to include relaxation and exchange parameters, thereby increasing the dictionary computation and image reconstruction times.
To overcome these challenges, a CEST-MRF approach is proposed in which water T1/T2 , MT, and CEST acquisition schedules are sequentially processed by 3 different deep-learning neural networks9 to provide quantitative maps of the water relaxation times and the solute and MT exchange parameters. Initial studies were performed in tumor-bearing mice.
Methods
CEST-MRF Acquisition Schedules
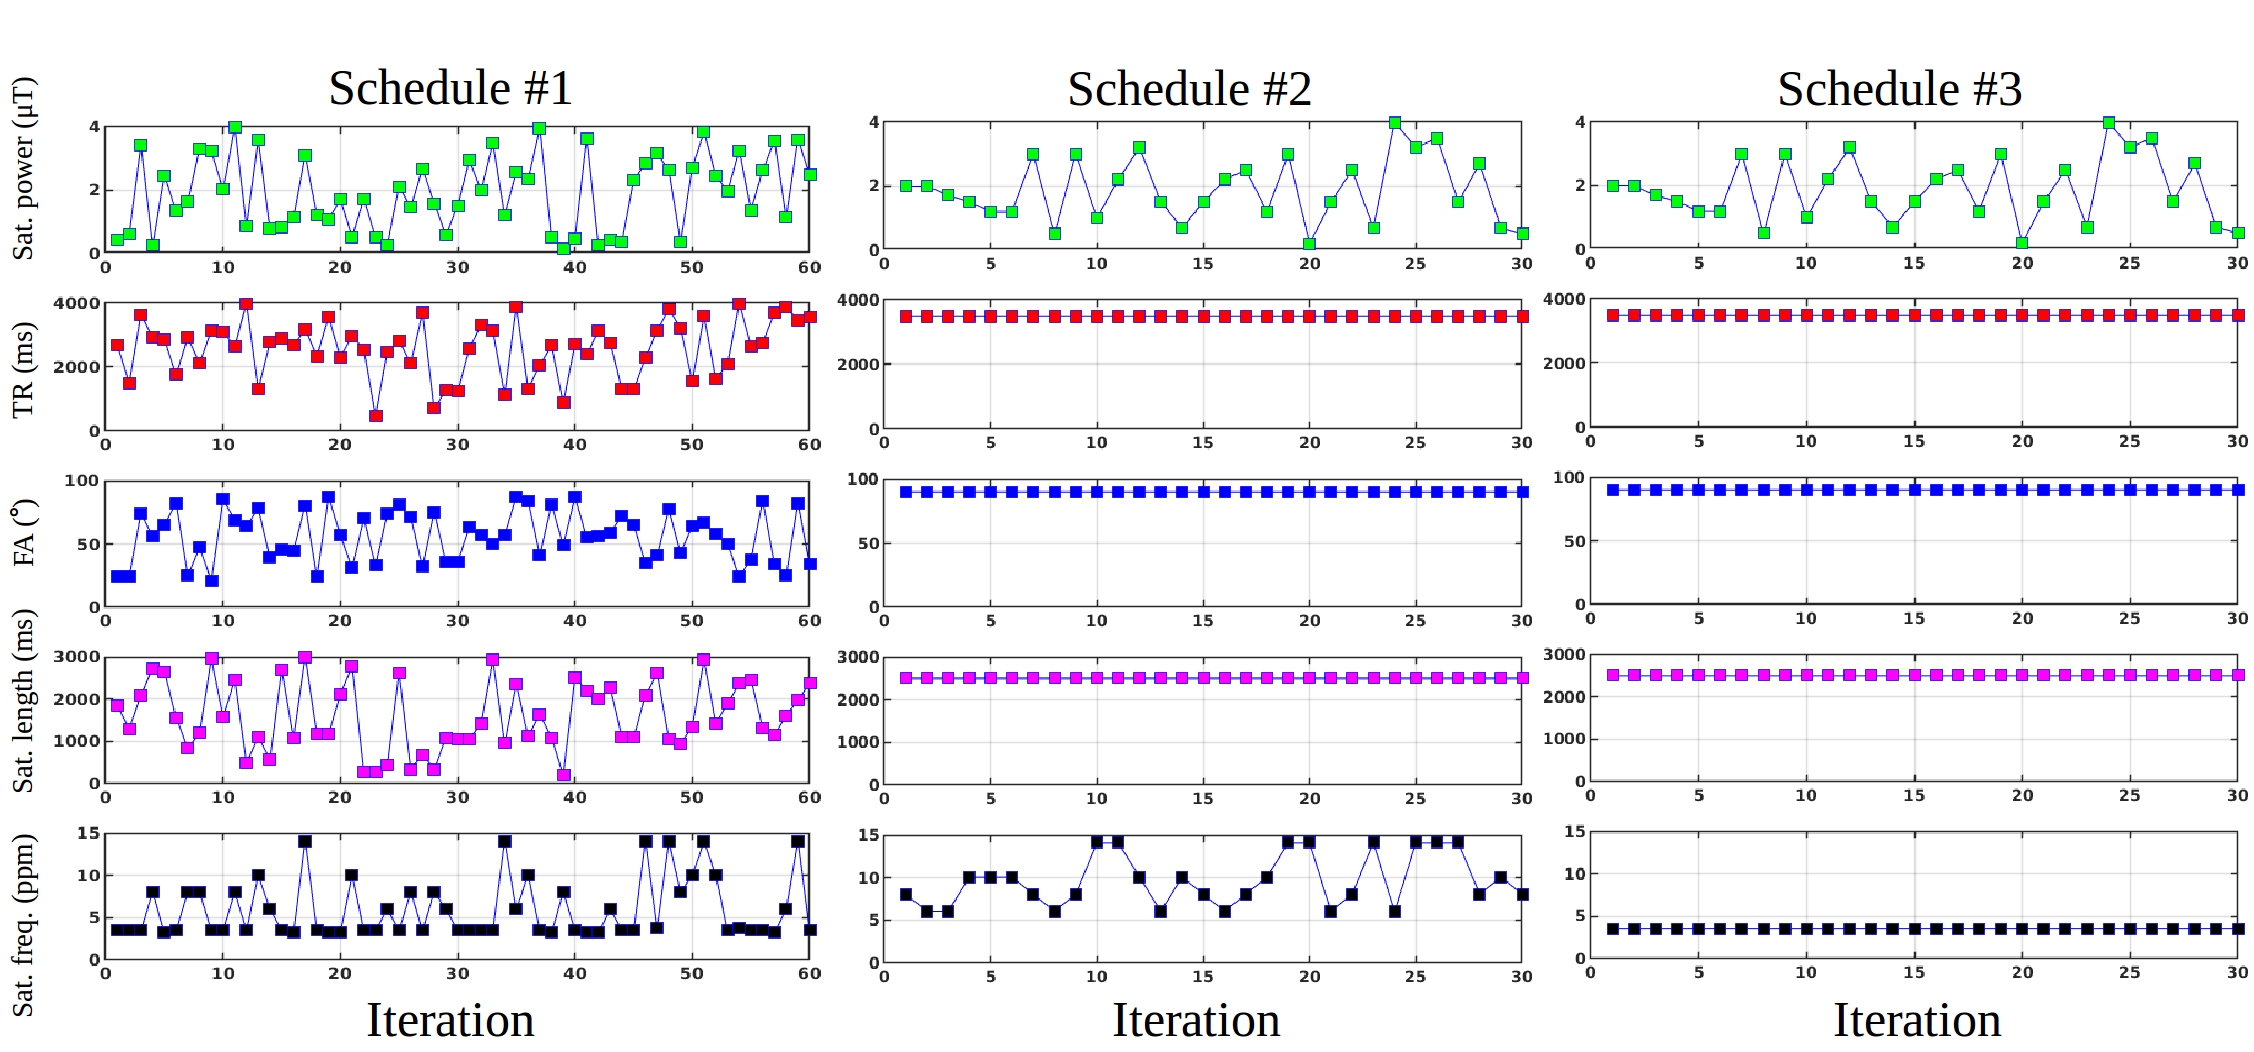
Three CEST-MRF schedules were designed and employed sequentially (Fig. 1). The first schedule was optimized for obtaining water T1 and T2 relaxation times and varied the saturation pulse power, offset, and length, as well as the excitation flip-angle and the repetition time. The second schedule was optimized for quantification of the MT pool exchange parameters and varied the saturation offset (6-14 ppm) as well as the saturation power. The third schedule was optimized for quantifying the amide-CEST pool exchange properties and varied the saturation power, but kept the saturation offset fixed at 3.5 ppm.7 The total scan time for all three schedules was 365s.
Reconstruction methodology
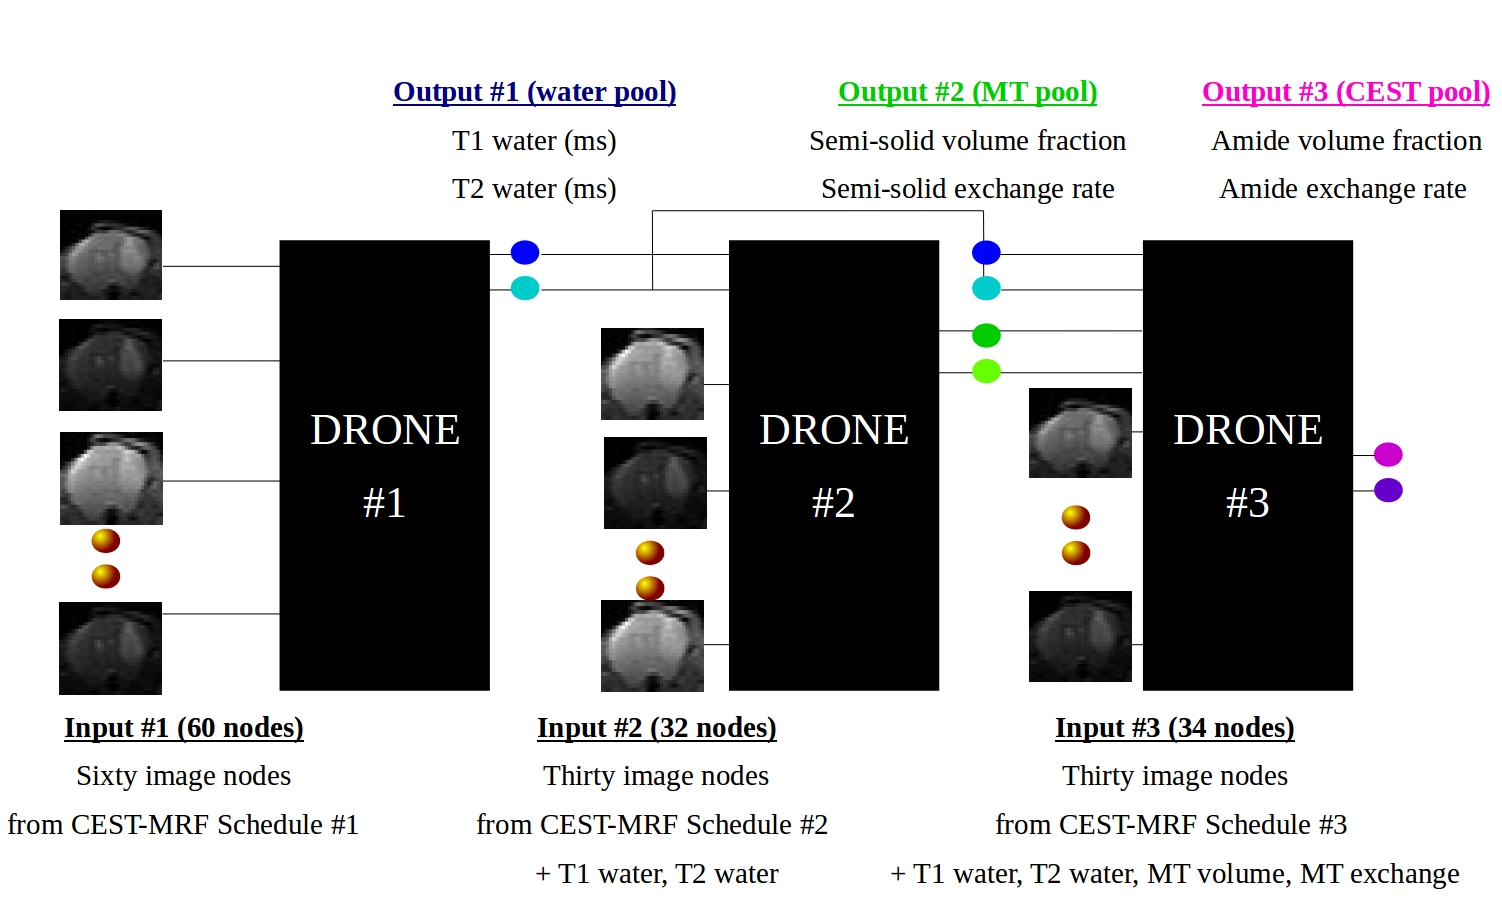
The entire reconstruction scheme is depicted in Fig. 2. The pixelwise signal trajectories from schedule #1 were input to a deep reconstruction network (DRONE9, trained using a dictionary of 2 million entries). The output T1 and T2 of water were then input to a second DRONE (trained using a 102K entry dictionary), together with the resulting images from schedule #2. The two MT parameter outputs, together with the water T1, T2, and the images obtained from schedule #3, were then input to the last DRONE (trained using 2 million three-pool entries) to generate the CEST pool parameter maps. To reduce over-fitting and increase training robustness, a 20 dB white Gaussian noise was injected into the dictionaries.10
In vivo imaging
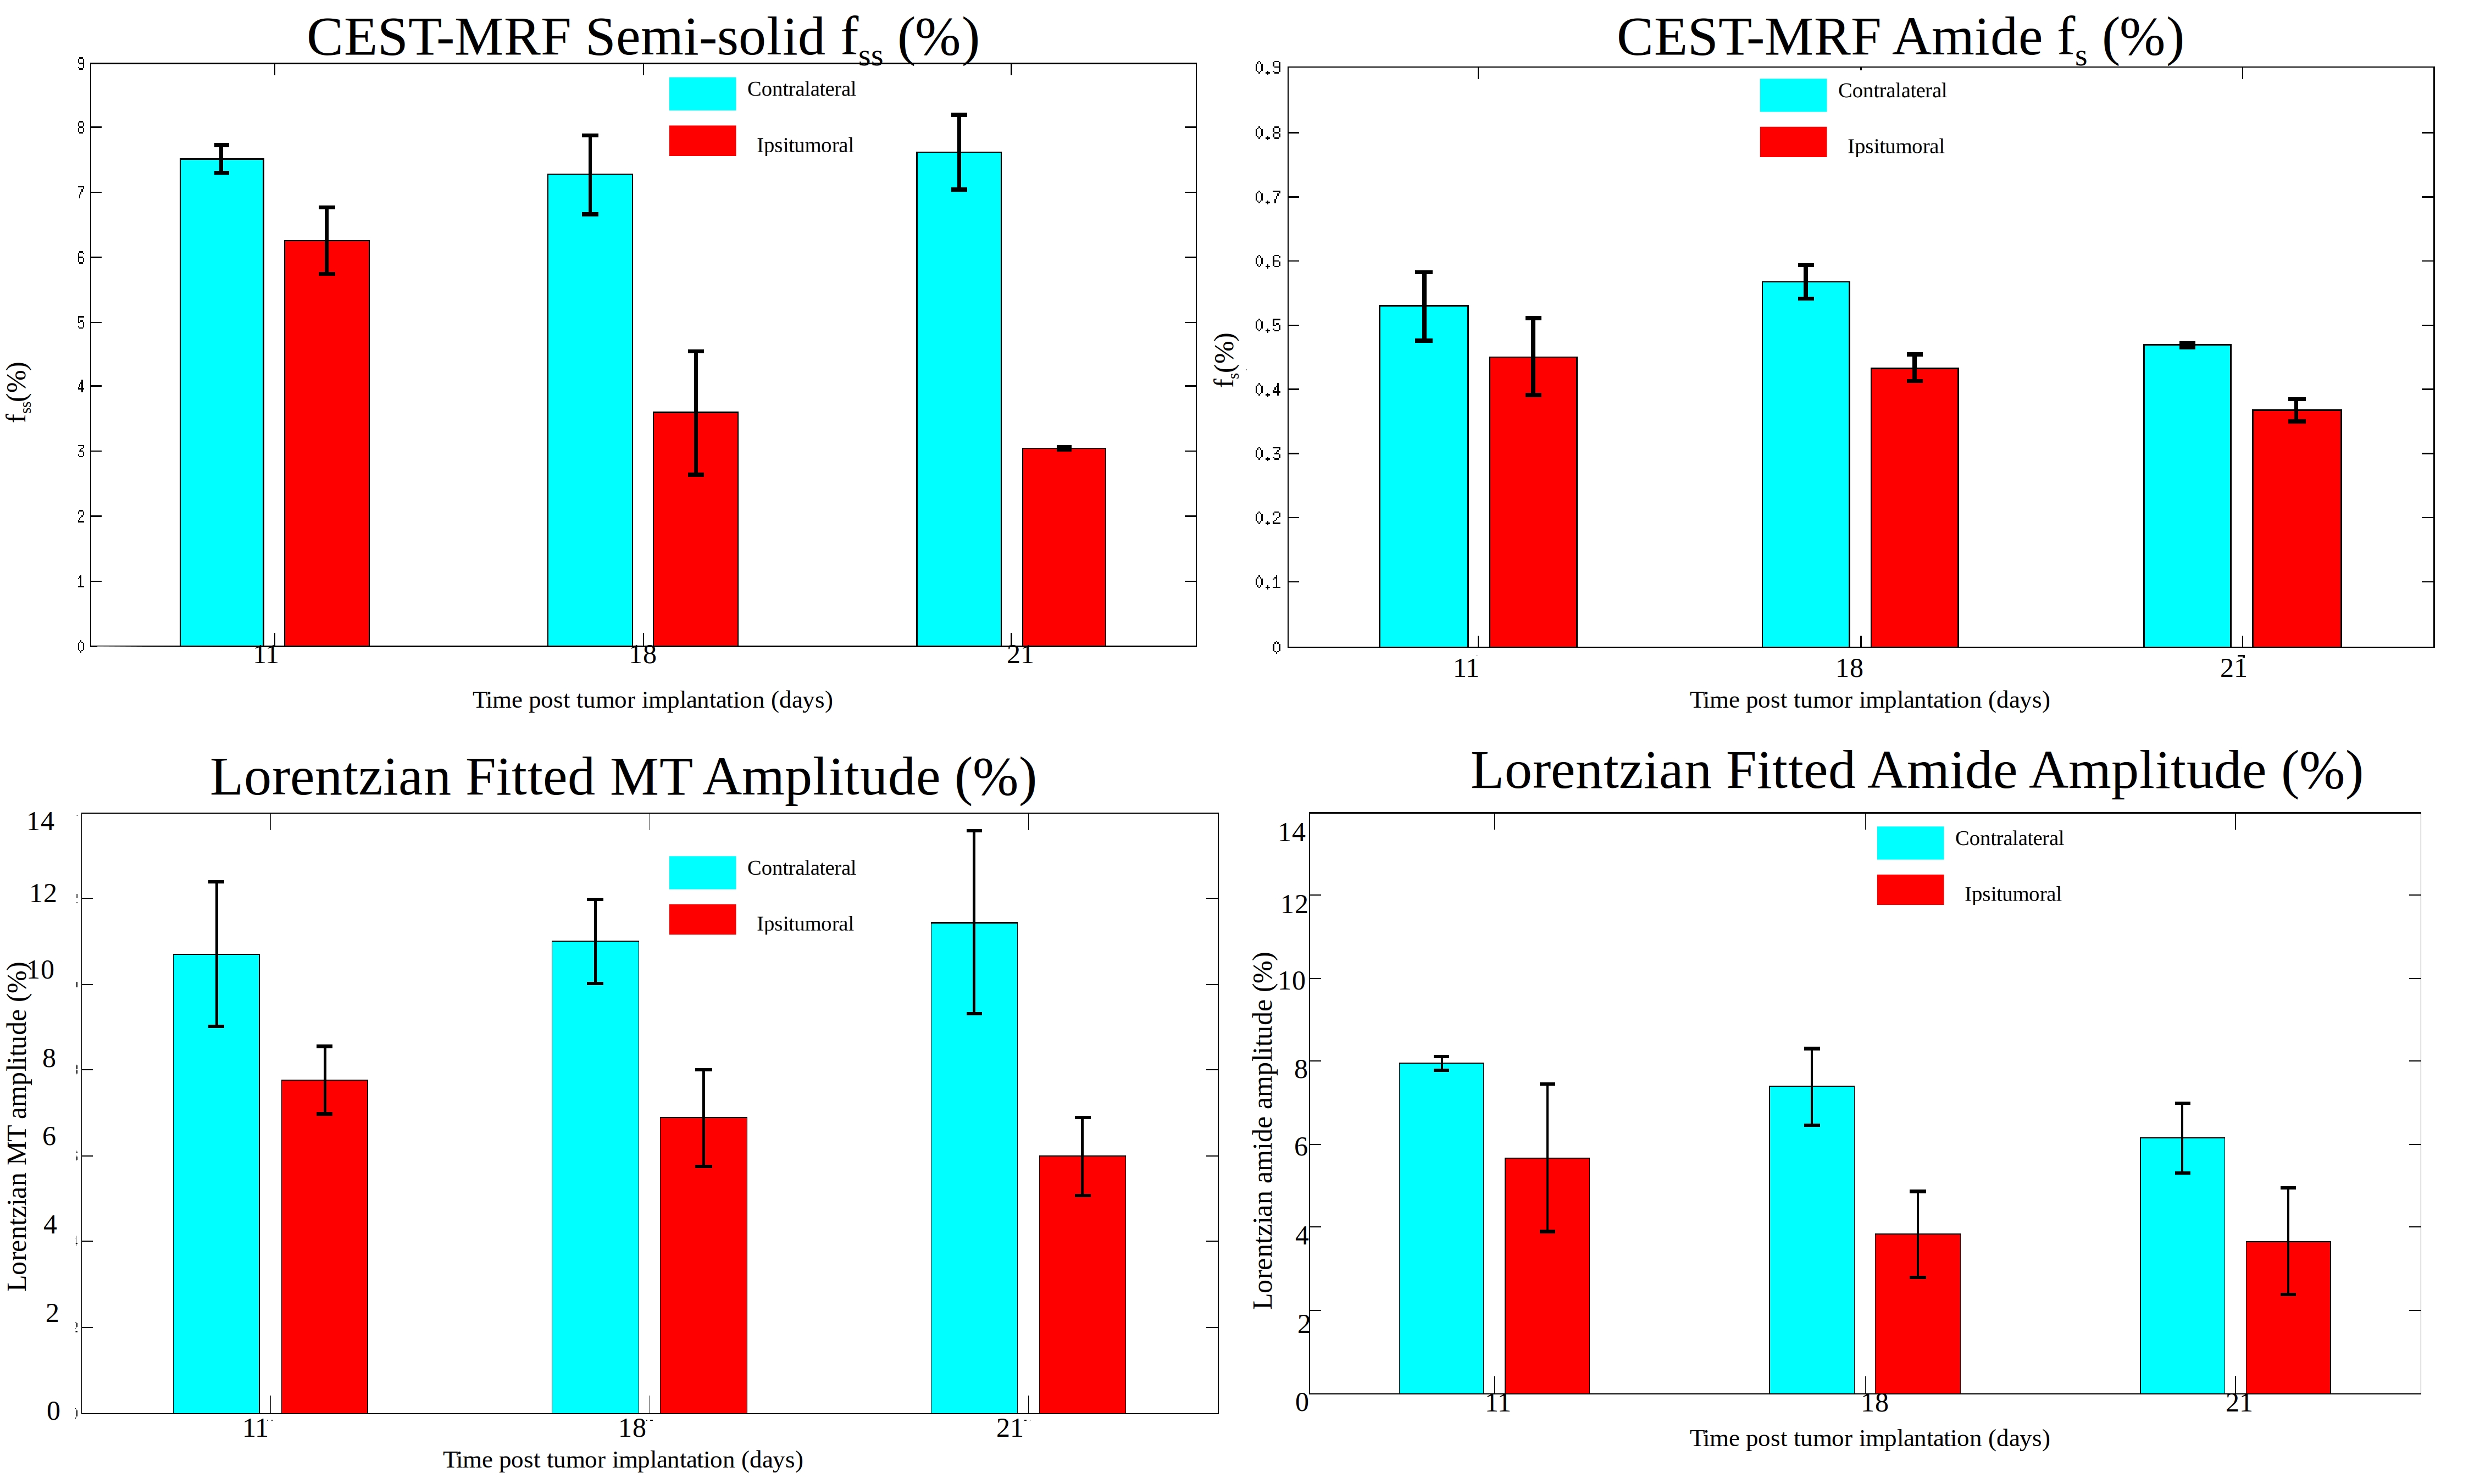
All animal procedures were approved by the institutional committee. A GL261 brain tumor was implanted in the brain of two C57BL6 mice. The mice were imaged at 11, 18, and 21 days after the tumor implantation, using a 7T preclinical MRI (Bruker, Germany). Imaging experiments included the described CEST-MRF schedules (Fig. 1), as well as T1, T2, and B0 mapping. A traditional CEST acquisition was also performed for comparison. A multi-pool Lorentzian model was fitted to the obtained Z-spectrum using an in-house written MATLAB script.
Results and Discussion
Conclusion
Sequential and deep CEST MR fingerprinting constitute a fast and quantitative means for obtaining multi-pool information. In the future, the optimal sequence for each acquisition step should be further pursued for improved accuracy.Acknowledgements
Grants R01-CA203873, P41-RR14075, 1S10RR023401, 1S10RR019307, and 1S10RR023043.References
1. Liu, G., Song, X., Chan, K. W., and McMahon, M. T. Nuts and bolts of chemical exchange saturation transfer MRI. NMR in Biomedicine 2013;26(7):810–828.
2. Zhou, I. Y., Wang, E., Cheung, J. S., Zhang, X., Fulci, G., and Sun, P. Z. Quantitative chemical exchange saturation transfer (CEST) MRI of glioma using image downsampling expedited adaptive least-squares (ideal) fitting. Scientific reports, 2017;7(1):84.
3. Zaiss, M., Xu, J., Goerke, S., Khan, I. S., Singer, R. J., Gore, J. C., Gochberg, D. F., and Bachert, P. Inverse z-spectrum analysis for spillover-, mt-, and t1-corrected steady- state pulsed CEST-MRI–application to ph-weighted MRI of acute stroke. NMR in biomedicine, 2014;27(3):240–252.
4. Kim, J., Wu, Y., Guo, Y., Zheng, H., and Sun, P. Z. A review of optimization and quantification techniques for chemical exchange saturation transfer MRI toward sensitive in vivo imaging. Contrast media & molecular imaging, 2015;10(3):163–178.
5. Zaiss, M., Angelovski, G., Demetriou, E., McMahon, M. T., Golay, X., and Scheffler, K. QUEST revisited–fast and accurate quantitative CEST experiments. Magnetic resonance in medicine, 2018;79(3):1708–1721.
6. Ma, D., Gulani, V., Seiberlich, N., Liu, K., Sunshine, J. L., Duerk, J. L., and Griswold, M. A. Magnetic resonance fingerprinting. Nature 2013;495(7440):187.
7. Cohen, O., Huang, S., McMahon, M. T., Rosen, M. S., and Farrar, C. T. Rapid and quantitative chemical exchange saturation transfer (CEST) imaging with magnetic resonance fingerprinting (MRF). Magnetic resonance in medicine. 2017 DOI:10.1002/mrm.27221.
8. Zhou, Z., Han, P., Zhou, B., Christodoulou, A. G., Shaw, J. L., Deng, Z., and Li, D. Chemical exchange saturation transfer fingerprinting for exchange rate quantification. Magnetic resonance in medicine. 2018
9. Cohen, O., Zhu, B., and Rosen, M. S. MR fingerprinting deep reconstruction network (drone). Magnetic resonance in medicine, 2018;80(3):885–894.
10. Zur, R. M., Jiang, Y., Pesce, L. L., and Drukker, K. Noise injection for training artificial neural networks: A comparison with weight decay and early stopping. Medical physics, 2009;36(10):4810–4818.
Figures