0541
Ultrashort echo time magnetization transfer (UTE-MT) imaging in the cuprizone mouse model of multiple sclerosis1Physical Therapy and Rehabilitation Science, University of California San Francisco, San Francisco, CA, United States, 2Radiology and Biomedical Imaging, University of California San Francisco, San Francisco, CA, United States, 3Pharmaceutical, Veterinary and Biomedical Sciences, Bio-Imaging Laboratory, Antwerp, Belgium, 4Berkeley and University of California, UC Berkeley-UCSF Graduate Program in Bioengineering, San Francisco, CA, United States
Synopsis
We first evaluated the potential of ultrashort echo time magnetization transfer (UTE-MT) and MT imaging to generate high contrast images of the healthy mouse brain.
Next, we conducted a longitudinal study to examine the temporal changes of UTE-MT ratio (UTE-MTR) and MTR following cuprizone (CPZ)-mediated demyelination, gliosis, and remyelination. UTE-MTR detected CPZ-induced alterations in white matter, subcortical, and cortical grey matter during demyelination, and persistent tissue microstructure changes in grey matter. Furthermore, UTE-MTR changes correlated significantly with myelin levels.
Altogether, we showed that UTE-MT imaging holds great potential to improve characterization of brain lesions in MS at clinical field strength.
Introduction
Alterations in myelin integrity are involved in many neurological disorders, including multiple sclerosis (MS)1. Although magnetic resonance imaging (MRI) is the gold standard method to diagnose and monitor MS patients, most MRI protocols show limited specificity for myelin detection, notably in grey matter2,3. In this study, we implemented two imaging sequences that have demonstrated sensitivity to myelin content, namely magnetization transfer imaging (MT) and ultrashort echo MT (UTE-MT)4-8, on a clinical 7Tesla MRI scanner. We applied these methods to the cuprizone (CPZ) mouse model9-11, and evaluated their potential to assess brain myelin following demyelination with high level of gliosis, and subsequent remyelination.Methods
Experimental setup: Adult C57/BL6J mice (n=30) received a CPZ diet (0.2%) for six weeks to induce brain demyelination/neuroinflammation, then normal chow for six weeks. Six mice underwent longitudinal MRI prior CPZ administration (W0), after four weeks (W4 CPZ), six weeks (W6 CPZ) of CPZ diet, and six weeks of recovery (W6 CPZ + W6 recovery). Separate mice (n=24) were euthanized at each time point for immunofluorescence analyses.
MR acquisitions: MR acquisitions were performed on a GE 7T system. 3D UTE was acquired using: TR=20ms, TE1=76µs (UTE), TE2=3000µs, NA=4, voxel sixe=200*200*500µm3, with (saturated) and without (unsaturated) a magnetization transfer RF preparation pulse (-1800Hz offset frequency).
MR analyses: UTE-MT ratio (UTE-MTR, TE1=76μs) and MTR (TE2=3000μs) maps were reconstructed using the following formula: MMTR=(|Munsaturated|-|Msaturated|)/|Munsaturated|.
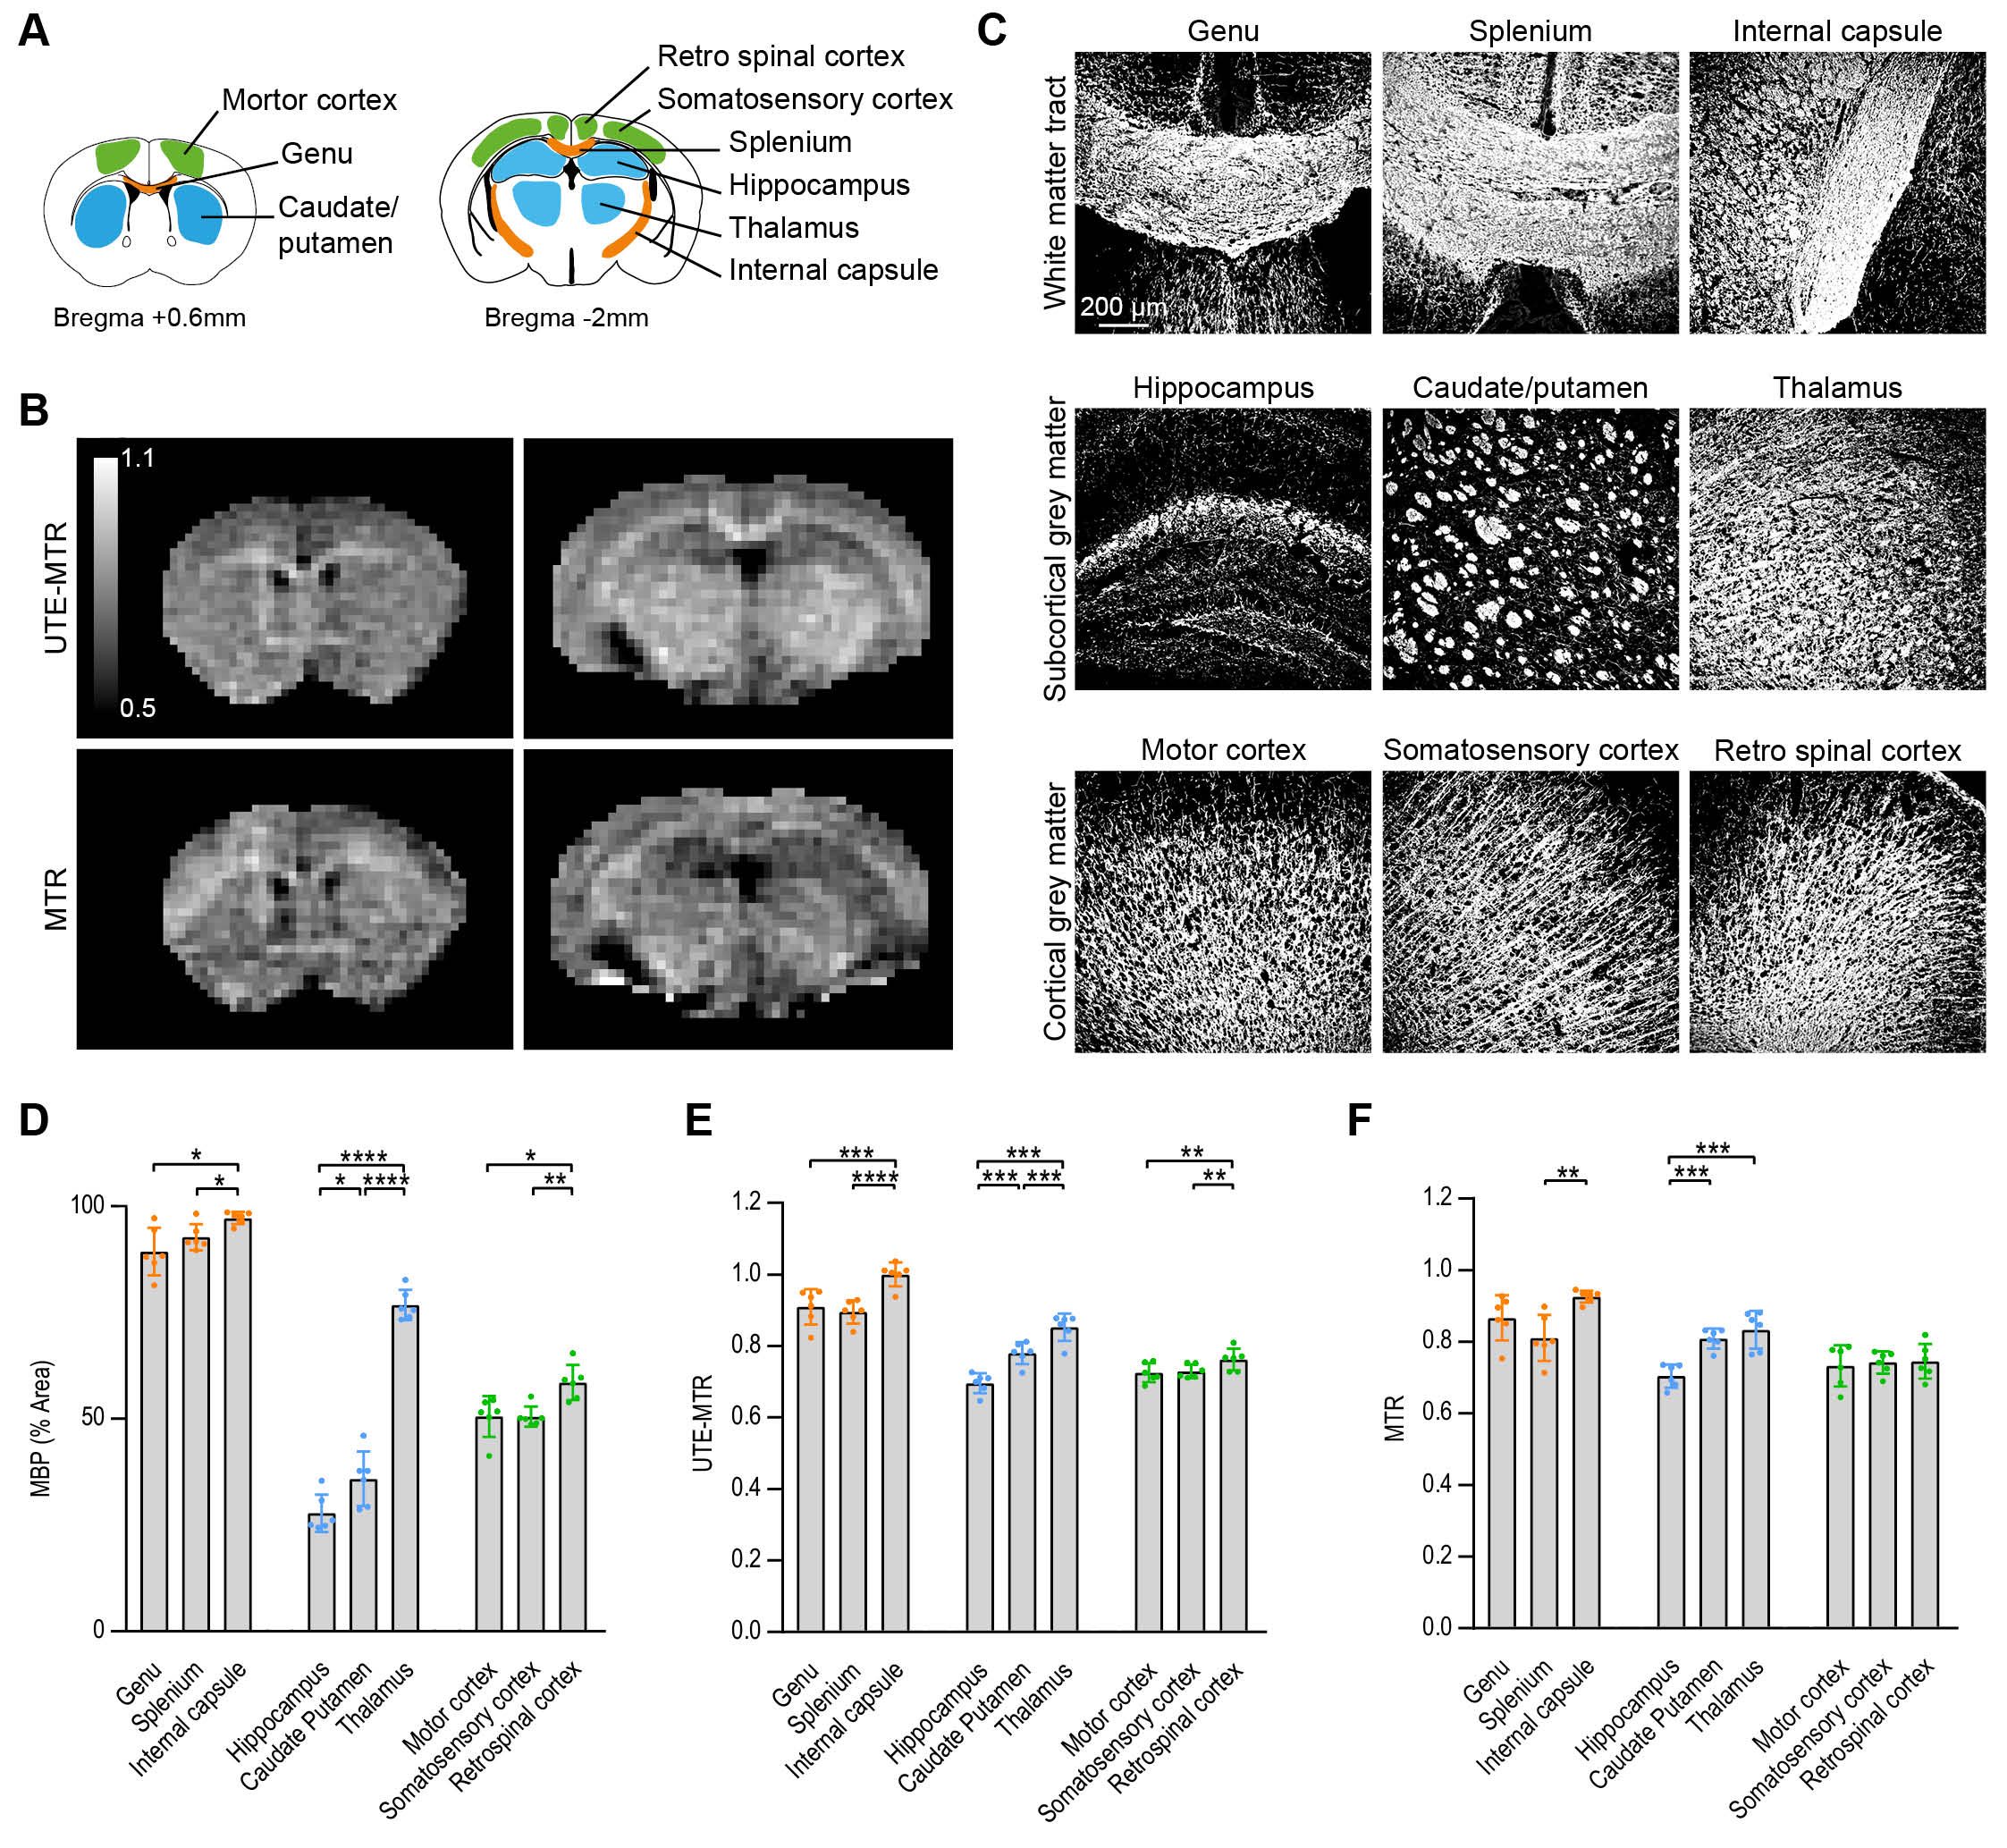
Regions of interest (ROI) were delineated on the corresponding maps, and include: I) White matter tracts: splenium, genu, internal capsule; II) Subcortical areas: thalamus, caudate/putamen, hippocampus; III) Cortical areas: retro-spinal, somatosensory, motor cortices, Figure 1.A.
Immunofluorescence: Immunofluorescence was performed for myelin basic protein (MBP) and gliosis (GFAP).
Statistics: Results are expressed as mean±SD. Statistical significance was evaluated using a One-Way or repeated measures ANOVA, (post-hoc Tukey correction). MR parameters correlation to myelin or gliosis was assessed using linear regression (*p<0.05, **p<0.01, ***p<0.001, ****p<0.0001).
Results
First, we evaluated the potential of UTE-MTR and MTR to detect cerebral substructures in the healthy mouse brain (Figure 1.B). UTE-MTR and MTR detected differences within substructures presenting different MBP content (Figure 1.C-F). Importantly, UTE-MTR could detect differences between a higher number of subregions, including: genu and internal capsule (p=0.0002), caudate/putamen and thalamus (p<0.0001) and cortical areas (p≤0.0089).
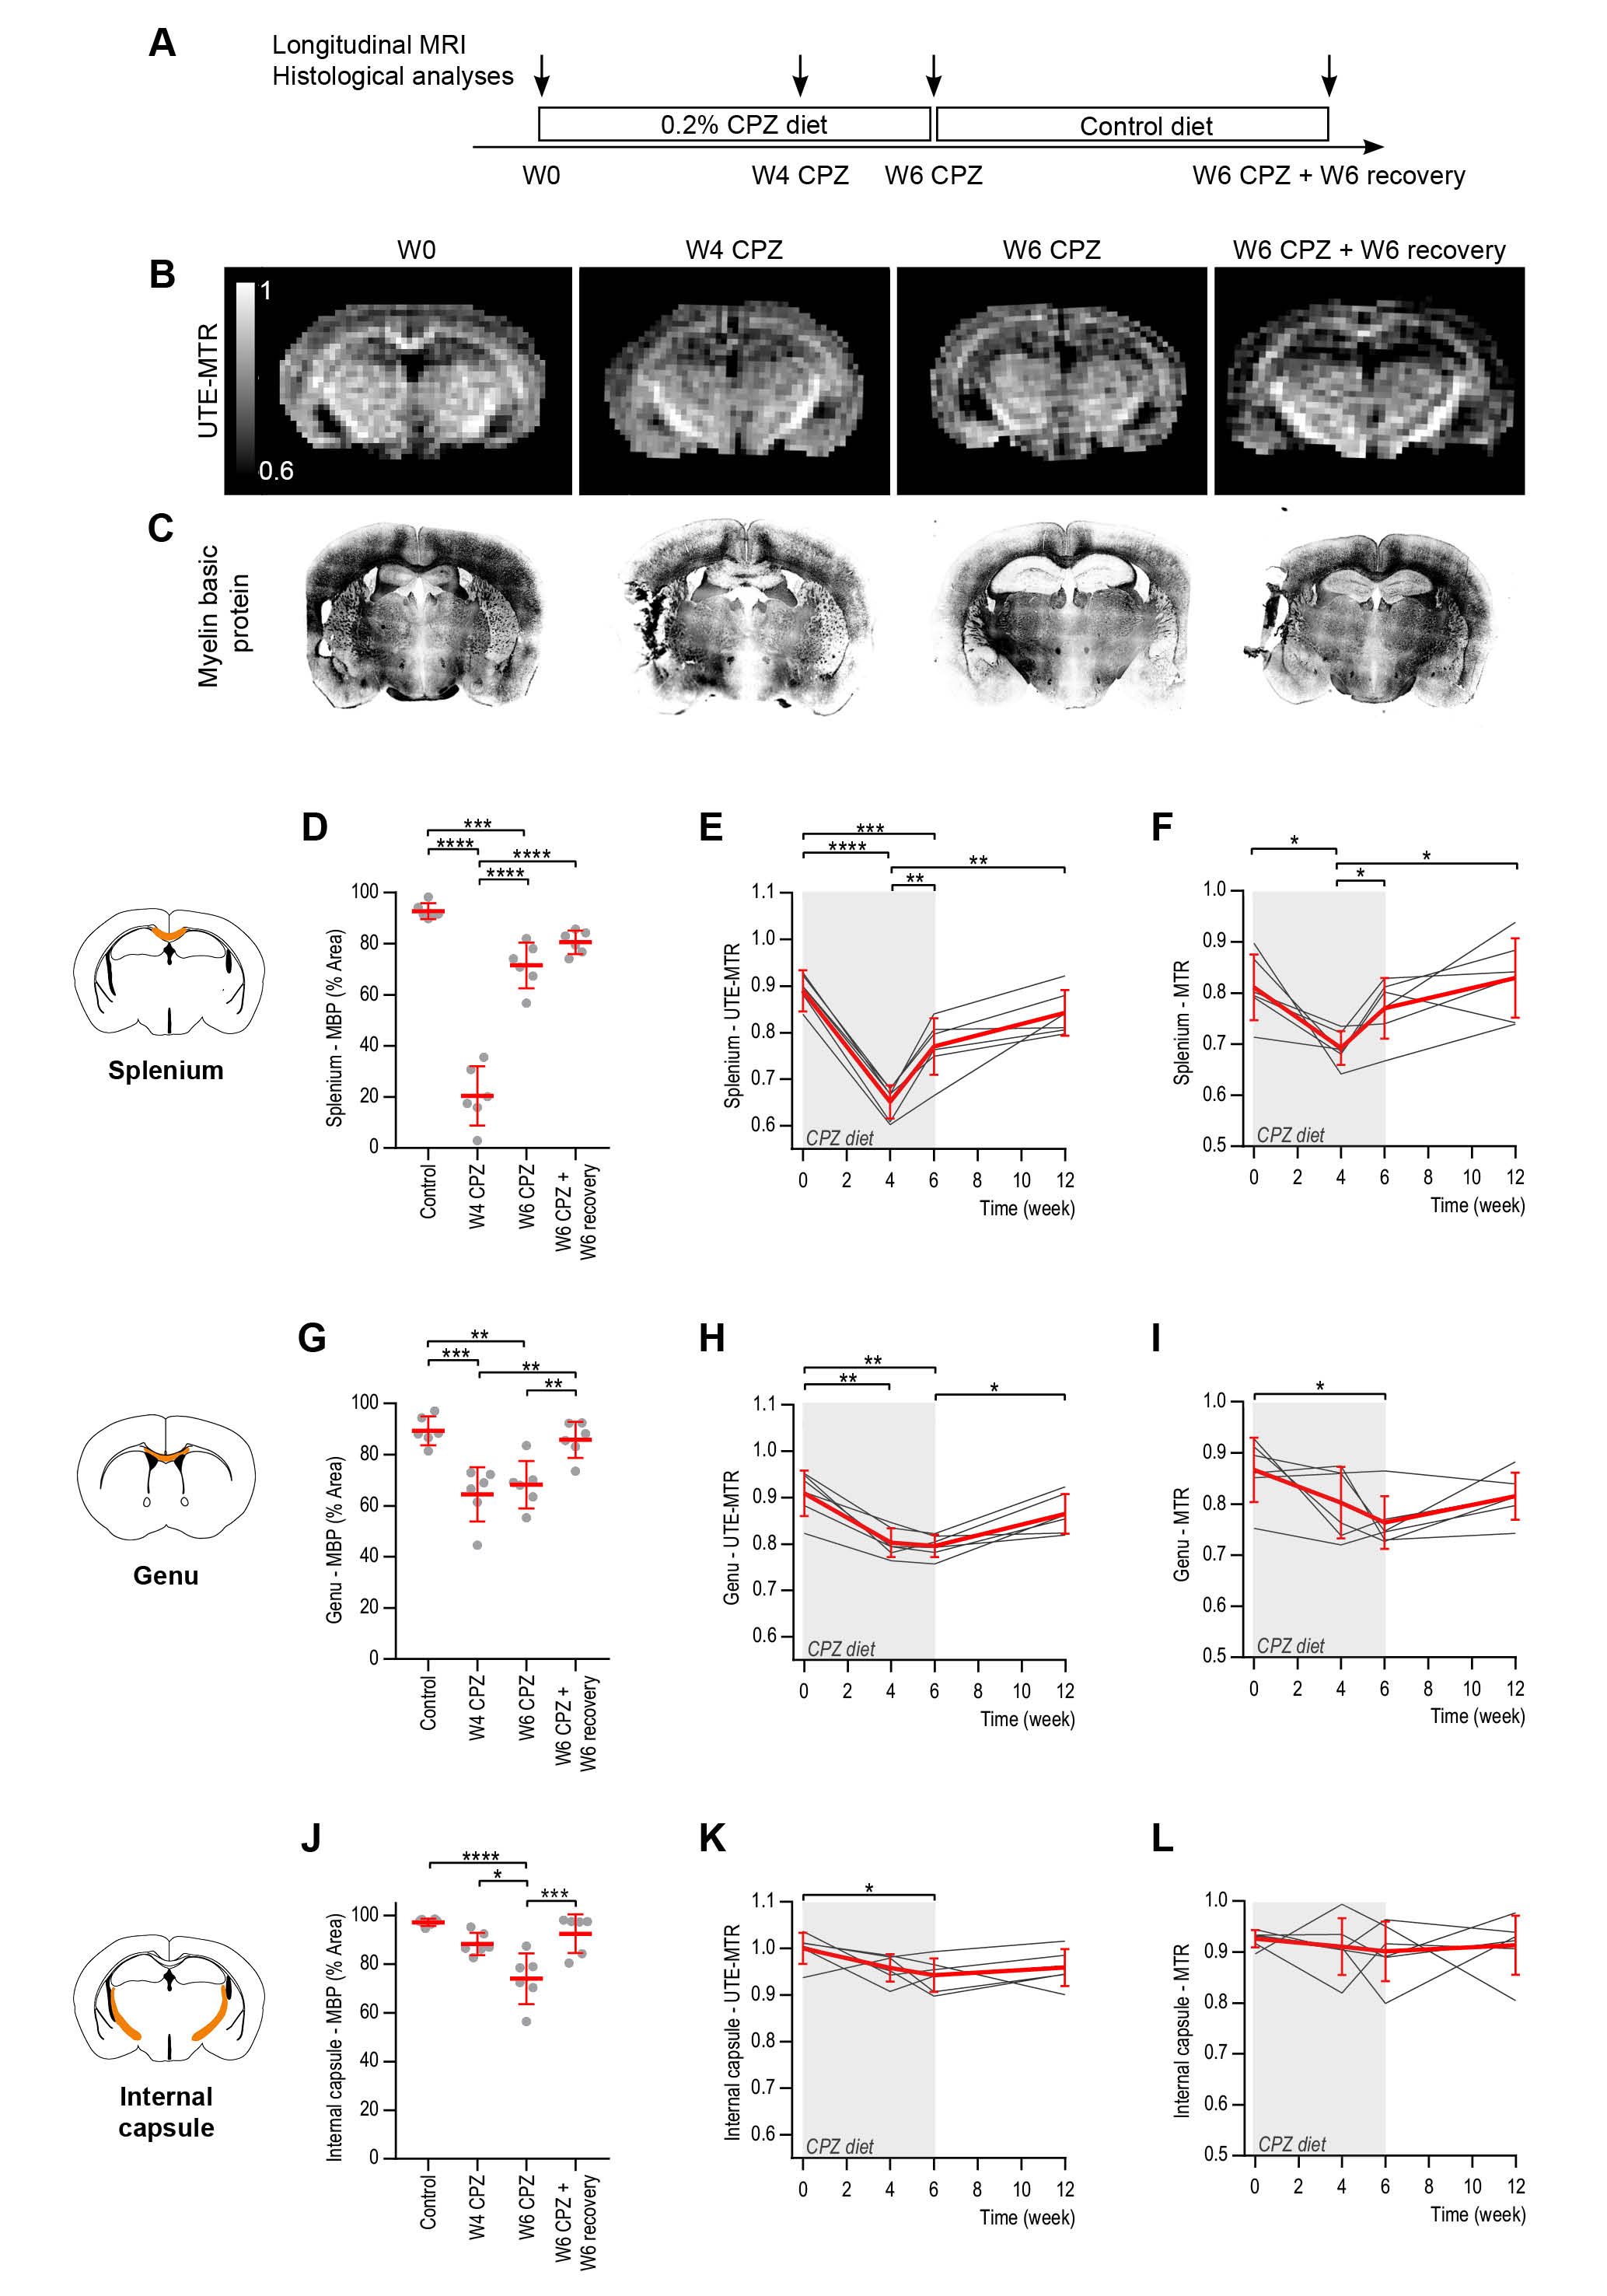
Next, we investigated whether UTE-MTR and MTR could detect dynamic changes following CPZ-induced demyelination and after recovery/remyelination (Figure 2.A). UTE-MTR maps clearly showed the hypointense splenium at W4 CPZ compared to W0, and its increased contrast back to hyperintense at W6 CPZ and after recovery, mirroring the myelin changes observed with immunofluorescence (Figure 2.B-C).
Quantitative analyses revealed that UTE-MTR detected demyelination in the splenium (p<0.0001 at W4 CPZ), genu and internal capsule, and remyelination, while MTR detected demyelination of the splenium (p=0.0491 at W4 CPZ) and genu, but only remyelination of the splenium (Figure 2.D-L).
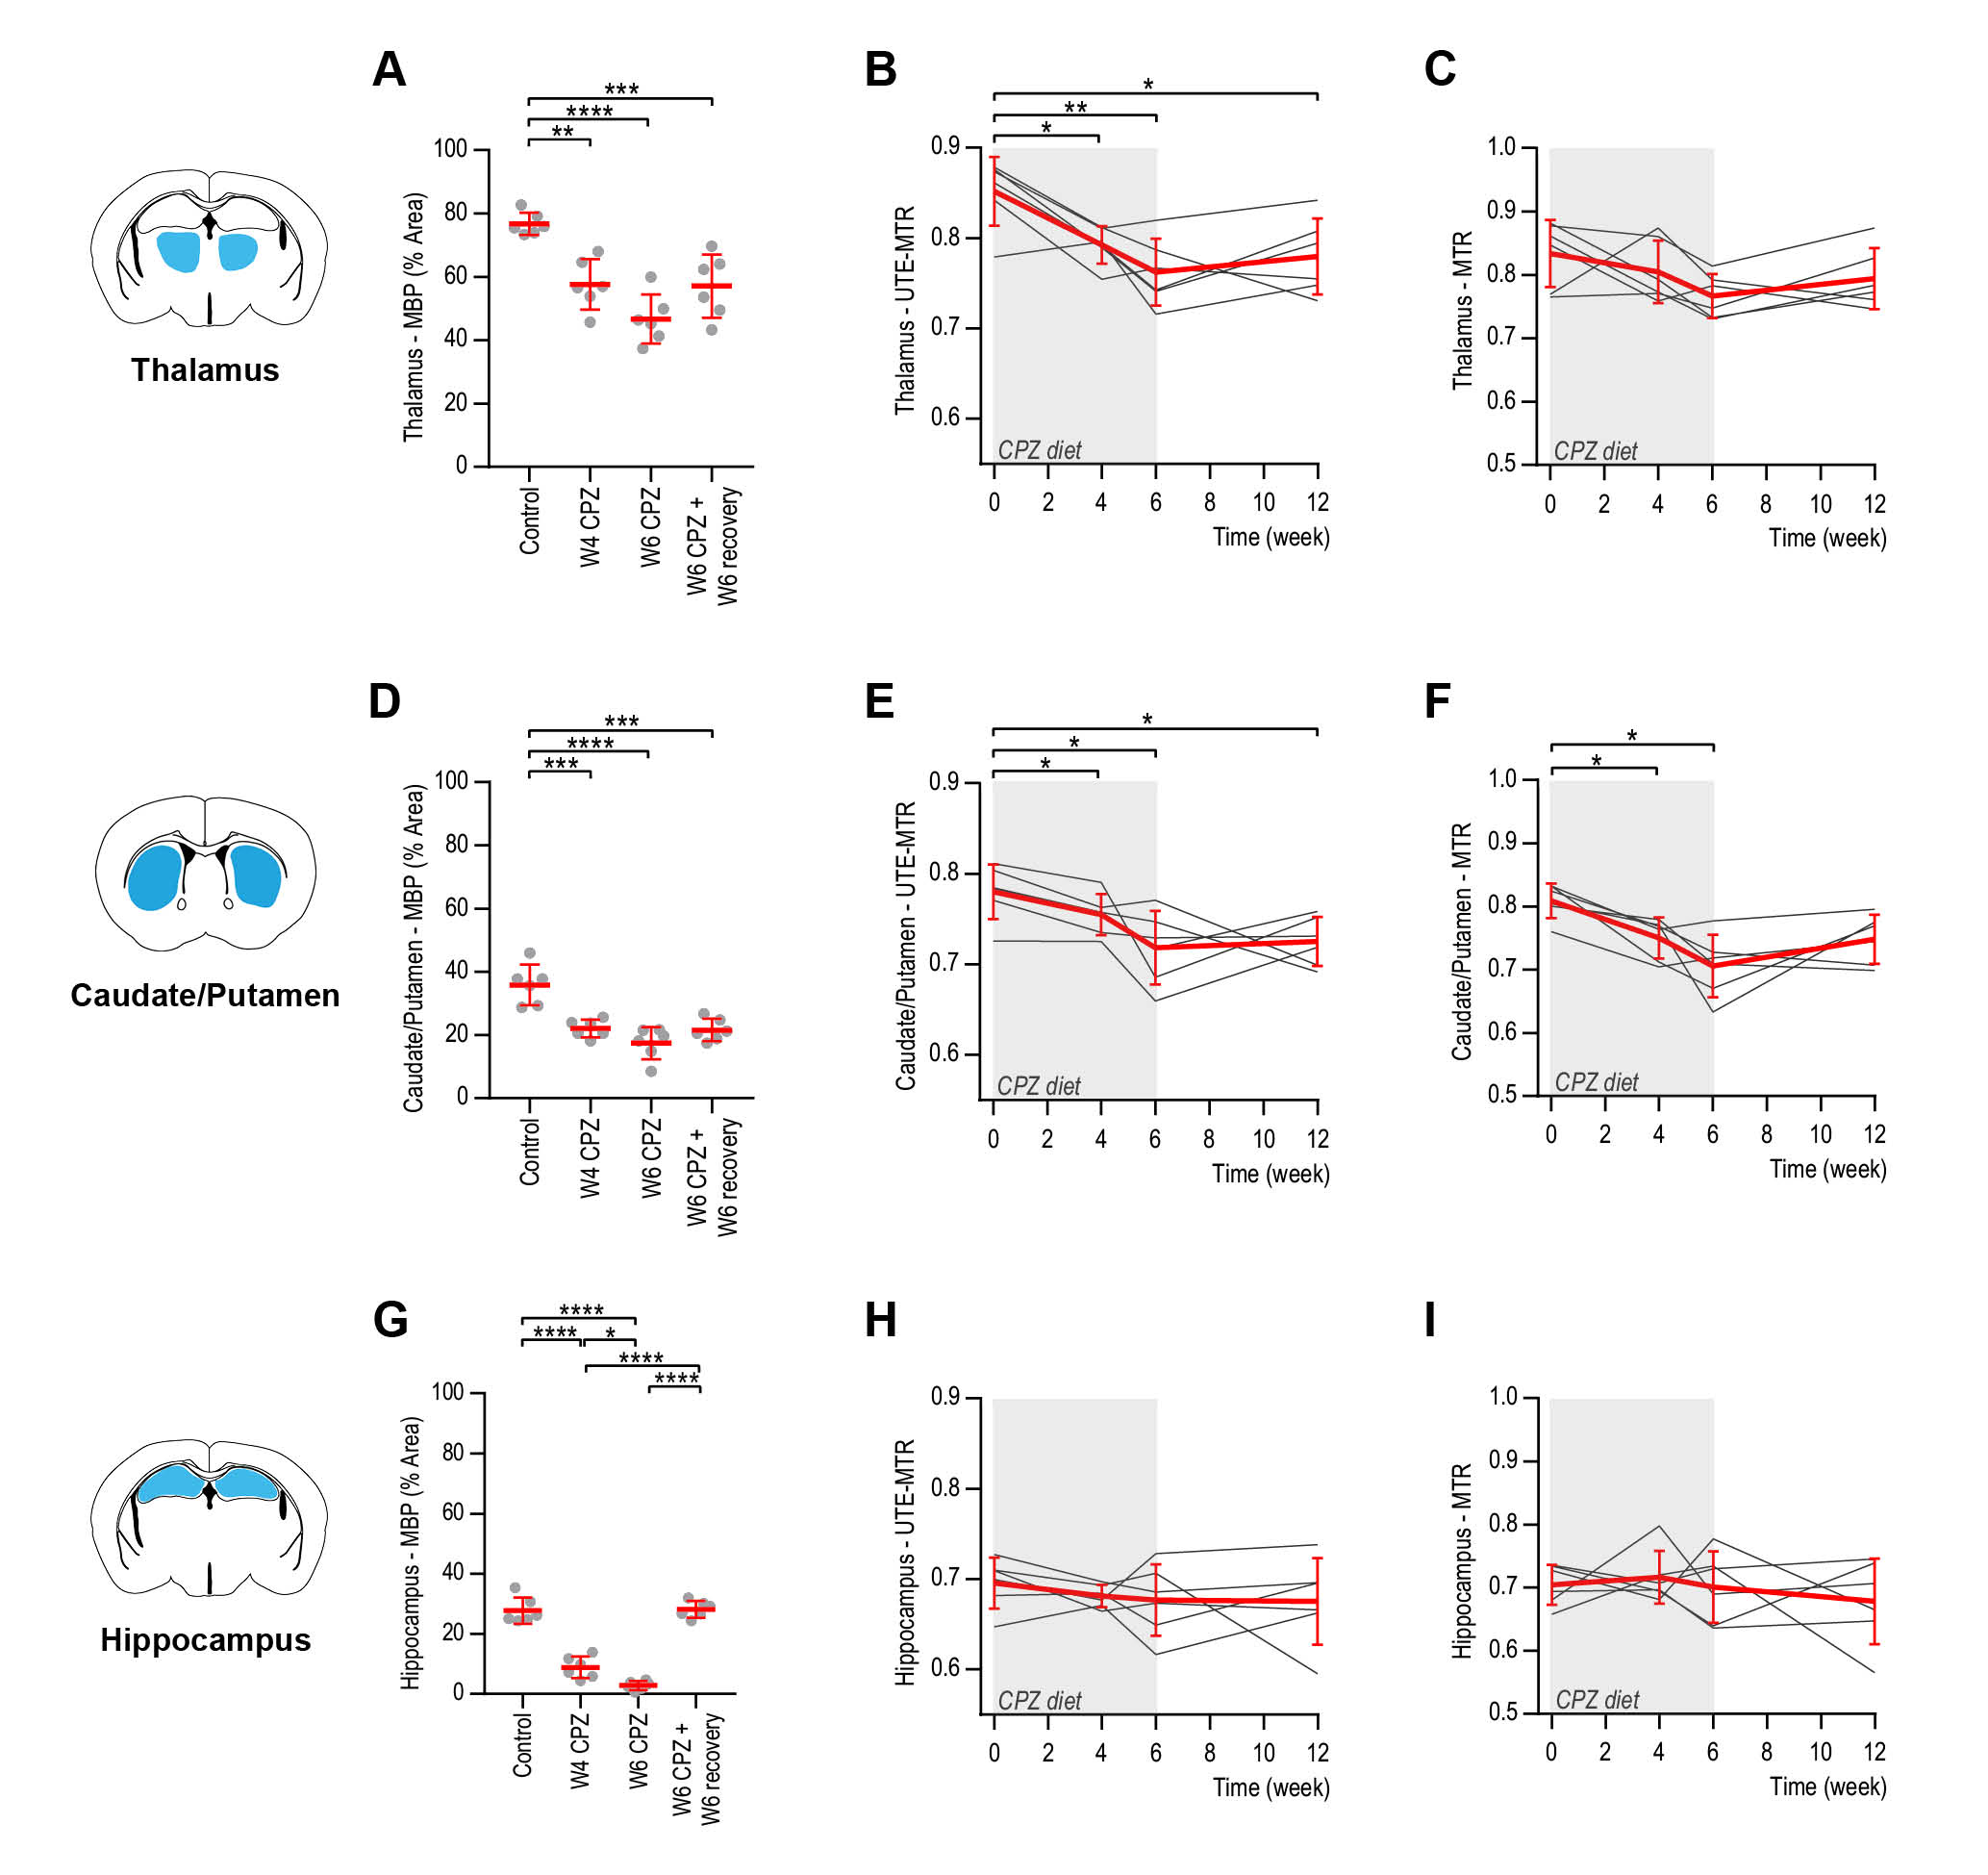
In the subcortical areas, myelin levels were decreased following CPZ diet and recovery (p≤0.0017 thalamus, p≤0.0003 caudate/putamen). UTE-MTR were decreased in thalamus and caudate/putamen (p≤0.0477, p≤0.0490, respectively). MTR was decreased only in the caudate/putamen. No changes were detected for the hippocampus despite demyelination (Figure 3).
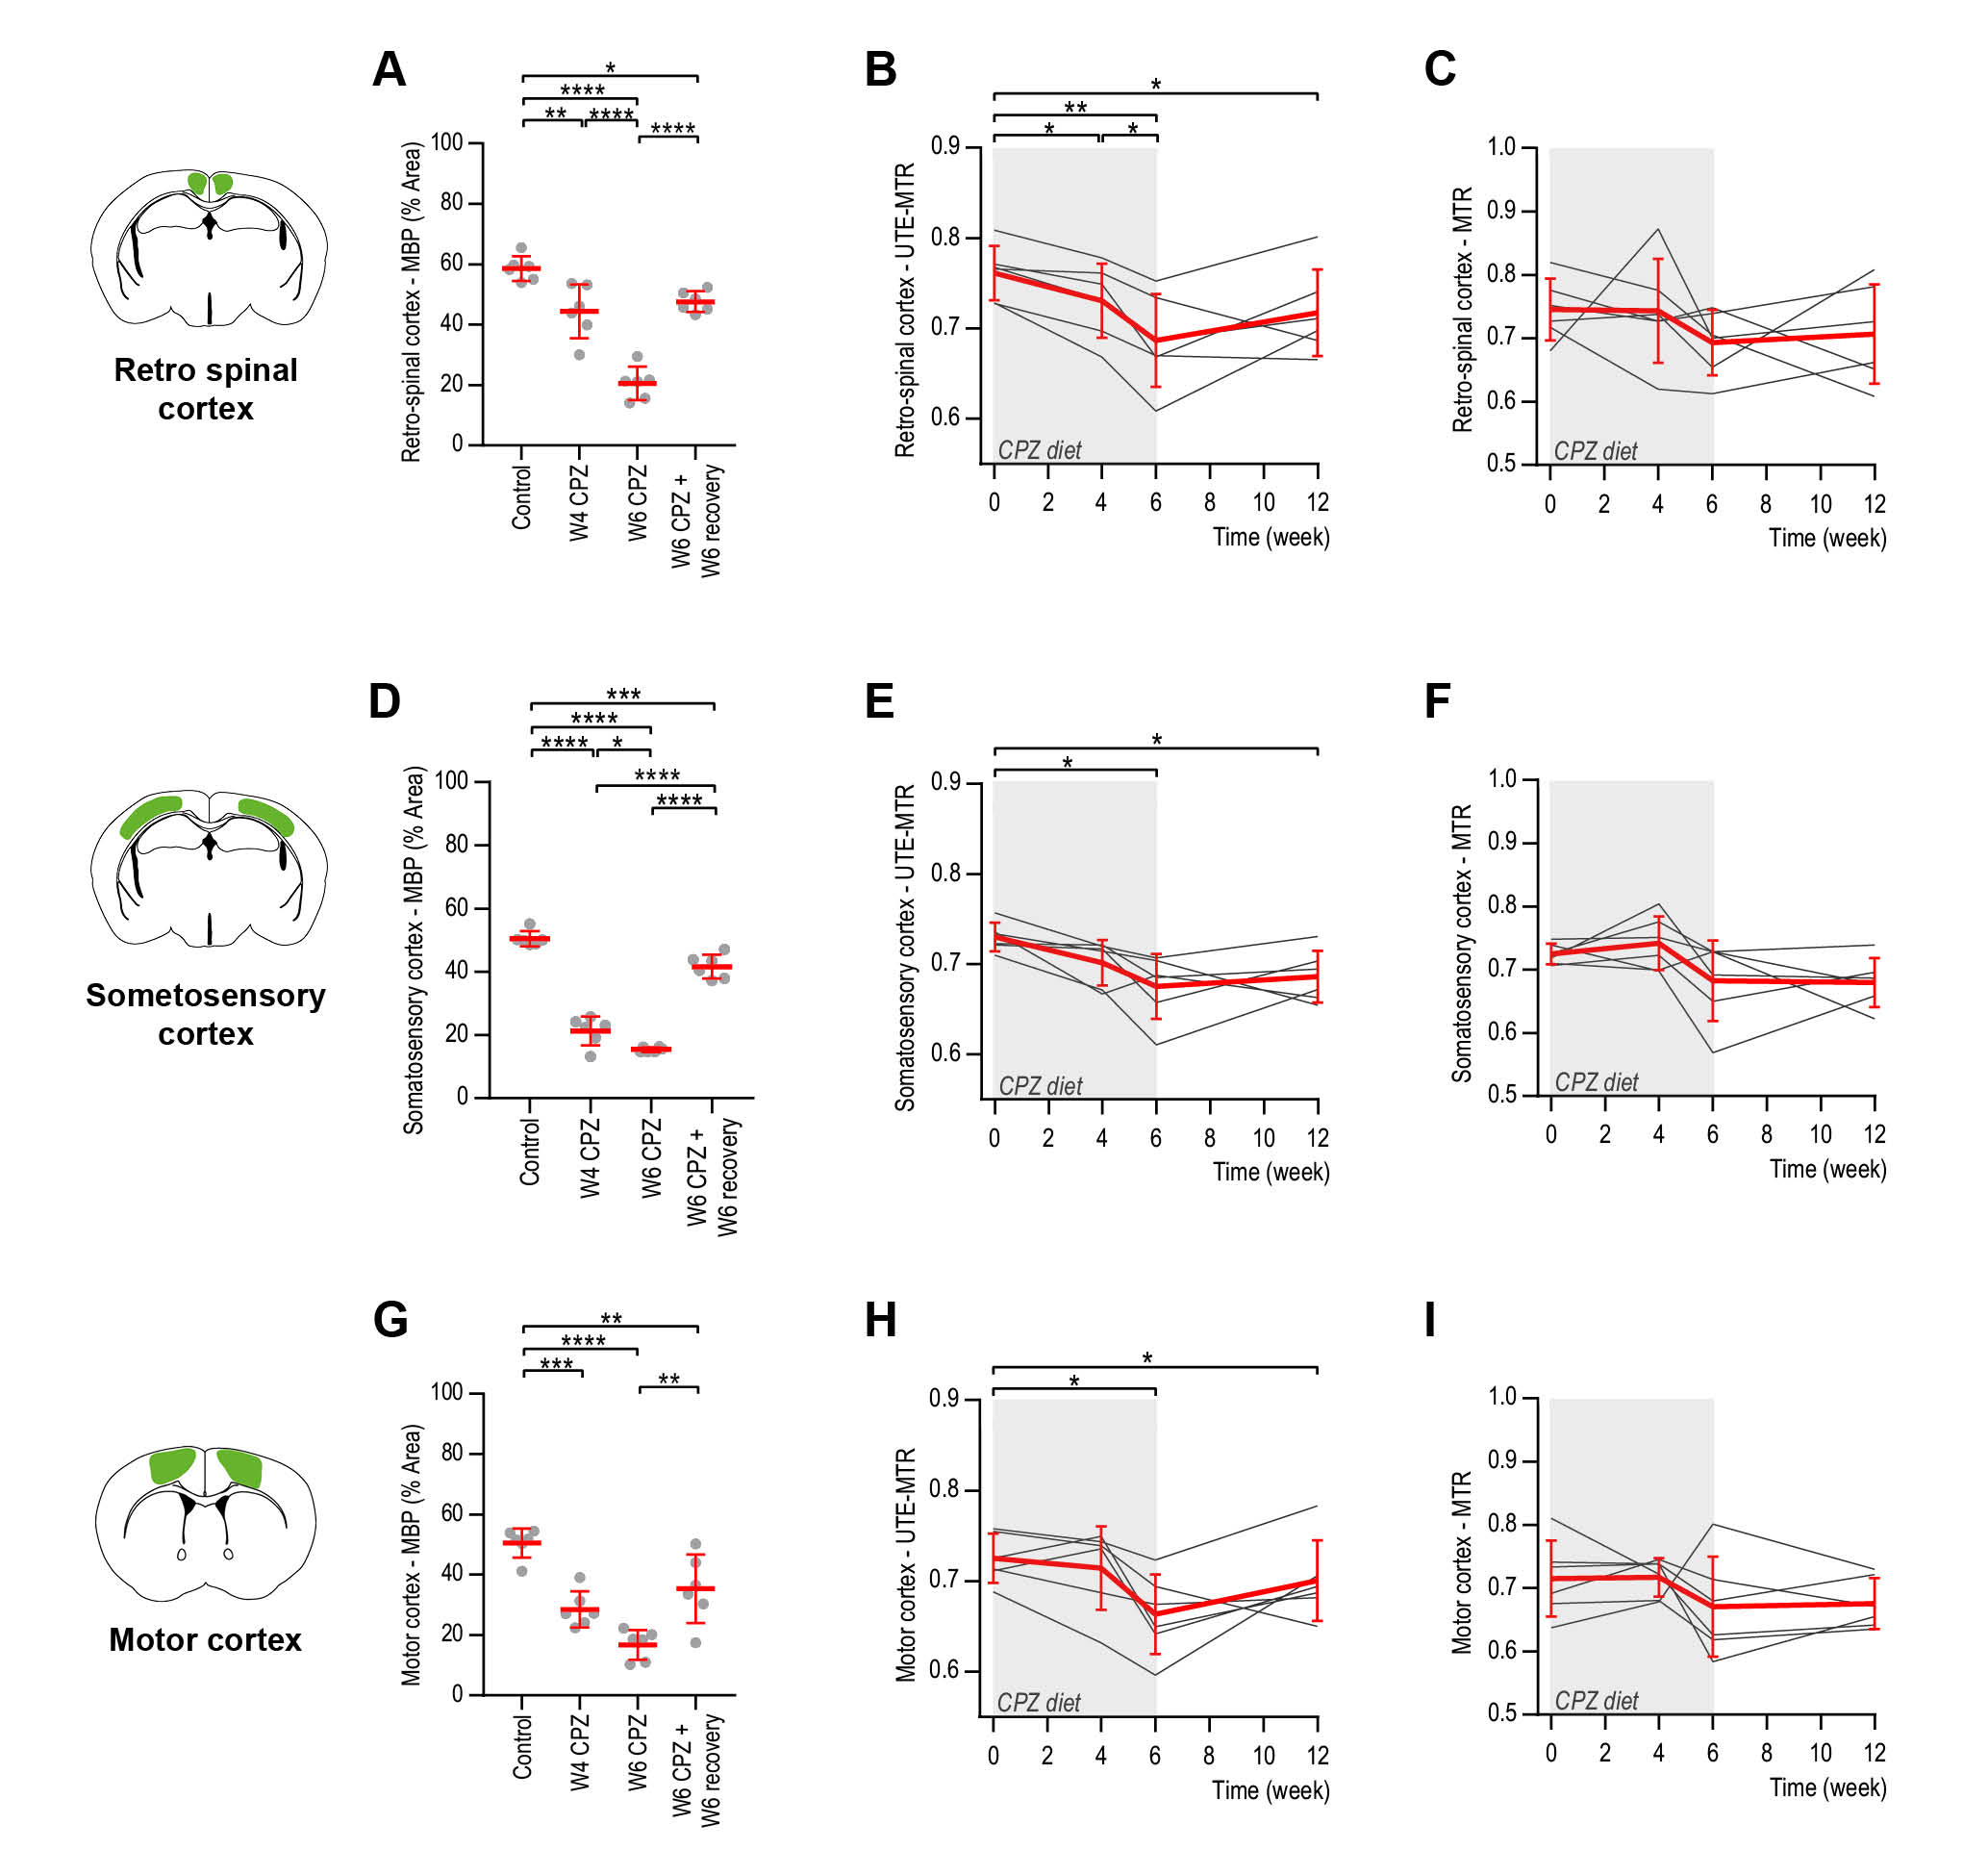
In the cortical areas, severe demyelination was observed, reaching its maximum at W6 CPZ (p<0.0001). Only UTE-MTR were decreased following CPZ administration. Interestingly, UTE-MTR remained lower after recovery, indicating long-lasting changes (Figure 4).
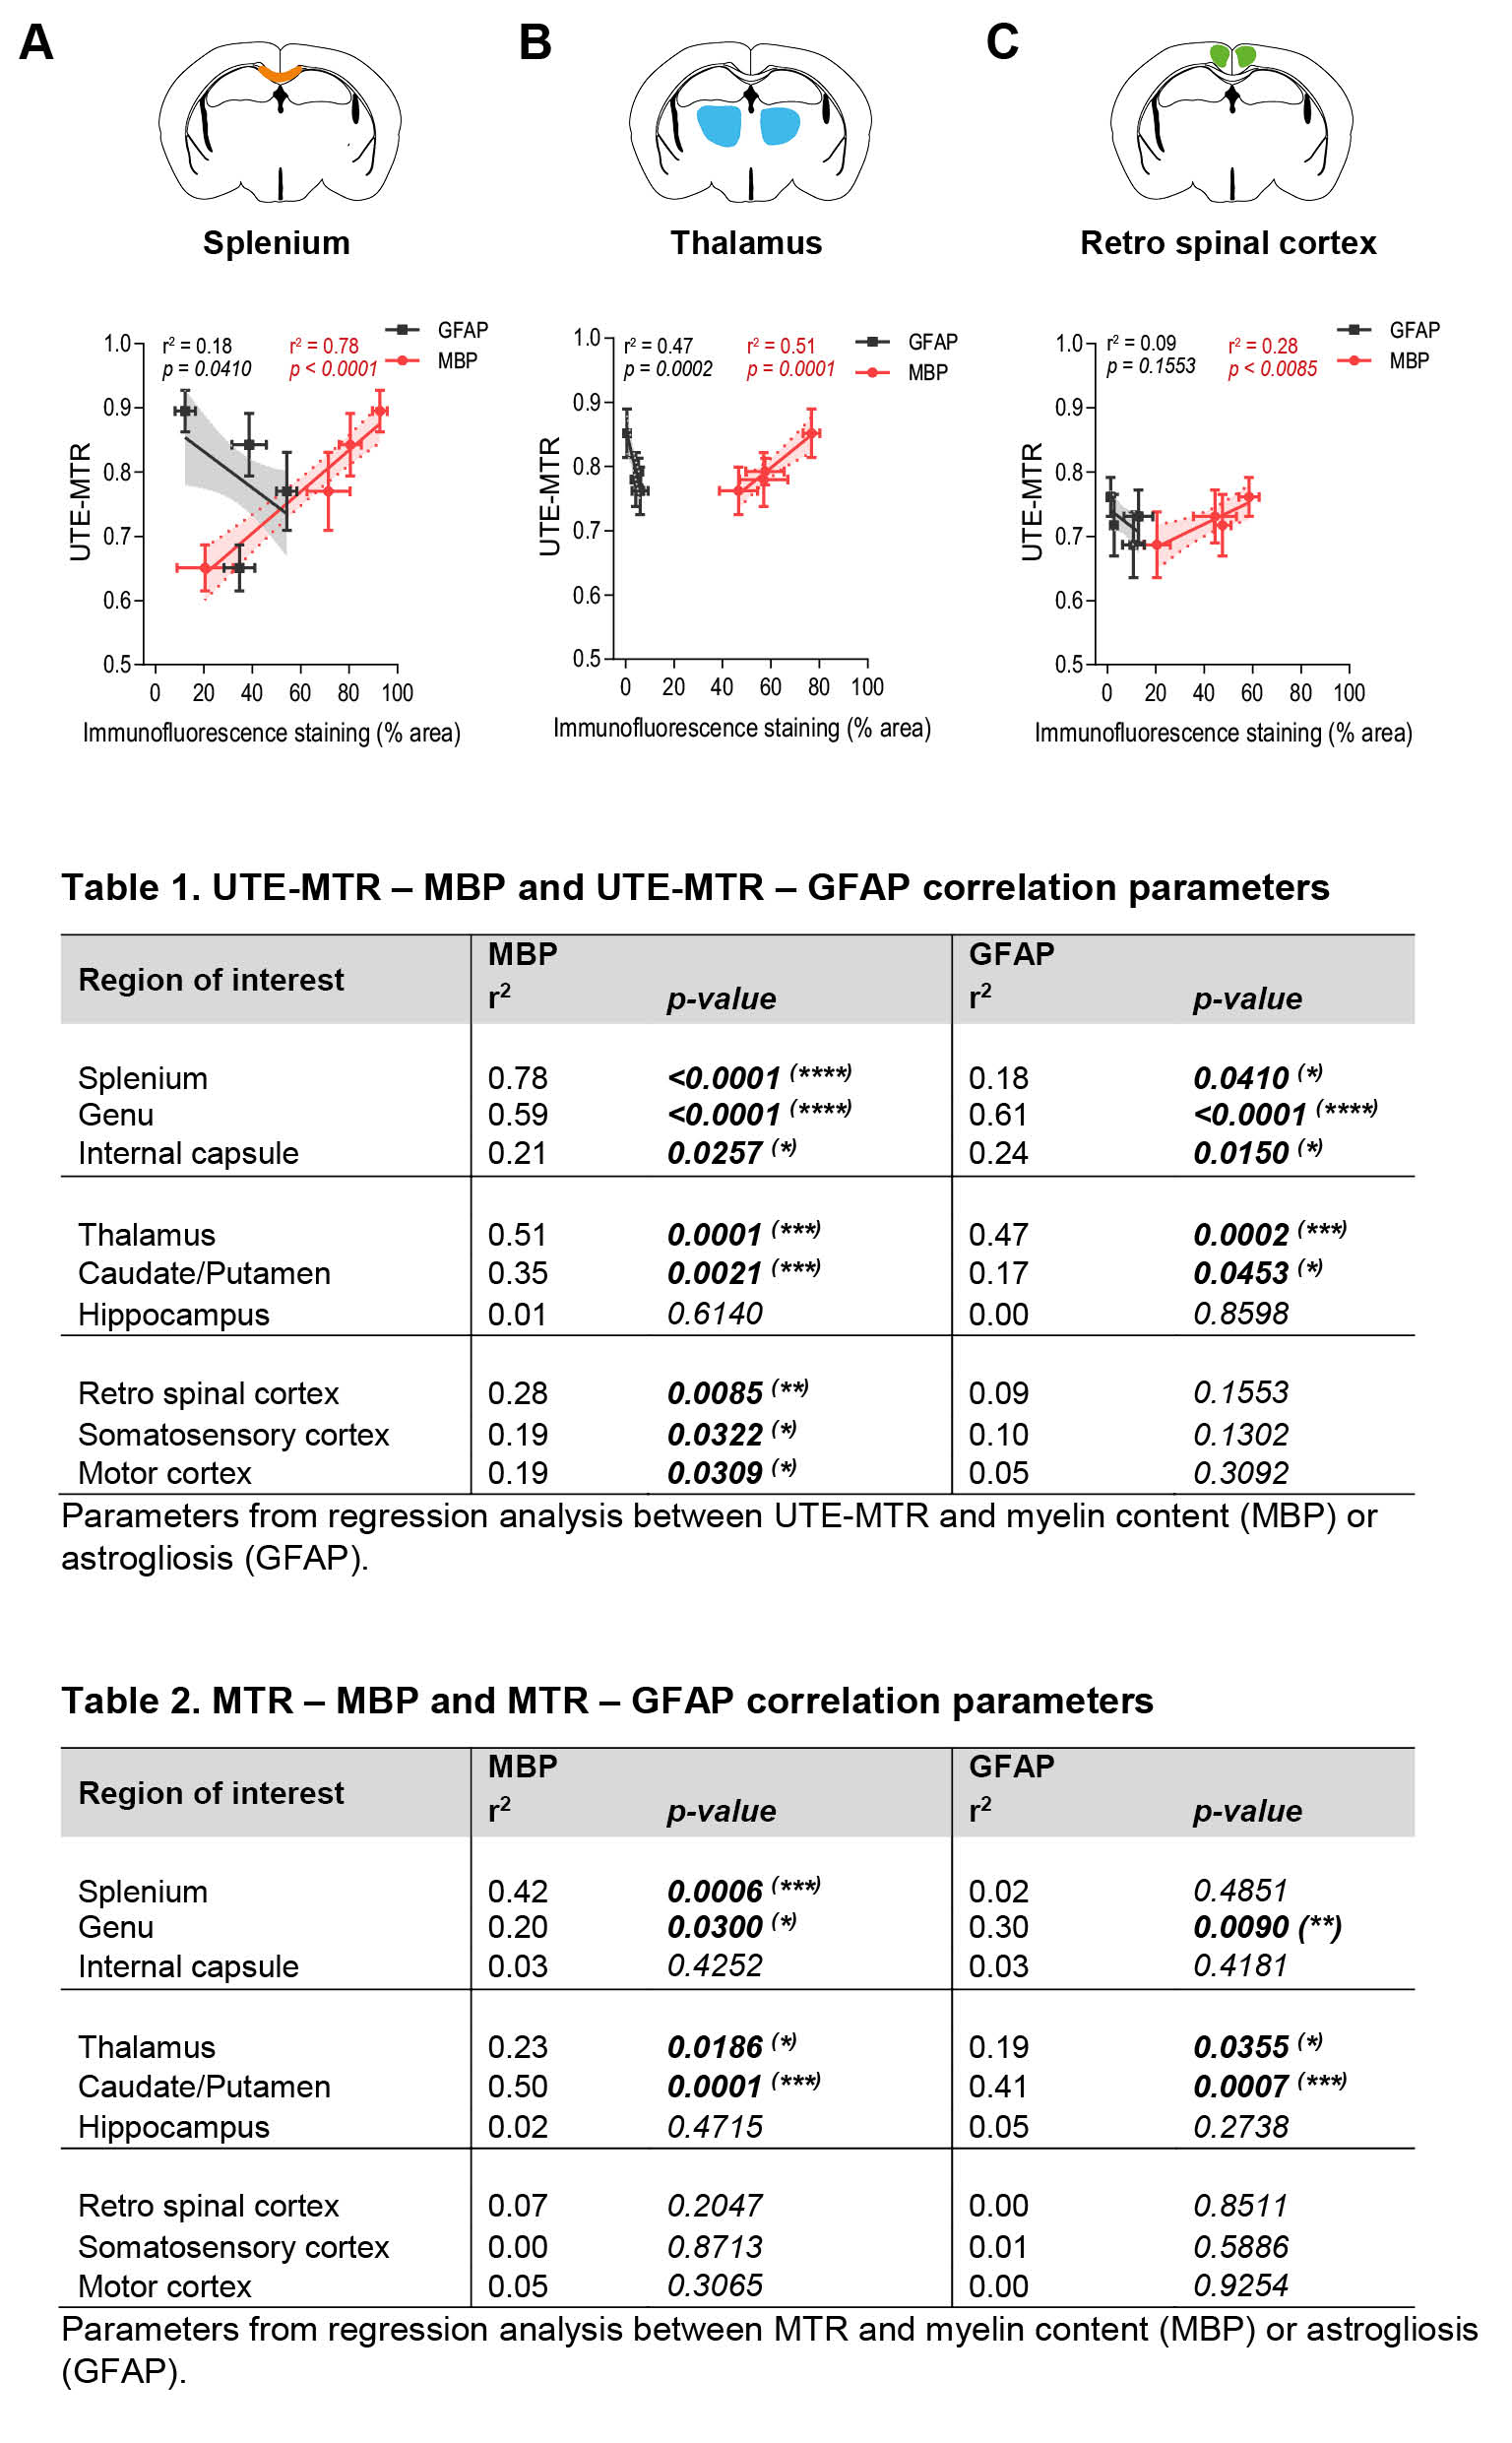
Last, we evaluated the association of UTE-MTR with the underlying tissue pathology (Figure 5). A significant correlation was observed between UTE-MTR and MBP for white matter (r2=0.21-0.78), subcortical (r2=0.35-0.51) and cortical (r2=0.19-0.28) regions. In contrast, UTE-MTR were correlated to GFAP only in white matter (r2=0.18-0.61) and subcortical areas (r2=0.17-0.47) (Figure 5, Table 1).
MTR were correlated to MBP and GFAP in white matter (r2=0.2-0.42 and r2=0.3, respectively), and subcortical areas (r2=0.23-0.5, r2=0.19-0.41, respectively) (Figure 5, Table 2).
Discussion
We demonstrated that UTE-MTR and MTR changes correlated with myelin loss, and to a lesser extent gliosis. The UTE-MTR contrast can be a combination of direct saturation of bound protons in the myelin membranes detectable by UTE12 and indirect MT effect on free water protons. We speculate that the major contribution comes from indirect MT saturation since we measured bound myelin protons T2*≈0.2ms in vivo at 7T and is thus challenging to image. The UTE-MTR has an advantage over MTR because it is more sensitive to MT saturation of the myelin water.
Altogether, we showed that UTE-MT imaging can detect brain tissue alterations in white and grey matter that correlate with changes in myelination, thus appearing as a clinically translatable sequence that may improve characterization of damaged brain tissue in neurological disorders.
Acknowledgements
This work was supported by research grants: NIH R21NS089004, R01NS102156, NMSS research grants PP3360 and RG-1701-26630, fellowship from the NMSS (FG-1507-05297) and from the Flemish Institute for Science and Technology.References
- 1. Reich, D. S., Lucchinetti, C. F. & Calabresi, P. A. Multiple Sclerosis. N Engl J Med 378, 169-180, doi:10.1056/NEJMra1401483 (2018).
- 2. Filippi, M. et al. MRI criteria for the diagnosis of multiple sclerosis: MAGNIMS consensus guidelines. Lancet Neurol 15, 292-303, doi:10.1016/S1474-4422(15)00393-2 (2016).
- 3. Traboulsee, A. et al. Revised Recommendations of the Consortium of MS Centers Task Force for a Standardized MRI Protocol and Clinical Guidelines for the Diagnosis and Follow-Up of Multiple Sclerosis. AJNR Am J Neuroradiol 37, 394-401, doi:10.3174/ajnr.A4539 (2016).
- 4. Chang, E. Y. et al. Ultrashort echo time magnetization transfer (UTE-MT) imaging of cortical bone. NMR Biomed 28, 873-880, doi:10.1002/nbm.3316 (2015).
- 5. Du, J., Takahashi, A. M., Bydder, M., Chung, C. B. & Bydder, G. M. Ultrashort TE imaging with off-resonance saturation contrast (UTE-OSC). Magn Reson Med 62, 527-531, doi:10.1002/mrm.22007 (2009).
- 6. Wei, H. et al. MRI gradient-echo phase contrast of the brain at ultra-short TE with off-resonance saturation. Neuroimage 175, 1-11, doi:10.1016/j.neuroimage.2018.03.066 (2018).
- 7. Carl, M., Ma, Y. & Du, J. Theoretical analysis and optimization of ultrashort echo time (UTE) imaging contrast with off-resonance saturation. Magn Reson Imaging 50, 12-16, doi:10.1016/j.mri.2018.03.002 (2018).
- 8. Hodgson, R. J. et al. Quantitative magnetization transfer ultrashort echo time imaging of the Achilles tendon. Magn Reson Med 65, 1372-1376, doi:10.1002/mrm.22715 (2011).
- 9. Praet, J., Guglielmetti, C., Berneman, Z., Van der Linden, A. & Ponsaerts, P. Cellular and molecular neuropathology of the cuprizone mouse model: clinical relevance for multiple sclerosis. Neurosci Biobehav Rev 47, 485-505, doi:10.1016/j.neubiorev.2014.10.004 (2014).
- 10. Matsushima, G. K. & Morell, P. The neurotoxicant, cuprizone, as a model to study demyelination and remyelination in the central nervous system. Brain Pathol 11, 107-116 (2001).
- 11. Nathoo, N., Yong, V. W. & Dunn, J. F. Understanding disease processes in multiple sclerosis through magnetic resonance imaging studies in animal models. Neuroimage Clin 4, 743-756, doi:10.1016/j.nicl.2014.04.011 (2014).
- 12. Boucneau, T. et al. In vivo characterization of brain ultrashort-T2 components. Magn Reson Med 80, 726-735, doi:10.1002/mrm.27037 (2018).
Figures