0540
CEST MRI with distribution-based analysis for assessment of early stage disease activity in a multiple sclerosis mouse model1Russell H. Morgan Dept. of Radiology and Radiological Science, Johns Hopkins University, Baltimore, MD, United States, 2Dept. of Neurology, Hainan General Hospital, Haikou, China, 3Cellular Imaging Section, Institute for Cell Engineering, Johns Hopkins University, Baltimore, MD, United States, 4Dept. of Information Sciences and Technology, Northwest University, Xi'an, China
Synopsis
Imaging biomarkers that can detect pathological alterations earlier in multiple sclerosis (MS) progression may enable earlier intervention and improved therapeutic efficacy of available treatments. Here we assessed disease manifestations at an early stage using CEST MRI in a preclinical MS model with histogram-guided analysis. The analysis method is simple-to-execute and robust for evaluation of diseases with subtle changes that lack a priori knowledge of abnormal regions of interest (ROIs) and have multiple potentially contributing offsets. We demonstrated that CEST Z-spectra signals at 1 and 2 ppm are potential MRI biomarkers for detecting early and subtle pathological changes in EAE mice.
Introduction
Multiple sclerosis (MS) is an autoimmune disorder that targets the myelin proteins ensheathing nerves, yet often results in severe and irreversible disability. Current imaging methods detect damage after immunological attack. New imaging biomarkers that can detect pathological alterations earlier in the disease process can enable earlier intervention and improved therapeutic efficacy of available treatments. Chemical exchange saturation transfer (CEST) MRI can detect molecular changes in the brain during the disease course. Recently, amide proton CEST MRI and glutamate-sensitive CEST MRI were performed to study white matter and gray matter abnormalities in MS at 7.0 Tesla. Although differences could be observed visually in these pioneering studies, limitations in methods available to quantitatively evaluate visual information gained in MRI and correlate them to pathological events remains a persistent barrier to their development for clinical use. Here, we investigate methods to analyze the subtle changes in the “normal appearing” tissue at an early stage before symptom onset, using a mouse model of experimental autoimmune encephalomyelitis (EAE).Methods
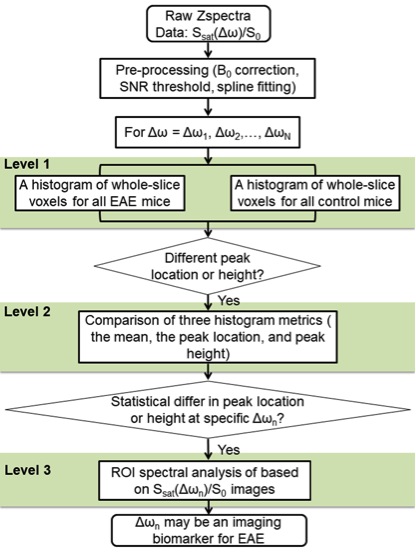
MOG35-55 and pertussis toxin were used to induce EAE in C57BL/6 mice (n = 4). Age-matched C57B1/6 mice were used as naïve controls (n = 4). Disease progression was monitored daily. MRI evaluation of the hindbrain was performed on day 6 post induction of EAE (DPI 6) using an 11.7 Tesla small animal scanner. A three-level distribution (histogram)-based method was used for analysis of CEST signal intensity (Ssat/S0) (Fig. 1), to extract the most contributing components from the all acquired offset frequencies (Δωn). Then, Z-spectra and asymmetric analysis of the bilateral cerebellums and brain stems were plotted for the two groups at selected offsets were conducted. Immune cell presence (microglia/macrophages) in these regions was evaluated immediately after MRI scanning using immunofluorescence.Results and Discussion
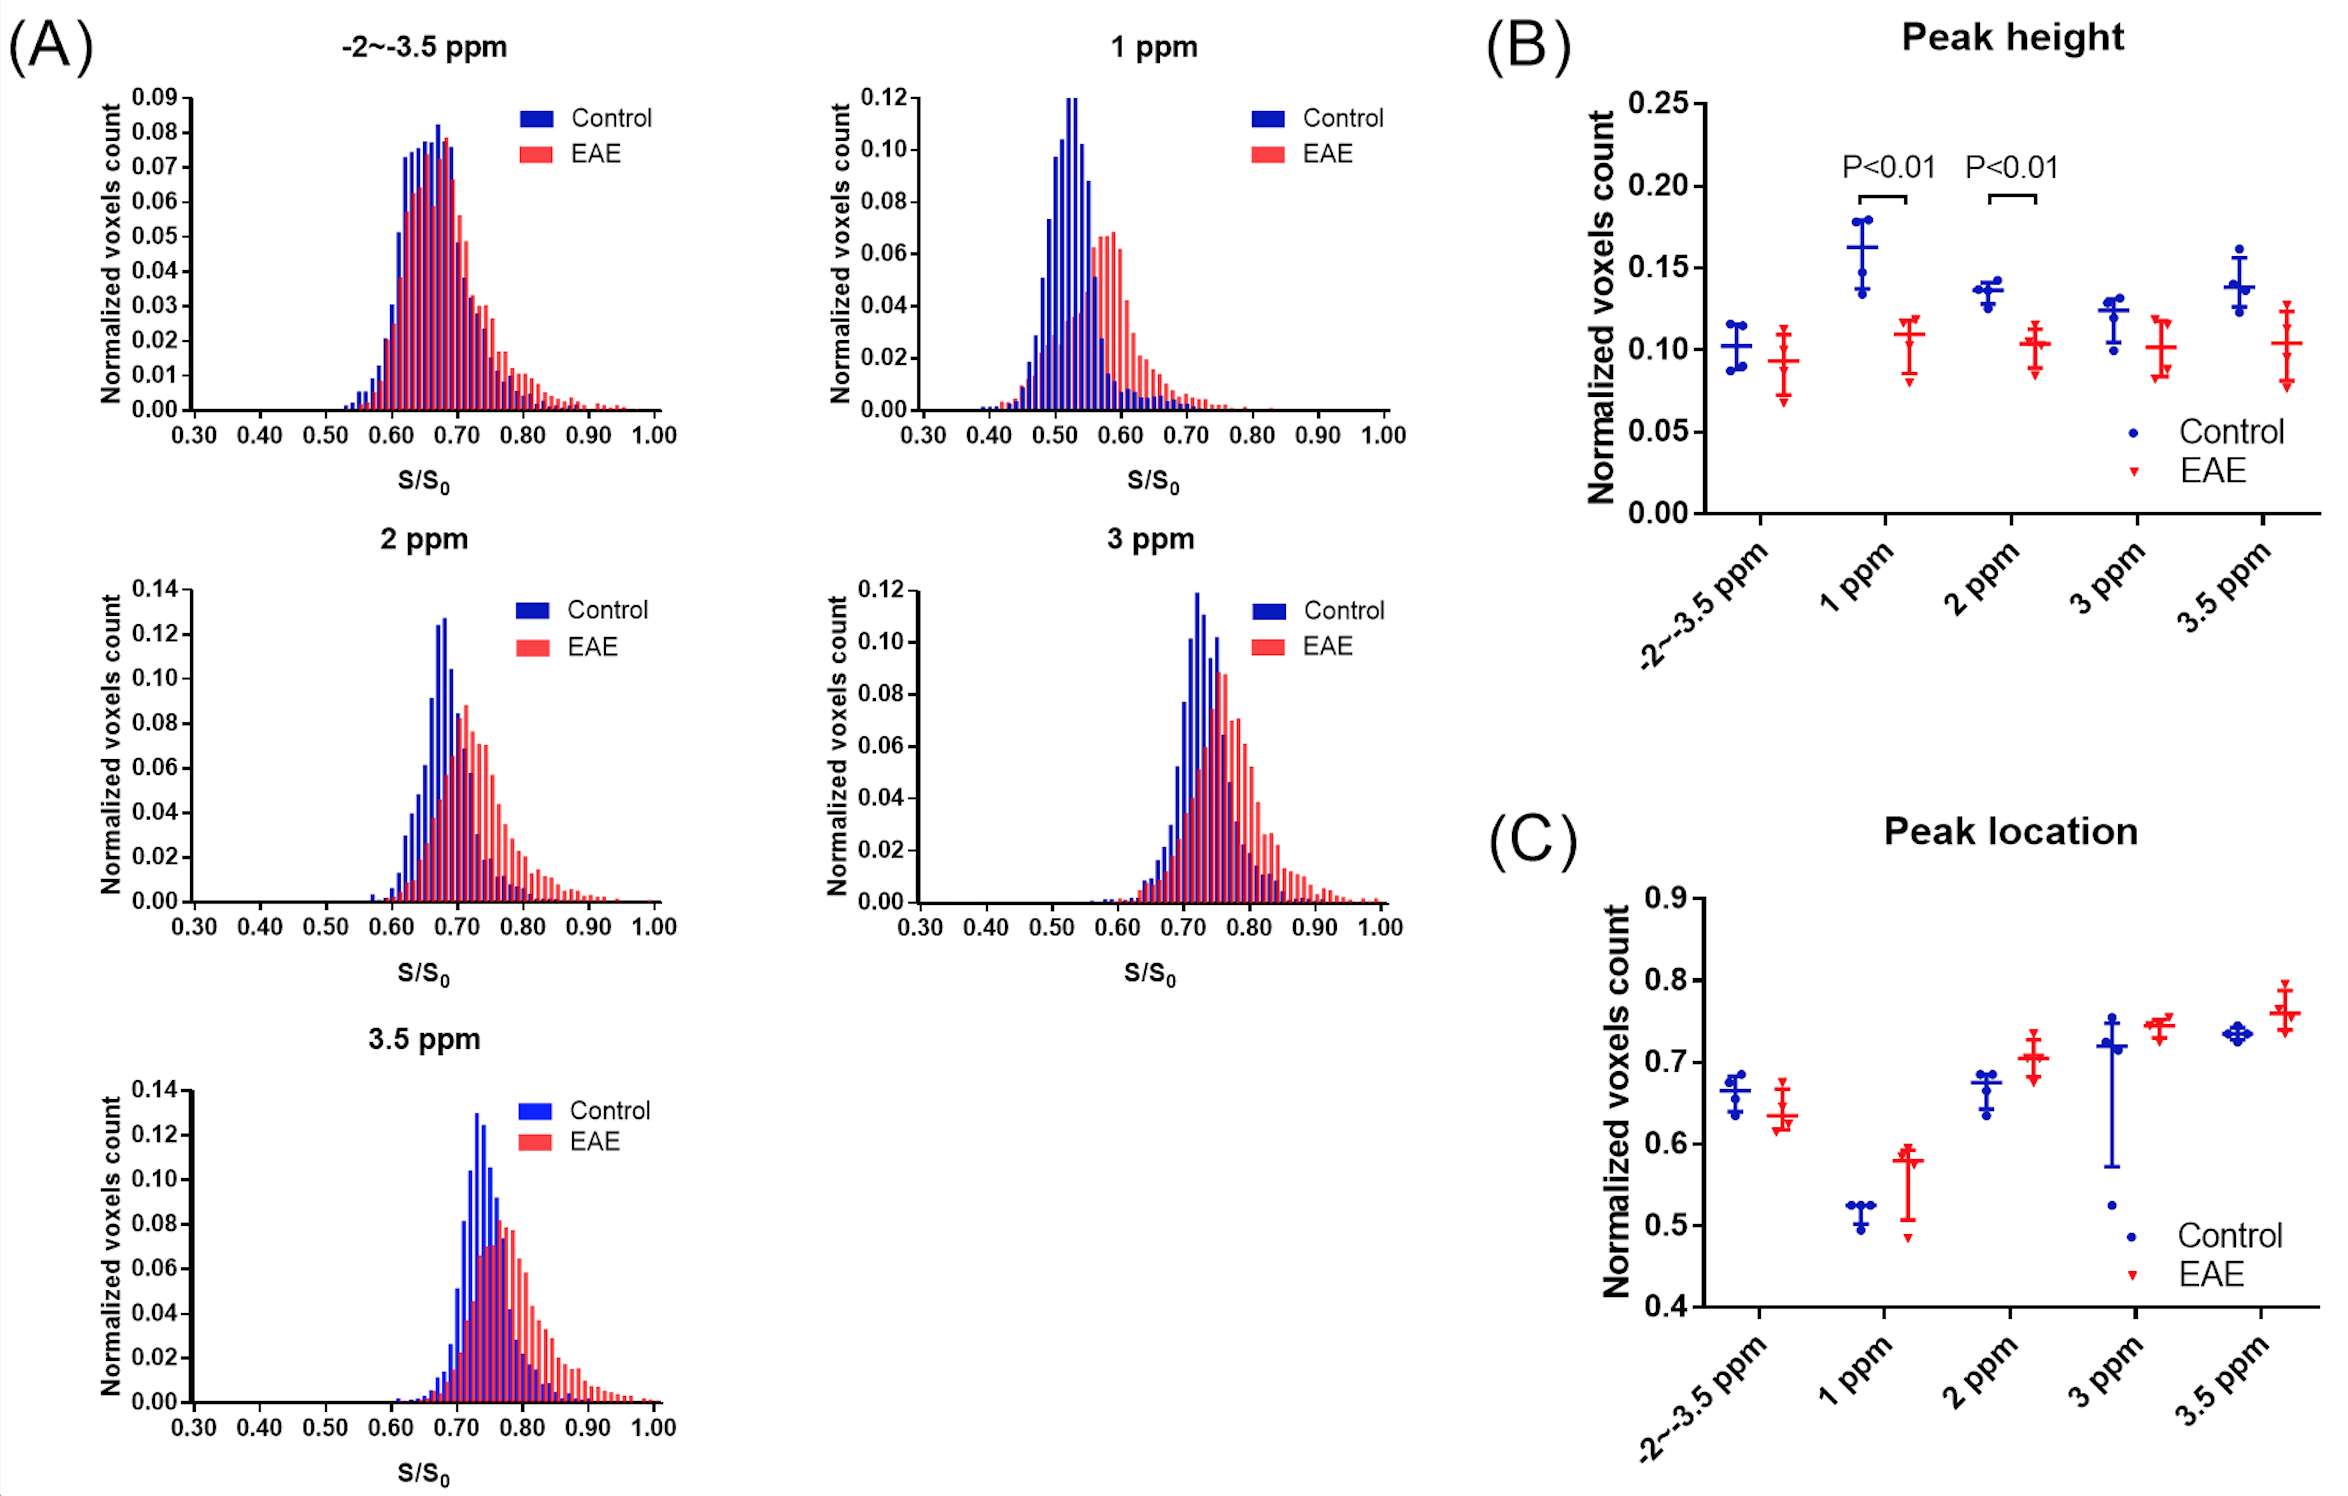
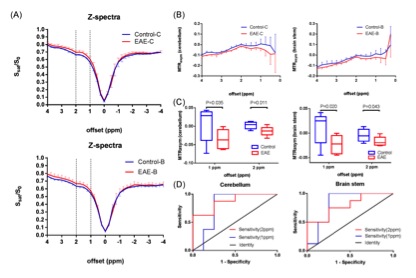
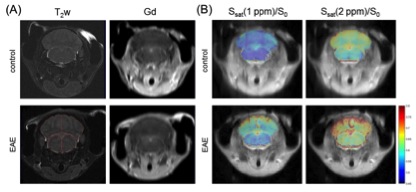
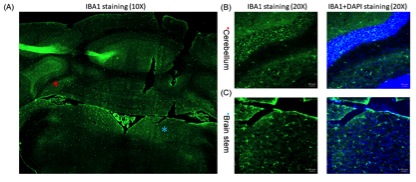
The two overall histograms comparing EAE mice (pooled, n = 4) and naïve mice (pooled, n = 4) revealed readily identifiable differences in CEST signal (Ssat/S0) distribution, i.e. peak height and peak location (Figure 2A). Statistical analysis of individual histograms indicated that peak heights of Ssat/S0 were significantly lower in the EAE group than that of the control group, at saturation offsets (Δω) of 1 ppm and 2 ppm (Fig. 2). ROI-based Z-spectral and MTRasym analysis were performed as well (Fig. 3). The average Ssat/S0 was higher in EAE cerebella at 1 ppm and at 2 ppm. Increased Ssat/S0 within the brainstem was also observed at 2 ppm in the EAE group when compared to controls. The mean MTRasym in the cerebellum of the EAE group was significantly lower than that of the controls at 1 ppm and at 2 ppm. Also, there was a significant decrease in the mean MTRasym in the brainstem of the EAE group compared to controls at 1 ppm and at 2 ppm. The potential of Ssat(1 ppm)/S0 and Ssat(2 ppm)/S0 images for assessment of EAE was supported by ROC analysis of sensitivity and specificity. IBA1-positive cells (microglia/macrophages) were detected using immunofluorescent staining throughout the hindbrain slice, including cerebellum and brainstem (Fig. 4). Using histogram-based analysis, we identified two new offsets among the five typically-studied frequency offsets (or offset ranges) with Ssat/S0 signals exhibiting significant difference between the EAE group and the control group for multiple histogram descriptors (Fig. 5). The CEST contrast at 1 ppm in vivo is sensitive to the exchangeable hydroxyls in myo-Inositol (MI), choline, glucose as well as cell-surface glycoproteins1. MI is often considered a glial marker, with the increased level reflecting glial or astrocytic activation and proliferation2-4. The molecular origin of CEST signal at 2 ppm in rat brain is typically attributed to creatine (Cr) with a relatively minor contribution by arginine1, 5. A study in tissue homogenates of rat brain indicated that CEST at 2 ppm decreases to roughly 34% of its value after Cr was removed via dialysis5. Upon activation the metabolism of microglia is altered, resulting in increased release of MI and Cr, and an acidic microenvironment6, 7, which may have contributed to the elevated CEST signals.Conclusion
The proposed histogram-based method provides a simple and effective workflow in analyzing CEST MRI data, which does not require a priori knowledge of damage location or contributing offset components. The histograms of CEST MRI signal at 1 and 2 ppm were sensitive to the subtle pathological changes in the EAE mouse, before symptom onset and formation of MRI-visibly apparent lesions (~ DPI 11-14). CEST-MRI has potential as an imaging biomarker complementary to functional and physiological MRI measures.Acknowledgements
NIH R21 020905References
1. Lee JS, Xia D, Jerschow A and Regatte RR. In vitro study of endogenous CEST agents at 3 T and 7 T. Contrast media & molecular imaging. 2016; 11: 4-14.
2. Srinivasan R, Sailasuta N, Hurd R, Nelson S and Pelletier D. Evidence of elevated glutamate in multiple sclerosis using magnetic resonance spectroscopy at 3 T. Brain : a journal of neurology. 2005; 128: 1016-25.
3. Matthews PM and Datta G. Positron-emission tomography molecular imaging of glia and myelin in drug discovery for multiple sclerosis. Expert opinion on drug discovery. 2015; 10: 557-70.
4. Ciccarelli O, Barkhof F, Bodini B, et al. Pathogenesis of multiple sclerosis: insights from molecular and metabolic imaging. The Lancet Neurology. 2014; 13: 807-22.
5. Zhang XY, Xie J, Wang F, et al. Assignment of the
molecular origins of CEST signals at 2 ppm in rat brain. Magnetic resonance in medicine : official journal of the Society of
Magnetic Resonance in Medicine / Society of Magnetic Resonance in Medicine.
2017; 78: 881-7.
6. Moccia M and Ciccarelli O. Molecular and Metabolic
Imaging in Multiple Sclerosis. Neuroimaging
clinics of North America. 2017; 27: 343-56.
7. de Ceglia R, Chaabane L, Biffi E, et al. Down-sizing of neuronal network activity and density of presynaptic terminals by pathological acidosis are efficiently prevented by Diminazene Aceturate. Brain, behavior, and immunity. 2015; 45: 263-76.
Figures