0539
Non-contrast assessment of BBB permeability using WEPCAST MRI: validation with contrast-agent based method1Department of Radiology, Johns Hopkins University, Baltimore, MD, United States, 2Department of Biomedical Engineering, Johns Hopkins University, Baltimore, MD, United States, 3Department of Radiation Oncology, St. Jude Children's Research Hospital, Memphis, TN, United States
Synopsis
Water-extraction-with-phase-contrast-arterial-spin-tagging (WEPCAST) MRI was recently proposed for non-contrast assessment of blood-brain barrier (BBB) permeability to water. However, this approach has not been directly compared with contrast-based method. In this study, we used Gd-based MRI method to validate the WEPCAST MRI. Two methods provide consistent results, suggesting that WEPCAST MRI has a potential to become an alternate to clinical contrast-based BBB permeability assessment.
INTRODUCTION
Assessment of blood-brain barrier (BBB) permeability is important in many brain disorders. Conventional MRI approaches to image BBB permeability require the use of Gd contrast agent, which limits its clinical application, especially in diseases for which contrast agent is not routinely used or not desired, such as Alzheimer’s disease, psychiatric disorders, and pediatric populations. Water-extraction-with-phase-contrast-arterial-spin-tagging (WEPCAST) MRI was recently proposed as a novel non-contrast technique to measure blood-brain barrier (BBB) permeability1, by selectively measuring arterial spin labeling (ASL) signals in venous vessels (thereby evaluating the rate of water exchange across BBB). However, this approach has not been directly compared with contrast-based method. Here we sought to validate WEPCAST MRI by comparing its results with those from Gd-based MRI.METHODS
MRI experiments
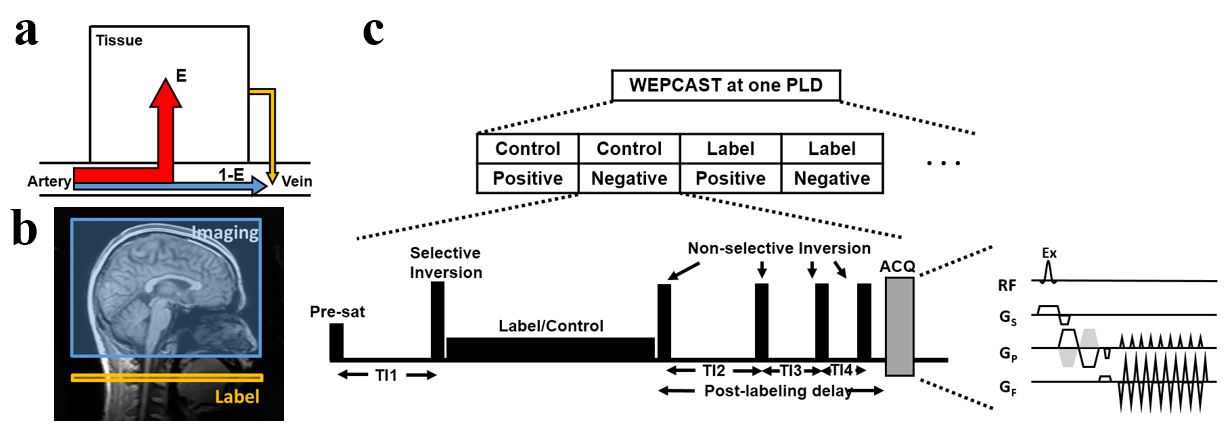
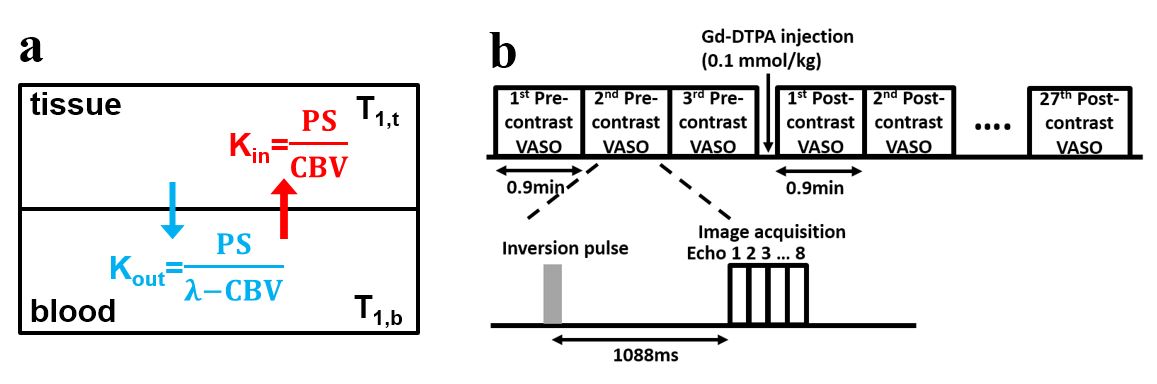
Six healthy subjects (33.5±14.7years, 5F) were studied. WEPCAST MRI1 (see Figure 1 for sequence diagram and signal model) was performed in mid-sagittal plane with the following parameters: labeling-duration=2000ms, post-labeling delay=3500ms, encoding velocity (Venc)=15cm/s, followed by a M0 scan with same Venc and a TR=10000ms. In addition, a dynamic contrast-agent scan was performed in which 30 T1-weighted images (multi-echo VASO MRI sequence2) were acquired with contrast agent injection (Prohance, 0.1mmol/kg) taking place at the beginning of the 4th dynamic (see Figure 2 for scan timing illustration and signal model).
WEPCAST MRI data processing
Details of WEPCAST processing can be found in Lin et al1. Briefly, phase-contrast velocity-encoded images (which measure vessel signals only) were collected for control and label conditions (like ASL), and their subtraction yielded arterially labeled signals. ROIs were manually drawn in the superior sagittal sinus (SSS) and the resulting signal was used to quantify water extraction fraction (E). Then BBB permeability, denoted by permeability-surface-area product (PSWEPCAST), is estimated by: $$$PS_{WEPCAST}=-ln(1-E)\times f(mL/100g/min)$$$, where f is global cerebral blood flow (CBF) and is measured by flow-sensitive MRI in the internal carotid and vertebral arteries3.
VASO MRI data processing
The contrast-agent scan used a VASO MRI sequence because the VASO sequence is designed such that the pre-contrast blood signal is 0 while the post-contrast blood signal is at equilibrium when Gd concentration is sufficiently high (e.g.>0.5mM)2. The advantage is that the effect of cerebral blood volume (CBV) and PS can be temporally separated.
The quantitative analysis focused on gray matter (GM) ROI. Initial concentration of Gd was estimated from the T2 difference between pre- and post-contrast images. Gd concentration decay was modeled as bi-exponential function. A two-compartment water exchange model was applied to the VASO signal time course2, and a non-linear fitting yielded the estimation of three physiological parameters: PSVASO,gm, CBV and Gd decay rate. To facilitate the comparison of contrast-agent results with that of WEPCAST MRI which is a global measurement and reflects an average of gray and white matter PS, PSVASO,gm was converted to PSVASO,global using: $$$PS_{VASO,global}=PS_{VASO,gm}\times\frac{V_{gm}}{V_{gm}+V_{wm}}+R\times PS_{VASO,gm}\times\frac{V_{wm}}{V_{gm}+V_{wm}}$$$, where Vgm and Vwm are volumes of gray and white matter, R is the ratio of white matter and gray matter PS and was assumed to be 0.27 based on CBV ratio4.
RESULTS AND DISCUSSION
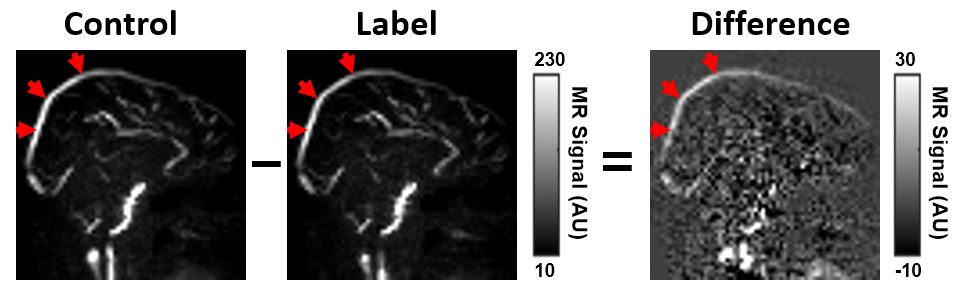
Figure 3 shows representative WEPCAST control, label and difference images from one subject. Because of our phase-contrast flow-encoded acquisition scheme, vessel signals are selectively measured and tissue signals (which reflects perfusion) are successfully suppressed. Based on the signal at SSS, the average PSWEPCAST for six subjects was 135.5±18.1 ml/100g/min.
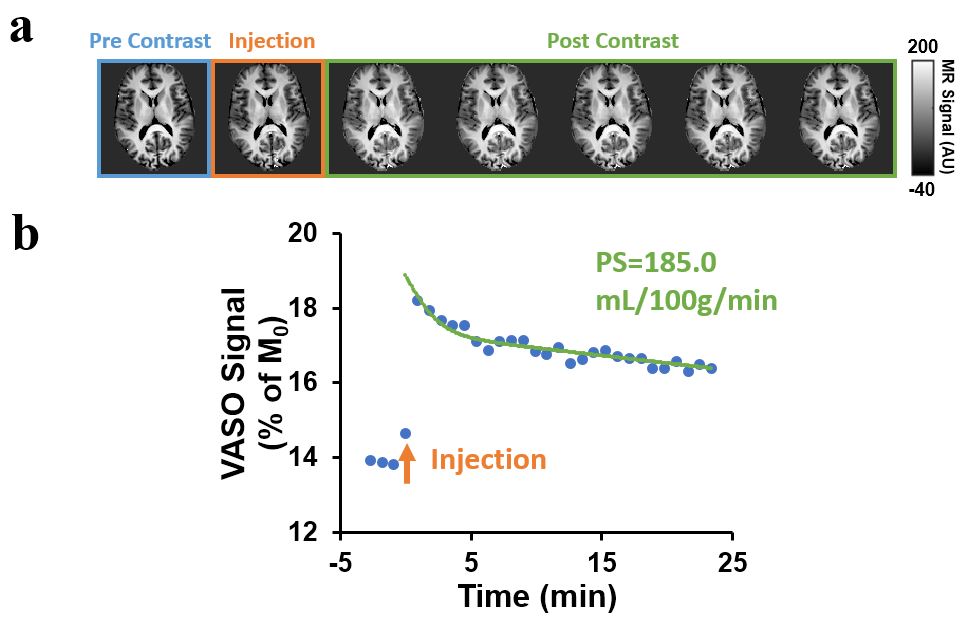
Figure 4a shows dynamic VASO images (pre- and post-contrast) for the same subject as in Figure 3. The time course of gray-matter signal and the corresponding model fitting are shown in Figure 4b. It can be seen that, following Gd injection, VASO signal revealed an immediate increase due to the presence of the contrast agent. As the concentration of the contrast agent decreases with time, the VASO signal revealed a biphasic decay. The early fast decay is primarily attributed to BBB exchange effect, as the CBV effect is not affected by the Gd concentration during this time period. The late-phase slow decay is more attributed to CBV effect since the water exchange contribution becomes lower at later time period2. The model fitting gives an average PSVASO,global of six subjects of 164.3±21.7 ml/100g/min.
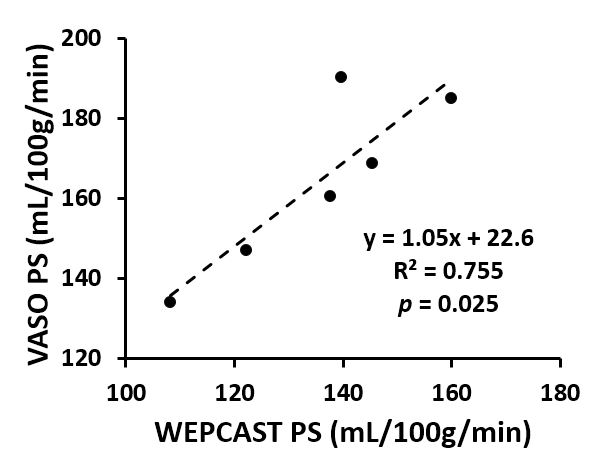
Figure 5 shows a scatter plot between PSWEPCAST and PSVASO,global. It can be seen that WEPCAST MRI showed a strong correlation with Gd-based BBB method (R2=0.75 and p=0.025).
CONCLUSION
In this study, a novel non-contrast BBB technique, WEPCAST MRI, was validated with contrast-agent based method. Results from the two methods revealed a strong correlation across subjects and yielded quantitatively comparable permeability values, suggesting that WEPCAST MRI has the potential to become an alternative technique to contrast-based BBB permeability assessment.Acknowledgements
No acknowledgement found.References
1. Lin Z, Li Y, Su P, Mao D, Wei Z, Pillai JJ, Moghekar A, van Osch M, Ge Y, Lu H. Non-contrast MR imaging of blood-brain barrier permeability to water. Magn Reson Med 2018;80:1507-1520.
2. Uh J, Lewis-Amezcua K, Varghese R, Lu H. On the measurement of absolute cerebral blood volume (CBV) using vascular-space-occupancy (VASO) MRI. Magn Reson Med 2009;61:659-667.
3. Peng SL, Su P, Wang FN, Cao Y, Zhang R, Lu H, Liu P. Optimization of phase-contrast MRI for the quantification of whole-brain cerebral blood flow. J Magn Reson Imaging 2015;42:1126-1133.
4. Lu H, Law M, Johnson G, Ge Y, van Zijl PC, Helpern JA. Novel approach to the measurement of absolute cerebral blood volume using vascular-space-occupancy magnetic resonance imaging. Magn Reson Med 2005;54:1403-1411.
Figures