0537
Prospects for improving neuronal specificity of fMRI with Ferumoxytol: an evaluation of vascular segmentation and cortical depth-dependent analysis1Athinoula A. Martinos Center for Biomedical Imaging, Massachusetts General Hospital, Charlestown, MA, MA, United States, 2Department of Radiology, Harvard Medical School, Boston, MA, United States, 3Division of Hematology, Massachusetts General Hospital, Boston, MA, United States, 4Division of Health Sciences and Technology, Massachusetts Institute of Technology, Cambridge, MA, MA, United States
Synopsis
Ferumoxytol, a superparamagnetic iron oxide nanoparticle, is commonly used as an intravenous treatment for anemia, but has been recently employed as a blood-pool contrast agent for MRI. Here we evaluated Ferumoxytol as a tool to improve the neuronal specificity of fMRI using it for both improved vascular segmentation and for CBV-weighted functional contrast. We employed multi-echo gradient recalled echo (ME-GRE) acquisitions with functional imaging pre and post injection, performed vascular extraction/segmentation, and report apparent quantitative CBV changes surrounding vessels as a function of echo-time. This work demonstrates the possibility of high-resolution CBV mapping, gray- and white-matter angiography, and cortical depth-dependent analyses with this contrast agent.
Introduction
Ferumoxytol is a safe intravenous iron supplement used both for treatment of anemia and as a contrast agent in clinical MRI studies that it provides a long (~12-hour) half-life, strong T1 and T2* shortening, and absence of leakage into surrounding tissues [1]. Moreover, it provides higher resolution and precision for quantitative CBV mapping than classic CBV mapping based on bolus tracking [2-3]. Because agents like Ferumoxytol can sensitize the fMRI experiment to CBV, which has been shown to improve functional CNR and be more specific to neuronal activity than BOLD [4-7], fMRI with Ferumoxytol provides many advantages over conventional fMRI [8-9]. Ferumoxytol has the potential to greatly improve neuronal specificity of fMRI by also providing a means to detect small vessels and measure capillary density to help interpret the fMRI signals. Therefore to evaluate its potential to detect smaller vessels or measure capillary density as a means to improve the neuronal specificity of fMRI, we used Ferumoxytol with fMRI and a multi-echo gradient-recalled echo (MEGRE) at 3T, and demonstrate how it can enhance both vascular and functional imaging performed within a single experimental session.Methods
Three anemic but otherwise healthy volunteers (44$$$\;$$$±$$$\;$$$7$$$\;$$$y.o., 3F) were imaged on a Siemens TimTrio 3T scanner after providing written informed consent, in pre- and post-injection sessions (510$$$\;$$$mg Ferumoxytol (Feraheme)), generally one day apart. Post-injection sessions were approximatively 2.5$$$\;$$$±$$$\;$$$1.5$$$\;$$$hours after Ferumoxytol treatment. For each participant, each session included an anatomical T1-weighted MP2RAGE acquisition (TR/TI1/TI2/TE$$$\;$$$5000/700/2500/2.5$$$\;$$$ms, voxel$$$\;$$$size=1$$$\;$$$mm³), followed by a 15-minutes whole-head 3D MEGRE acquisition (FOV=192×192×96$$$\;$$$mm, 7$$$\;$$$echoes, TR/TEs$$$\;$$$2000/4.88/9.76/14.64/19.52/24.40/29.28/34.16$$$\;$$$ms, voxel$$$\;$$$size=0.6×0.6×0.6$$$\;$$$mm, flip angle=17°) then a 8-minute resting-state and two 4-minutes visual block-designed task fMRI acquisitions (FOV=200×200×120$$$\;$$$mm, TR/TE$$$\;$$$2000/18$$$\;$$$ms, voxel$$$\;$$$size=2×2×2$$$\;$$$mm3). All pre- and post-injection images were non-linearly aligned to the T1 images (upsampled to 0.6$$$\;$$$mm) using ANTs [9]. The T1 and MEGRE pre and post images were aligned in their common mid-transformation space using a non-linear pairwise registration from ANTs. CSF, white and gray matter (WM, GM) tissue compartments were segmented using ANTs on the pre-injection T1 , and a surface-based cortical depth analysis was performed using Freesurfer [10]. The MEGRE echoes were individually denoised using non-local mean denoising (NLM), N4 bias corrected and skull-stripped using ANTs. From these, apparent quantitative CBV maps (qCBV*) were computed by subtracting post- and pre-injection images by the mean post- and pre- value inside the vasculature [11]. Vascular segmentation on all echoes was performed from an updated Braincharter segmentation tool [12], (vessel$$$\;$$$size=0.6-2.5$$$\;$$$mm), which generated a “vesselness” score. Functional data were processed in AFNI and ANTs with motion correction, N4 bias corrected, NLM and temporally-bandpassed (0.005-0.01$$$\;$$$Hz). Visual fMRI task responses were averaged across trials within activated region to compare BOLD- and CBV-weighted response timing and amplitude, and functional networks were extracted using ICA from Nilearn.Results
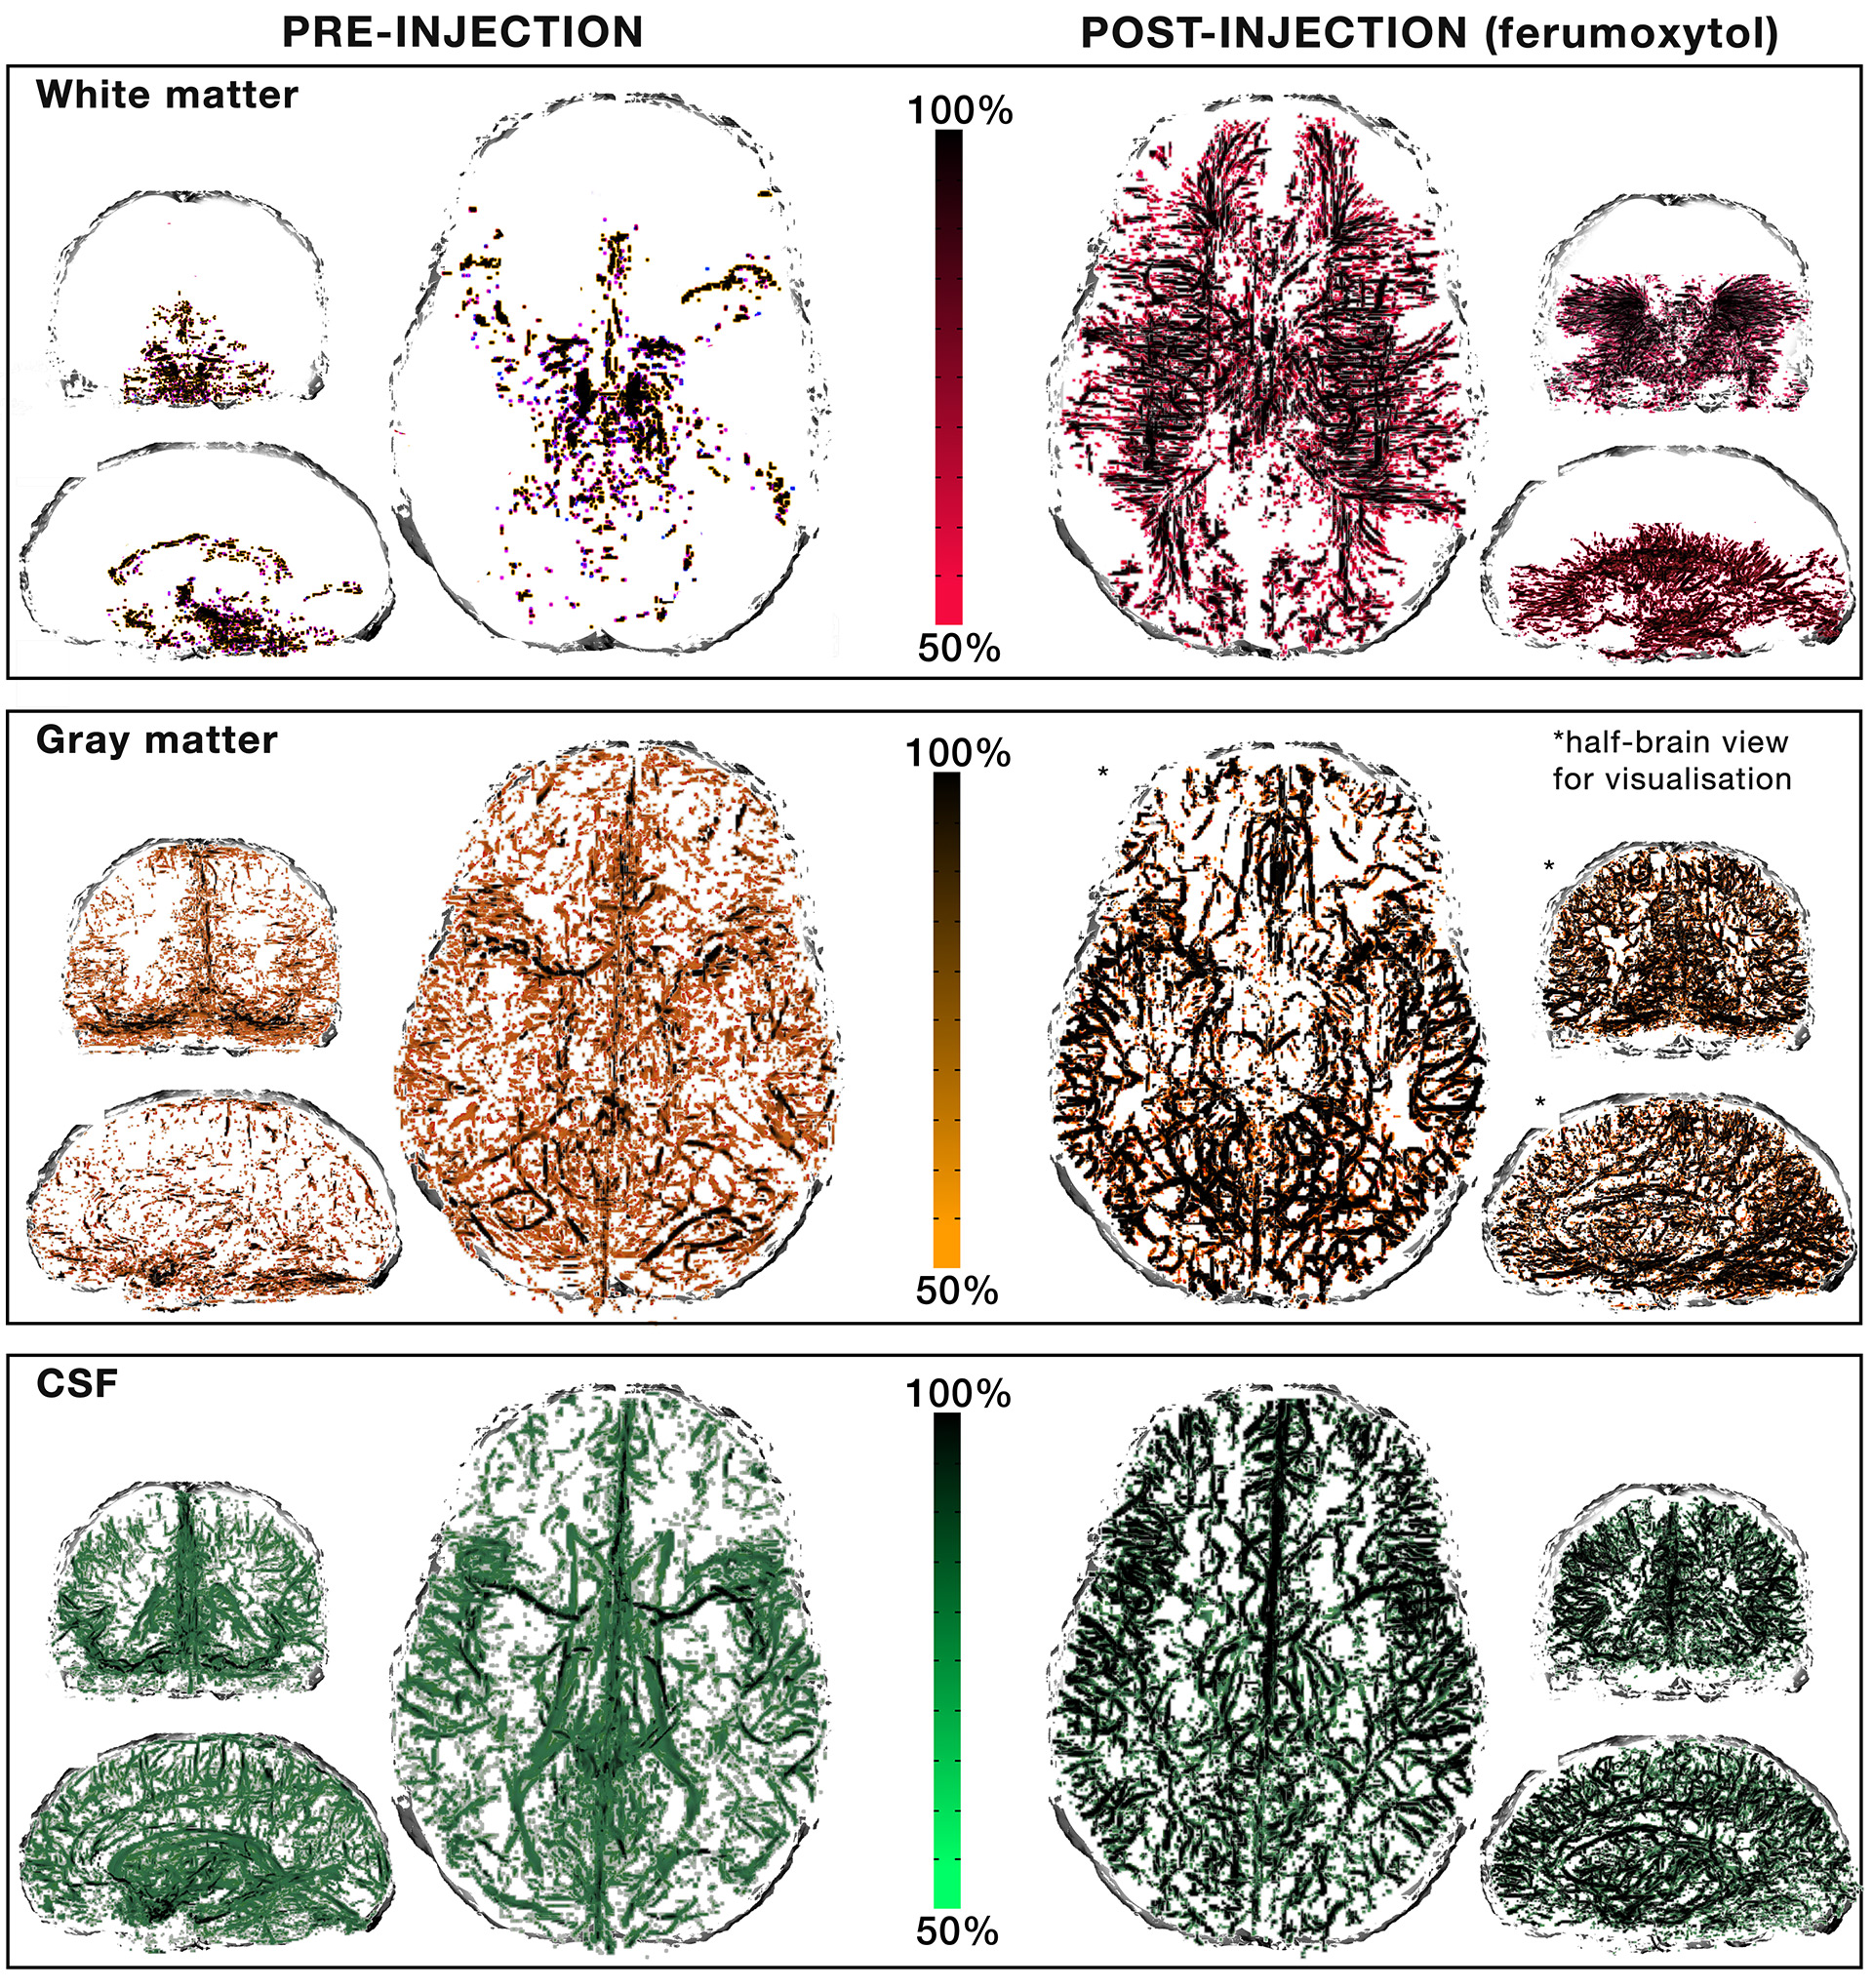
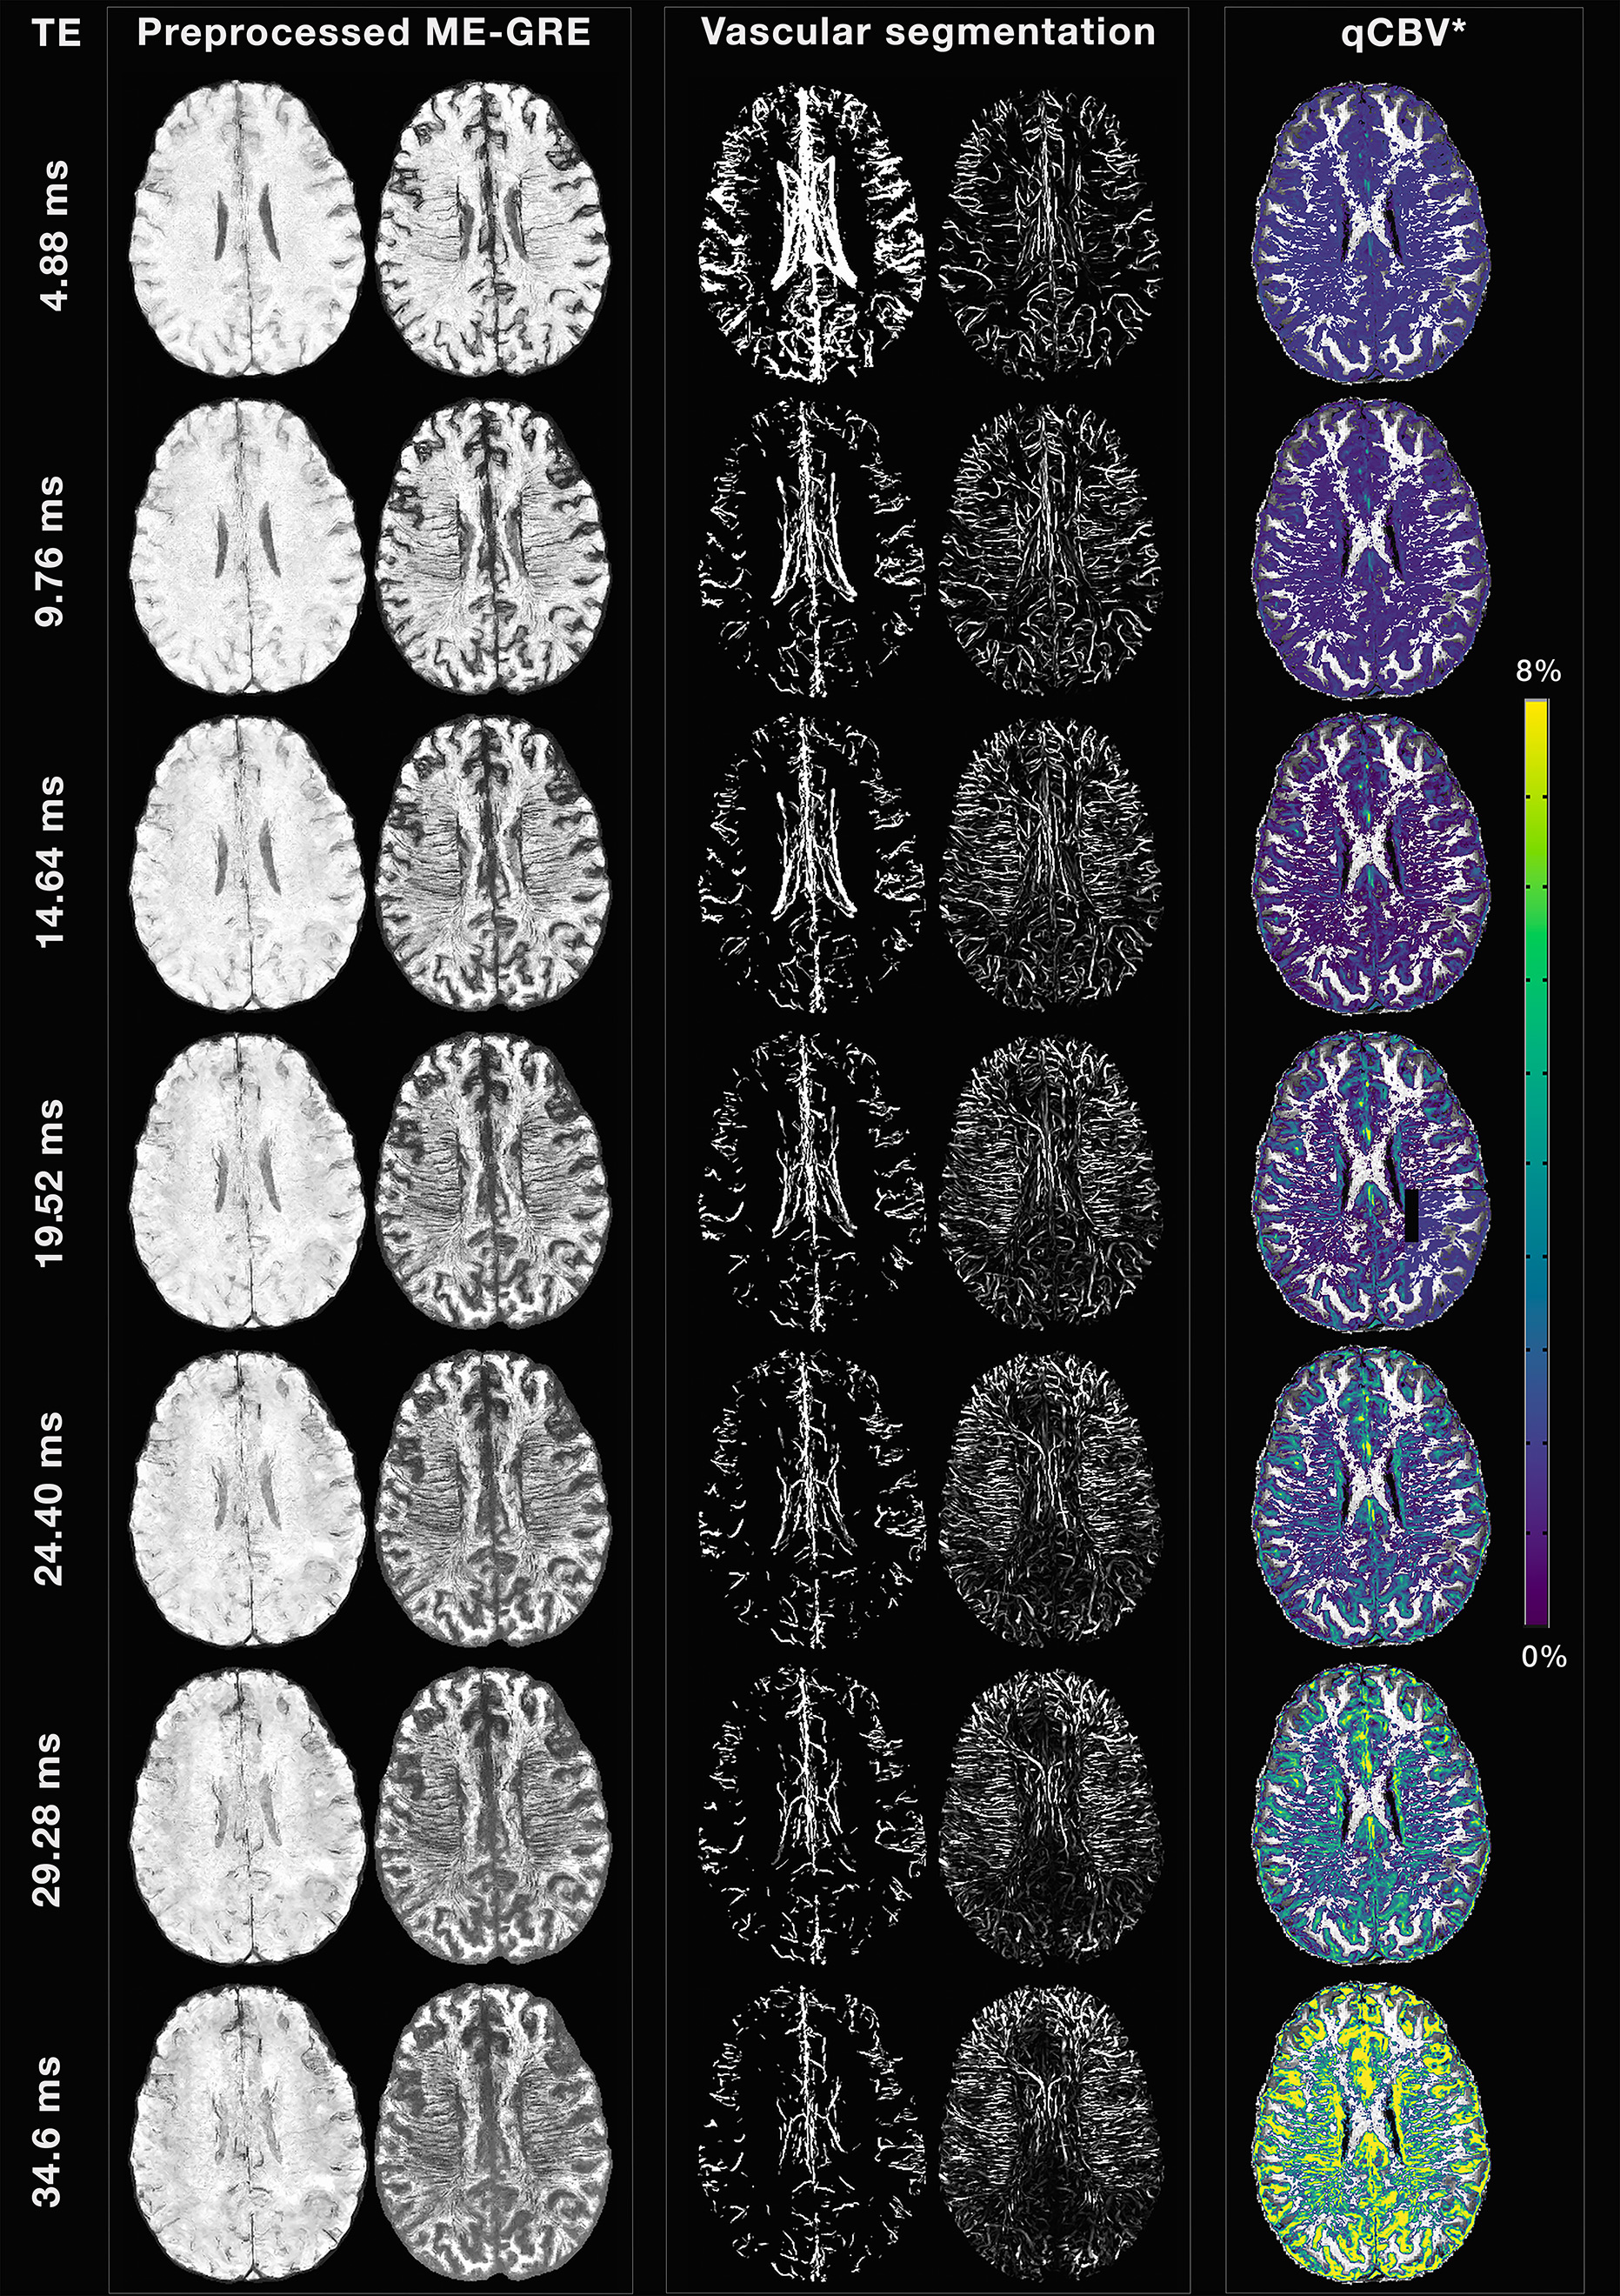
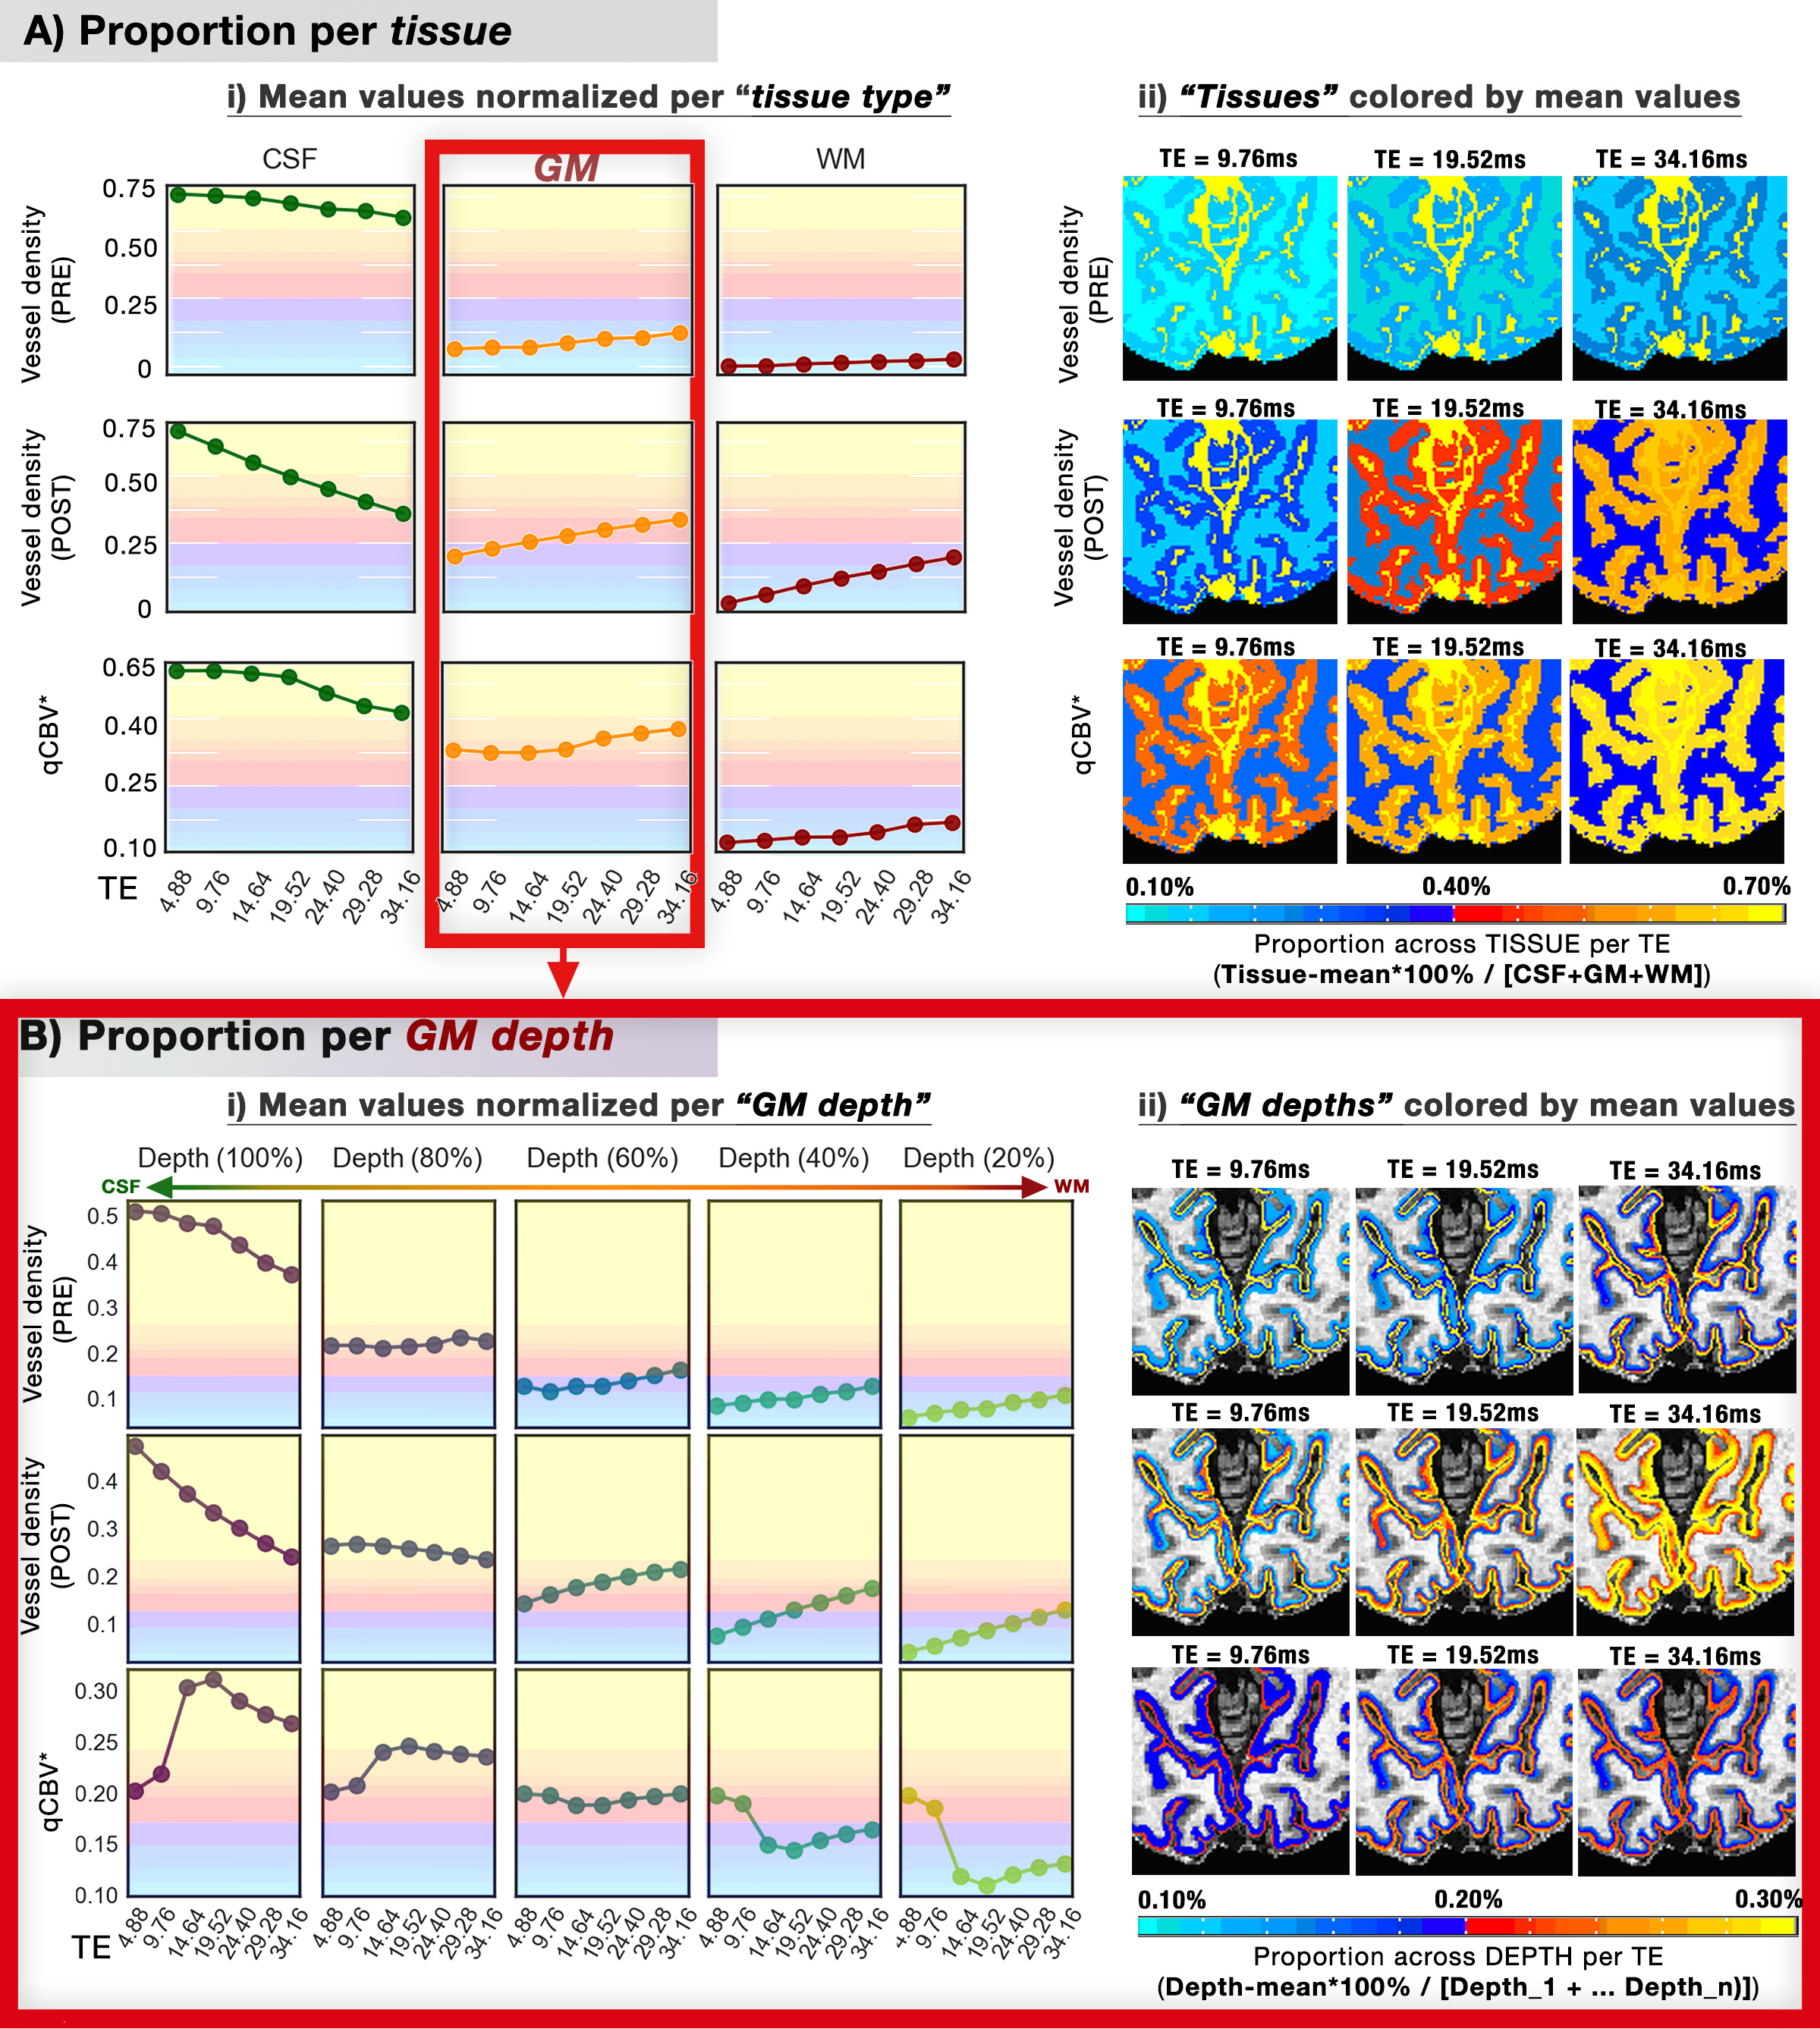
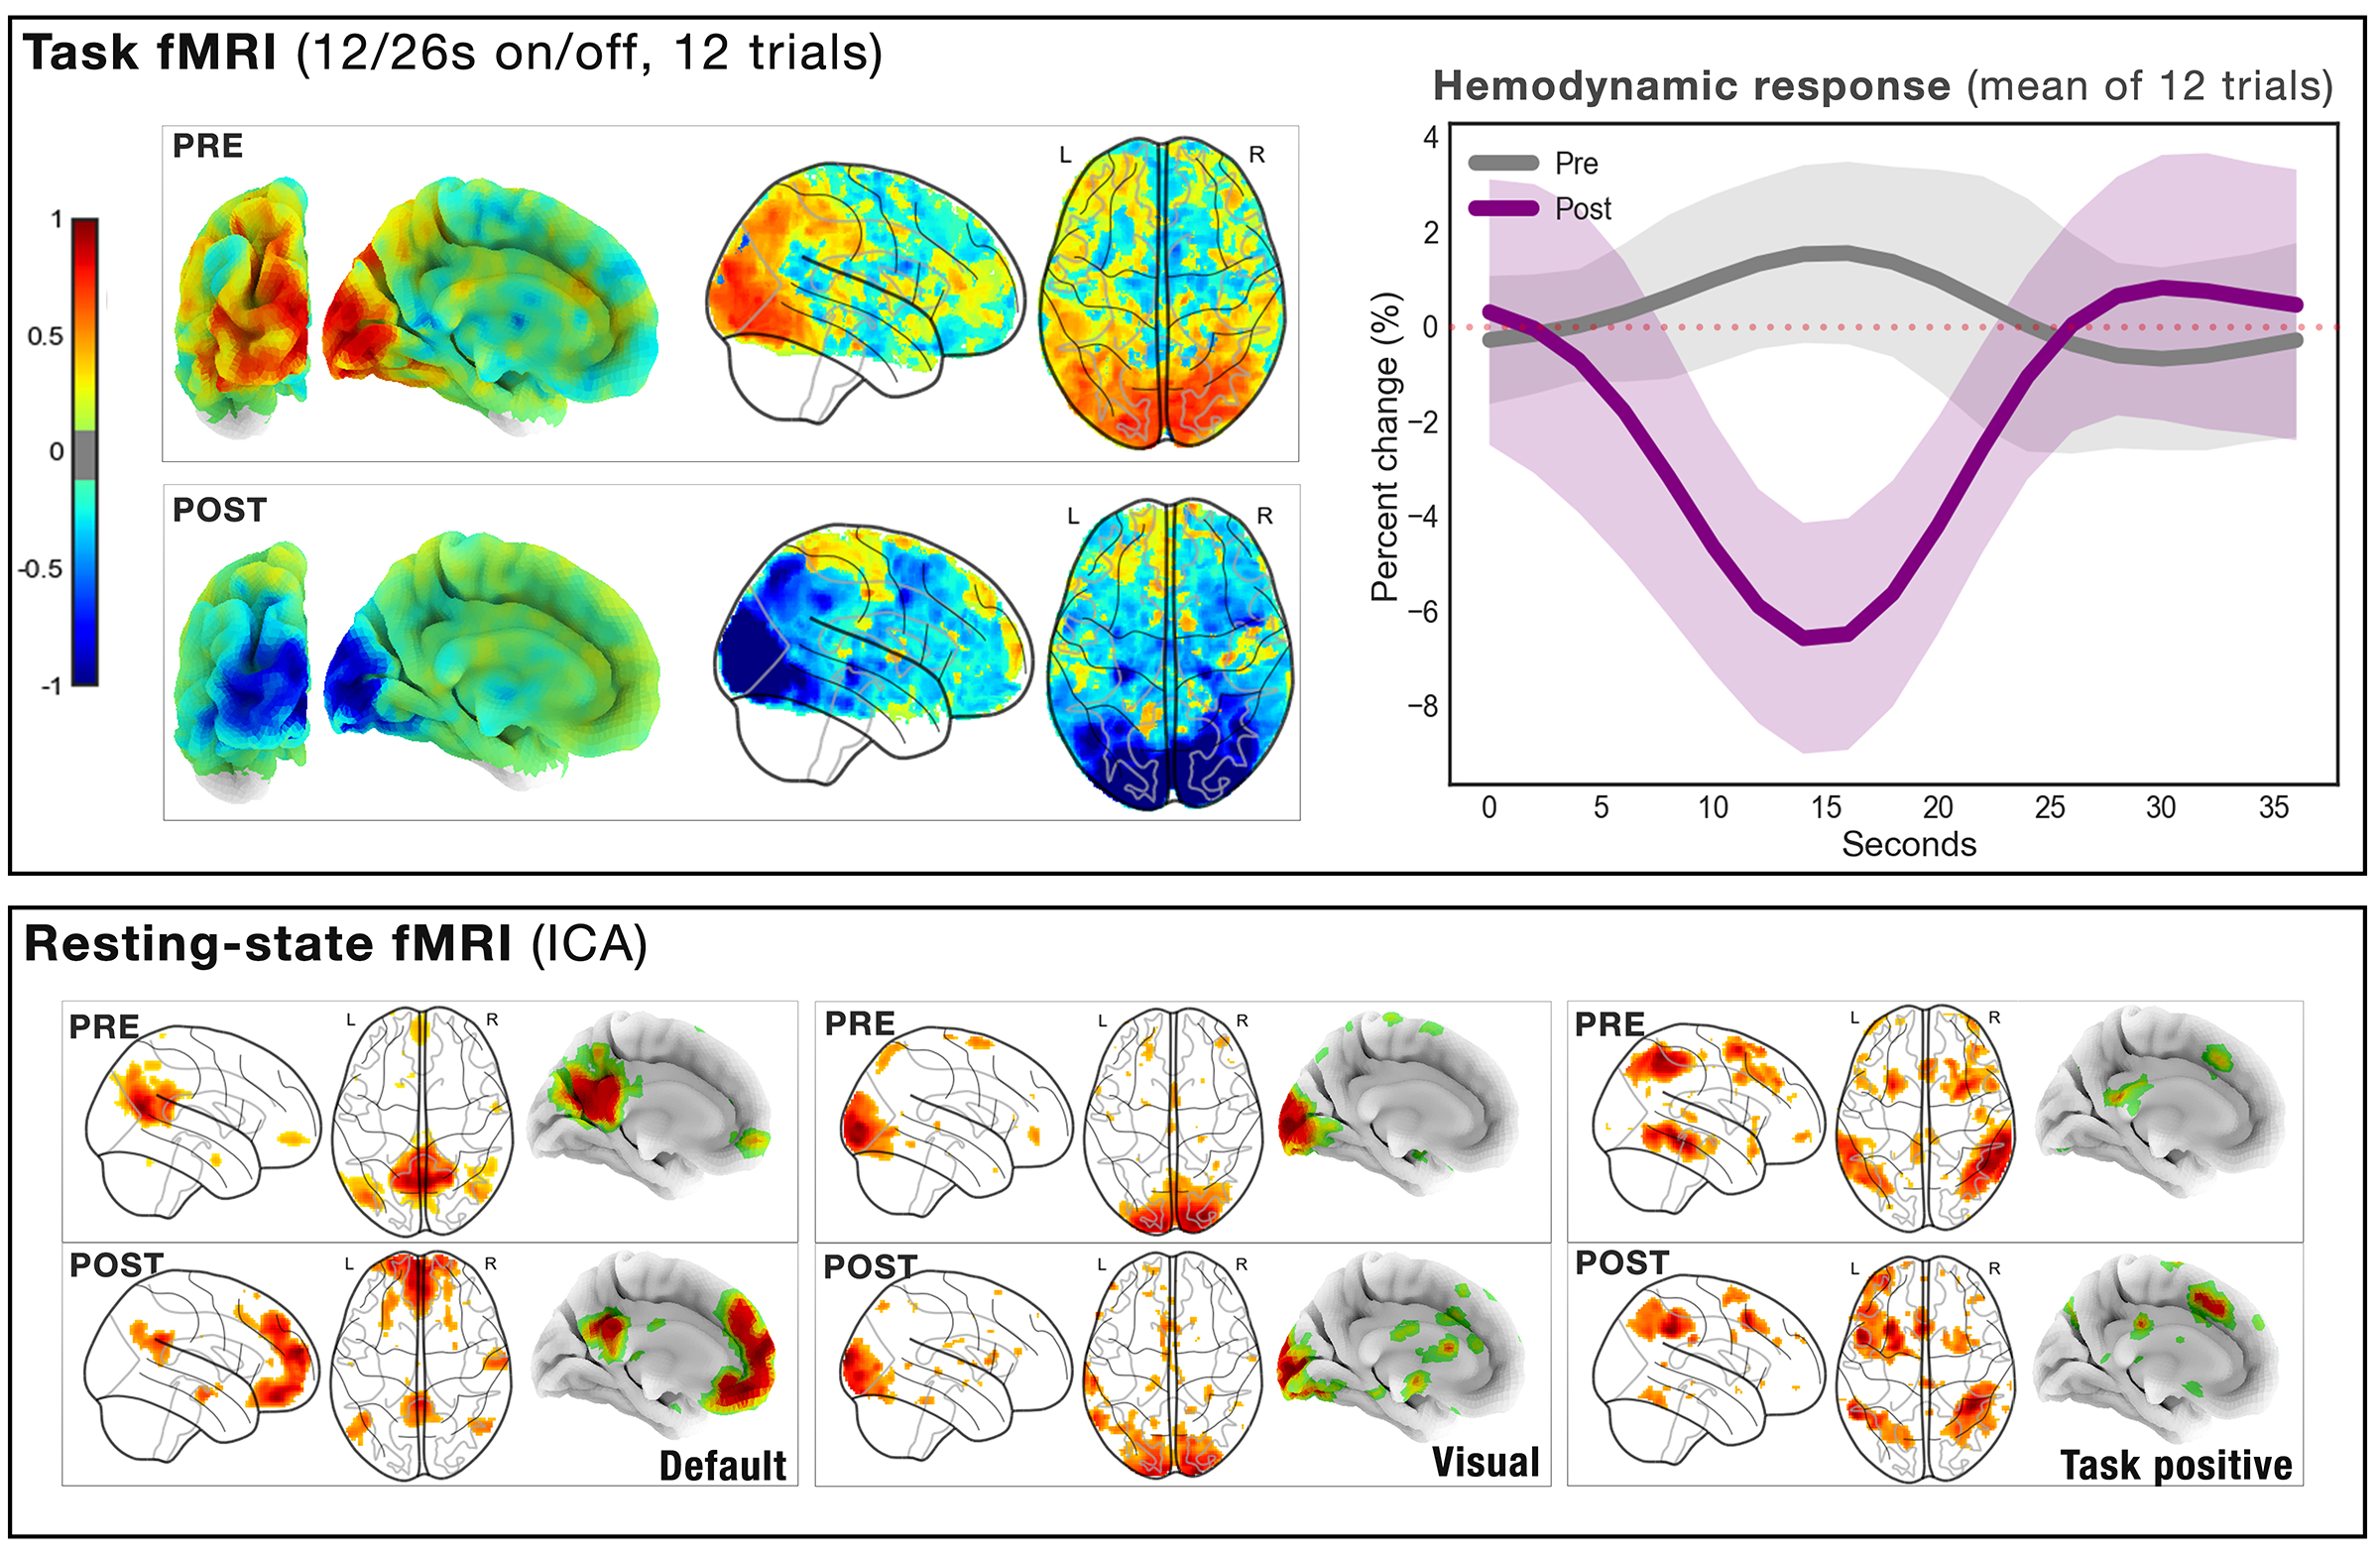
Figure 1 demonstrates how Ferumoxytol can vastly improve the detection and segmentation of intracranial vasculature, including challenging vessels within the cerebral white matter. Figure 2 illustrates how extracted vasculature and the derived qCBV* map both vary as a function of TE, demonstrating that extravascular “blooming” effects cause the putative vessels to increase in size with longer TE values. Figure 3 demonstrates how the apparent vascular density and qCBV* distribution vary across different tissue types (GM, WM, CSF) and cortical depths with TE, showing that large vessels and subsequently cortical GM appears to expand relative to CSF and WM. Finally, Figure 4 presents the comparison of BOLD- and CBV-weighted fMRI in task-driven and resting-state conditions, showing the that the CBV-weighted response is more than 3× larger than the BOLD-weighted response in the task data, and a close similarity between global resting-state networks between the two functional contrastsDiscussion/Conclusion
Our results highlight the advantages of Ferumoxytol for vascular segmentation and quantitative CBV mapping, but also support its usability as a fMRI contrast agent. With Ferumoxytol, finer vessels can be extracted, thus allowing a much denser representation of the vasculature throughout all tissue types, e.g. even those within the white matter. Increasing TE complicated extraction of large pial vessels but inversely increased the small vessel density. Proportionately, the qCBV* signal from large pials artificially spreads across cortical depths, from CSF towards the WM, and thus indirectly increased the CBV values, suggesting that both vascular segmentation and cortical-depth-specific analyses will require short TEs to prevent pial contamination. It is also possible that the CBV signal from small vessels in deep layers only become detectable at later echoes. Overall, our findings demonstrate the potential of Ferumoxytol for small vessel segmentation and high-resolution CBV-based MRI, and help guide the optimization of acquisition parameters such as TE. Alternative techniques such as UTE or spin-echo-based MRI may help to reduce the inflation of the CBV estimates [12].Acknowledgements
This work was supported in part by the NIH NIBIB (grants P41-EB015896 and R01-EB019437), NINDS (grant R21-NS106706), by the BRAIN Initiative (NIH NIMH grant R01-MH111419), and by the MGH/HST Athinoula A. Martinos Center for Biomedical Imaging; and was made possible by the resources provided by NIH Shared Instrumentation Grants S10-RR023043 and S10-RR019371. We thank our colleagues at Siemens Heathineers for use of the Works-In-Progress package #944.References
[1] A. M. Muehe et al., “Safety Report of Ferumoxytol for Magnetic Resonance Imaging in Children and Young Adults.,” Invest. Radiol., vol. 51, no. 4, pp. 221–227, Apr. 2016.[2] C. G. Varallyay et al., “High-resolution steady-state cerebral blood volume maps in patients with central nervous system neoplasms using ferumoxytol, a superparamagnetic iron oxide nanoparticle,” J. Cereb. Blood Flow Metab., vol. 33, no. 5, pp. 780–786, 2013.
[3] J. B. Mandeville, “IRON fMRI measurements of CBV and implications for BOLD signal.,” Neuroimage, vol. 62, no. 2, pp. 1000–8, Aug. 2012.
[4] C. W. Wu, K.-H. Chuang, Y.-Y. Wai, Y.-L. Wan, J.-H. Chen, and H.-L. Liu, “Vascular space occupancy-dependent functional MRI by tissue suppression,” J. Magn. Reson. Imaging, vol. 28, no. 1, pp. 219–226, Jul. 2008.
[5] H. D’Arceuil et al., “Ferumoxytol enhanced resting state fMRI and relative cerebral blood volume mapping in normal human brain,” Neuroimage, vol. 83, pp. 200–209, Dec. 2013.
[6] J. B. Mandeville et al., “Exogenous contrast agent improves sensitivity of gradient-echo functional magnetic resonance imaging at 9.4 T,” Magn. Reson. Med., vol. 52, no. 6, pp. 1272–1281, Dec. 2004.
[7] D. Qiu, G. Zaharchuk, T. Christen, W. W. Ni, and M. E. Moseley, “Contrast-enhanced functional blood volume imaging (CE-fBVI): Enhanced sensitivity for brain activation in humans using the ultrasmall superparamagnetic iron oxide agent ferumoxytol,” Neuroimage, vol. 62, no. 3, pp. 1726–1731, Sep. 2012.
[8] K. Uludağ and P. Blinder, “Linking brain vascular physiology to hemodynamic response in ultra-high field MRI,” Neuroimage, vol. 168, pp. 279–295, Mar. 2018.
[9] J. A. de Zwart et al., “Impulse response timing differences in BOLD and CBV weighted fMRI,” Neuroimage, vol. 181, pp. 292–300, Nov. 2018.
[10] B. Avants, N. Tustison, and G. Song, “Advanced Normalization Tools (ANTS),” Insight J., pp. 1–35, 2009.
[11] J. R. Polimeni, V. Renvall, N. Zaretskaya, and B. Fischl, “Analysis strategies for high-resolution UHF-fMRI data,” Neuroimage, vol. 168, pp. 296–320, Mar. 2018.
[12] C. A. Gharagouzloo, P. N. McMahon, and S. Sridhar, “Quantitative contrast-enhanced MRI with superparamagnetic nanoparticles using ultrashort time-to-echo pulse sequences,” Magn. Reson. Med., vol. 74, no. 2, pp. 431–441, 2015.
[13] M. Bernier, S. C. Cunnane, and K. Whittingstall, “The morphology of the human cerebrovascular system,” Hum. Brain Mapp., Sep. 2018.
Figures