0536
Testing temporal dependence of spatial specificity in BOLD fMRI at 7T: comparing short versus long stimulus duration1Athinoula A. Martinos Center for Biomedical Imaging, Massachusetts General Hospital, Charlestown, MA, United States, 2Department of Radiology, Harvard Medical School, Charlestown, MA, United States, 3Division of Health Sciences and Technology, Massachusetts Institute of Technology, Cambridge, MA, United States
Synopsis
The spatial specificity of the BOLD-fMRI response has previously been shown to vary systematically across cortical depths, with highest specificity found in voxels furthest from the pial surface, while highest sensitivity of the response is found in voxels closest to the pial vessels. Analogous trade-offs between spatial specificity and sensitivity can be appreciated in the temporal evolution of the BOLD-fMRI response. Here we investigate spatial specificity of the response to both short-duration and long-duration stimuli as they evolve in time using high-resolution BOLD-fMRI at 7T, and demonstrate that BOLD-fMRI response exhibits high specificity both at early and late time points.
Introduction
The spatial specificity of BOLD-fMRI response has been shown to vary systematically across cortical depths, with highest specificity found in voxels furthest from the pial surface, while highest sensitivity of the response is found in voxels closet to the large pial vessels1. Analogous trade-offs between spatial specificity and sensitivity can be appreciated in the temporal evolution of the BOLD-fMRI response: the earliest response has been shown to be more neuronally specific, while the later responses grow in amplitude while spreading spatially resulting in a loss in specificity and a gain in sensitivity. Focus on the early response has often been confined to investigations of an ‘initial dip’, which is challenging to detect and is most pronounced at the pial surface2–4, nevertheless, the earliest response phases are expected to have higher spatial specificity than later phases. We have previously demonstrated trade-offs between sensitivity and spatial specificity of BOLD fMRI response across cortical depth and across time in 3T data5. Here we investigate spatial specificity of the response to short- and long-duration stimuli as they evolve in time using high-resolution BOLD-fMRI at 7T, to test whether the short-duration stimuli, by limiting the spatial spread of the BOLD response, can achieve higher spatial specificity.Methods
Three healthy volunteers (1M/2F, 29±9) were imaged on a whole-body 7T scanner (Siemens Healthineers, Erlangen, Germany) using 2D gradient-echo EPI protocols with 0.8 and 1.1 mm isotropic resolution acquired coronally (Figure 1). During each scan subjects were presented with a visual stimulus consisting of two contrasting conditions (A:”foreground” and B:”background”) to activate a target ‘diamond-shaped’ figure on the surface of V1 according to the visuotopic mapping model (Figure 1), similar to previous studies1. Two subjects underwent two repetitions of 8-s stimulus blocks with 38–46-s inter-stimulus-intervals (ISI) in 0.8-mm resolution, and one subject underwent three repetitions of 0.5-s stimulus blocks with 26–36-s ISI in 1.1-mm resolution . Between 10 and 14 runs were acquired for each subject. Same-session 0.75 mm isotropic resolution FOCI-MEMPRAGE data6,7 were acquired and employed for automatic cortical surface reconstruction using FreeSurfer. T1 data were bias-field corrected (SPM), lightly denoised using an edge-preservative, non-local-mean spatial denoising algorithm8 carried out by modeling the Rician noise with a standard deviation of 1.0 (ANTS), and surface meshes were reconstructed for the cortical depths every 10% between WM and pial surface9. EPI data were motion corrected (AFNI), detrended, and projected onto the surface meshes using boundary-based registration10 initialized with the manual alignment and performed in two steps, first within the whole brain with masked-out EPI distorted regions, and second only within the V1 mask. Minimal surface-based smoothing was applied to the EPI data along the tangential direction within a neighborhood of one vertex11. GLM analyses were performed (FSL) to create dSPM maps consisting of z-statistic values calculated in every time point, which were then averaged across runs and projected onto upsampled surface meshes for improved visualization of the high-resolution data9. An FIR model was applied to estimate HRF responses for short- and long-stimulus data across cortical depths, measured within ROIs corresponding to foreground and background activation patterns.Results and Discussion
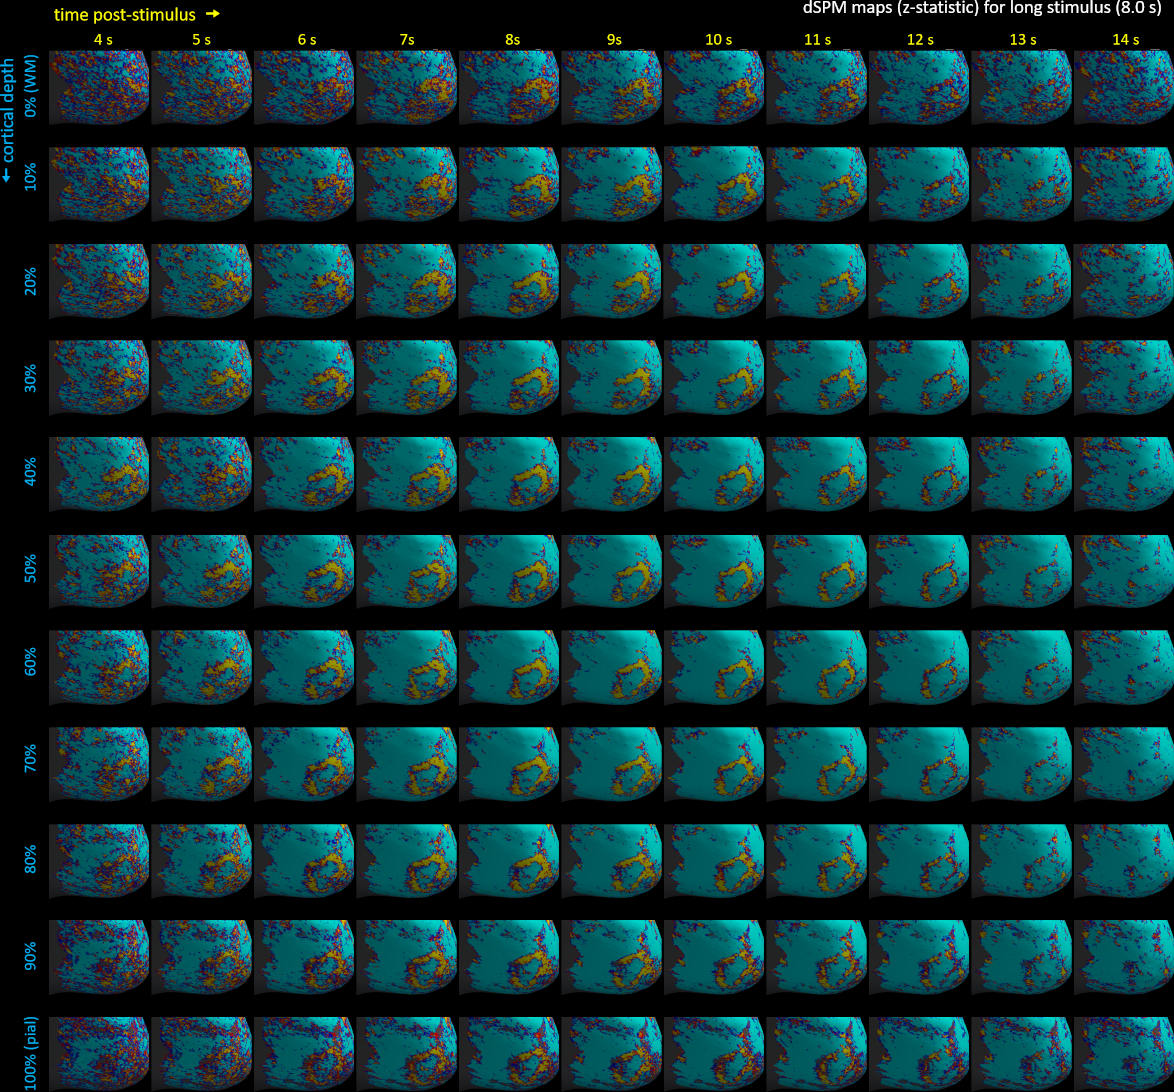
BOLD-fMRI responses to long (8-s) and short (0.5-s) stimuli had similar shapes across cortical depths (Figure 2), showing that while the amplitude of the BOLD-fMRI response varies with depth the basic shape is preserved. Figure 3 illustrates trade-offs between sensitivity and spatial specificity of the response in time and across cortical depth. Early responses and responses measured close to WM surface are more spatially specific, while in later responses and responses measured closer to the pial surface the spatial activation pattern less resembles the expected ‘diamond-shaped’ activation pattern. There is a collection of depths and time-delays that exhibit similar levels of spatial spread, suggesting that these two parameters each affect specificity. These effects are also visible for both short and long stimulus durations in the animations showing evolution of the response in time and across cortical depth (Figure 4), which in addition clearly demonstrate the post-stimulus undershoot following the positive response. Figure 5 shows that temporal-dependence of the spatial specificity of the response appears to be stronger than depth-dependence by comparing early vs. late, and near-WM vs. near-pial responses for both stimulus durations. Interestingly, the evolution of the activation for later time points appears to return to baseline in a time-reversed pattern, similar to previous observations12, and the spatial specificity of the negative undershot seems to evolve in time and vary across depths in similar manner as the positive BOLD response. These results suggest that the BOLD-fMRI response exhibits high specificity both at early and late time points, indicating that the spatiotemporal evolution of the response can be exploited to achieve high neuronal specificity.Acknowledgements
This work was supported in part by the NIH NIBIB (grants P41-EB015896 and R01-EB019437), by the BRAIN Initiative (NIH NIMH grant R01-MH111419 and NIBIB grant U01-EB025162), and by the MGH/HST Athinoula A. Martinos Center for Biomedical Imaging; and was made possible by the resources provided by NIH Shared Instrumentation Grants S10-RR023043 and S10-RR019371. Thanks to Ned Ohringer, Nina Fultz, and Kyle Droppa for help with volunteer recruitment.References
1. Polimeni, J. R., Fischl, B., Greve, D. N. & Wald, L. L. Laminar analysis of 7T BOLD using an imposed spatial activation pattern in human V1. NeuroImage 52, 1334–1346 (2010).
2. Buxton, R. B. The Elusive Initial Dip. NeuroImage 13, 953–958 (2001).
3. Siero, J. C. W. et al. Cortical depth dependence of the BOLD initial dip and poststimulus undershoot in human visual cortex at 7 Tesla. Magn. Reson. Med. 73, 2283–2295 (2015).
4. Tian, P. et al. Cortical depth-specific microvascular dilation underlies laminar differences in blood oxygenation level-dependent functional MRI signal. Proc. Natl. Acad. Sci. 107, 15246–15251 (2010).
5. Blazejewska, A. I., Nasr, S. & Polimeni, J. R. Improved spatial specificity of the early positive BOLD response observed with high-resolution fMRI at 3T. in Proc. Intl. Soc. Mag. Reson. Med. 26 0390 (2018).
6. Hurley, A. C. et al. Tailored RF pulse for magnetization inversion at ultrahigh field. Magn. Reson. Med. 63, 51–8 (2010).
7. van der Kouwe, A. J. W., Benner, T., Salat, D. H. & Fischl, B. Brain morphometry with multiecho MPRAGE. NeuroImage 40, 559–569 (2008).
8. Coupé, P., Manjón, J., Collins, L. & Multiresolution, A. Adaptive Multiresolution Non-Local Means Filter for 3D MR Image Denoising. IET Image Process. Inst. Eng. Technol. 1–21 (2011).
9. Polimeni, J. R., Renvall, V., Zaretskaya, N. & Fischl, B. Analysis strategies for high-resolution UHF-fMRI data. NeuroImage (2017).
10. Greve, D. N. & Fischl, B. Accurate and robust brain image alignment using boundary-based registration. NeuroImage 48, 63–72 (2009).
11. Blazejewska, A. I., Hinds, O. & Polimeni, J. R. Improved Specificity of High-Resolution fMRI with Surface-Based Cortical Ribbon Smoothing. Proc. ISMRM 25, 1651 (2017).
12. Chen, B. R., Bouchard, M. B., Mccaslin, A. F. H., Burgess, S. A. & Hillman, E. M. C. High-speed vascular dynamics of the hemodynamic response. NeuroImage 54, 1021–1030 (2012).
Figures