0535
Characterization of BOLD hemodynamic response function in subcortical and cortical regions of human brain at 3T and 9.4T1Baylor College of Medicine, Houston, TX, United States, 2University of Tuebingen, Tuebingen, Germany, 3Max Planck Institute for Biological Cybernetics, Tubingen, Germany
Synopsis
Measurement of blood oxygen level dependent hemodynamic response function (BOLD HRF) can be used to evaluate neurovascular coupling and understand underlying physiology (e.g. oxygen uptake and blood flow). However, there is dearth of understanding subcortical neurovascular coupling, which is critical for brain health. Here, we characterize human subcortical HRFs at both 3T and 9.4T and compare them with HRFs in visual cortex.
Introduction
Brainstem mediates critical brain functions that range from homeostasis to cognition making it desirable to develop a non-invasive method that quantifies activity in brainstem. The hemodynamic response function (HRF) is the vascular response evoked by brief (few seconds) neural activation and is formed by changes in oxygen uptake and blood flow. The HRF can be a good indicator of brain health because neurovascular coupling is critical for brain function1,2. However, study of the HRF in human brainstem has been very limited because of its deep location resulting in relatively low signal-to-noise ratio (SNR). Here, we characterized HRFs in the superior colliculus (SC) and lateral geniculate nuclei (LGN) at conventional field strength (3T) as well as ultra-high-field (UHF) strength (9.4T). We also compared the subcortical HRFs with those in visual cortex (V1, V2, and MT) to show similarities and differences.Methods
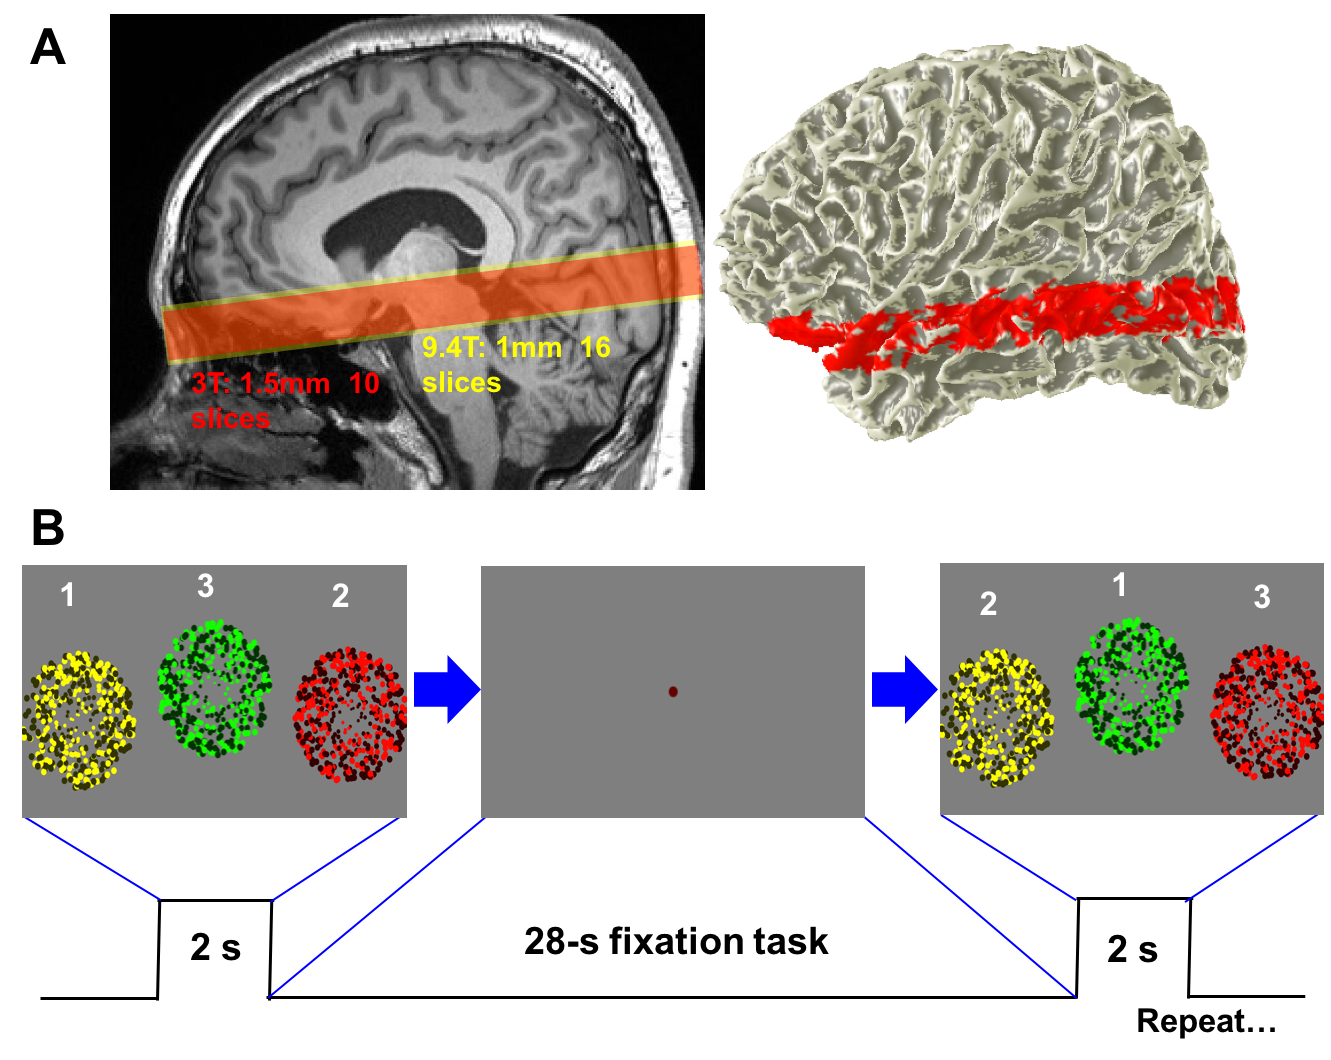
Imaging was performed at 3T (Siemens Trio, 32-ch head coils, Baylor College of Medicine, TX, USA) and 9.4T (Siemens, 20-ch head coils, Max Planck Institute, Tubingen, Germany). At 3T, functional images were obtained (n = 7) using a 2-shot spiral acquisition (34-ms acquisition time for each shot) for 1.5 mm3 spatial resolution (TE 35 ms, TR 750 ms, volume acquisition every 1.5 s). Functional images were also obtained at 9.4T (n = 7) using point spread function-corrected echo planar imaging (PSF-EPI) with 1 mm3 spatial resolution (TE 21 ms, TR 1250 ms). Functional prescriptions cover SC and LGN as well as cortical regions (V1, V2, and MT), Fig. 1A. To generate brief periods of neural activity, subjects performed a multi-sensory integration task every 25 s. During a 2-s duration stimulation period, three circular regions filled with flickering colored dots were presented in random order at different screen locations, Fig. 1B. Subjects performed saccades to fixate on each flickering circle and pushed a response button corresponding to the circle. This 25-s duration trial was repeated 18 times in each run; 5 runs were collected. HRFs obtained in the target regions were temporally averaged over the whole of the scanning session. We then characterized mean HRF of each ROI by amplitude and temporal parameters.Results
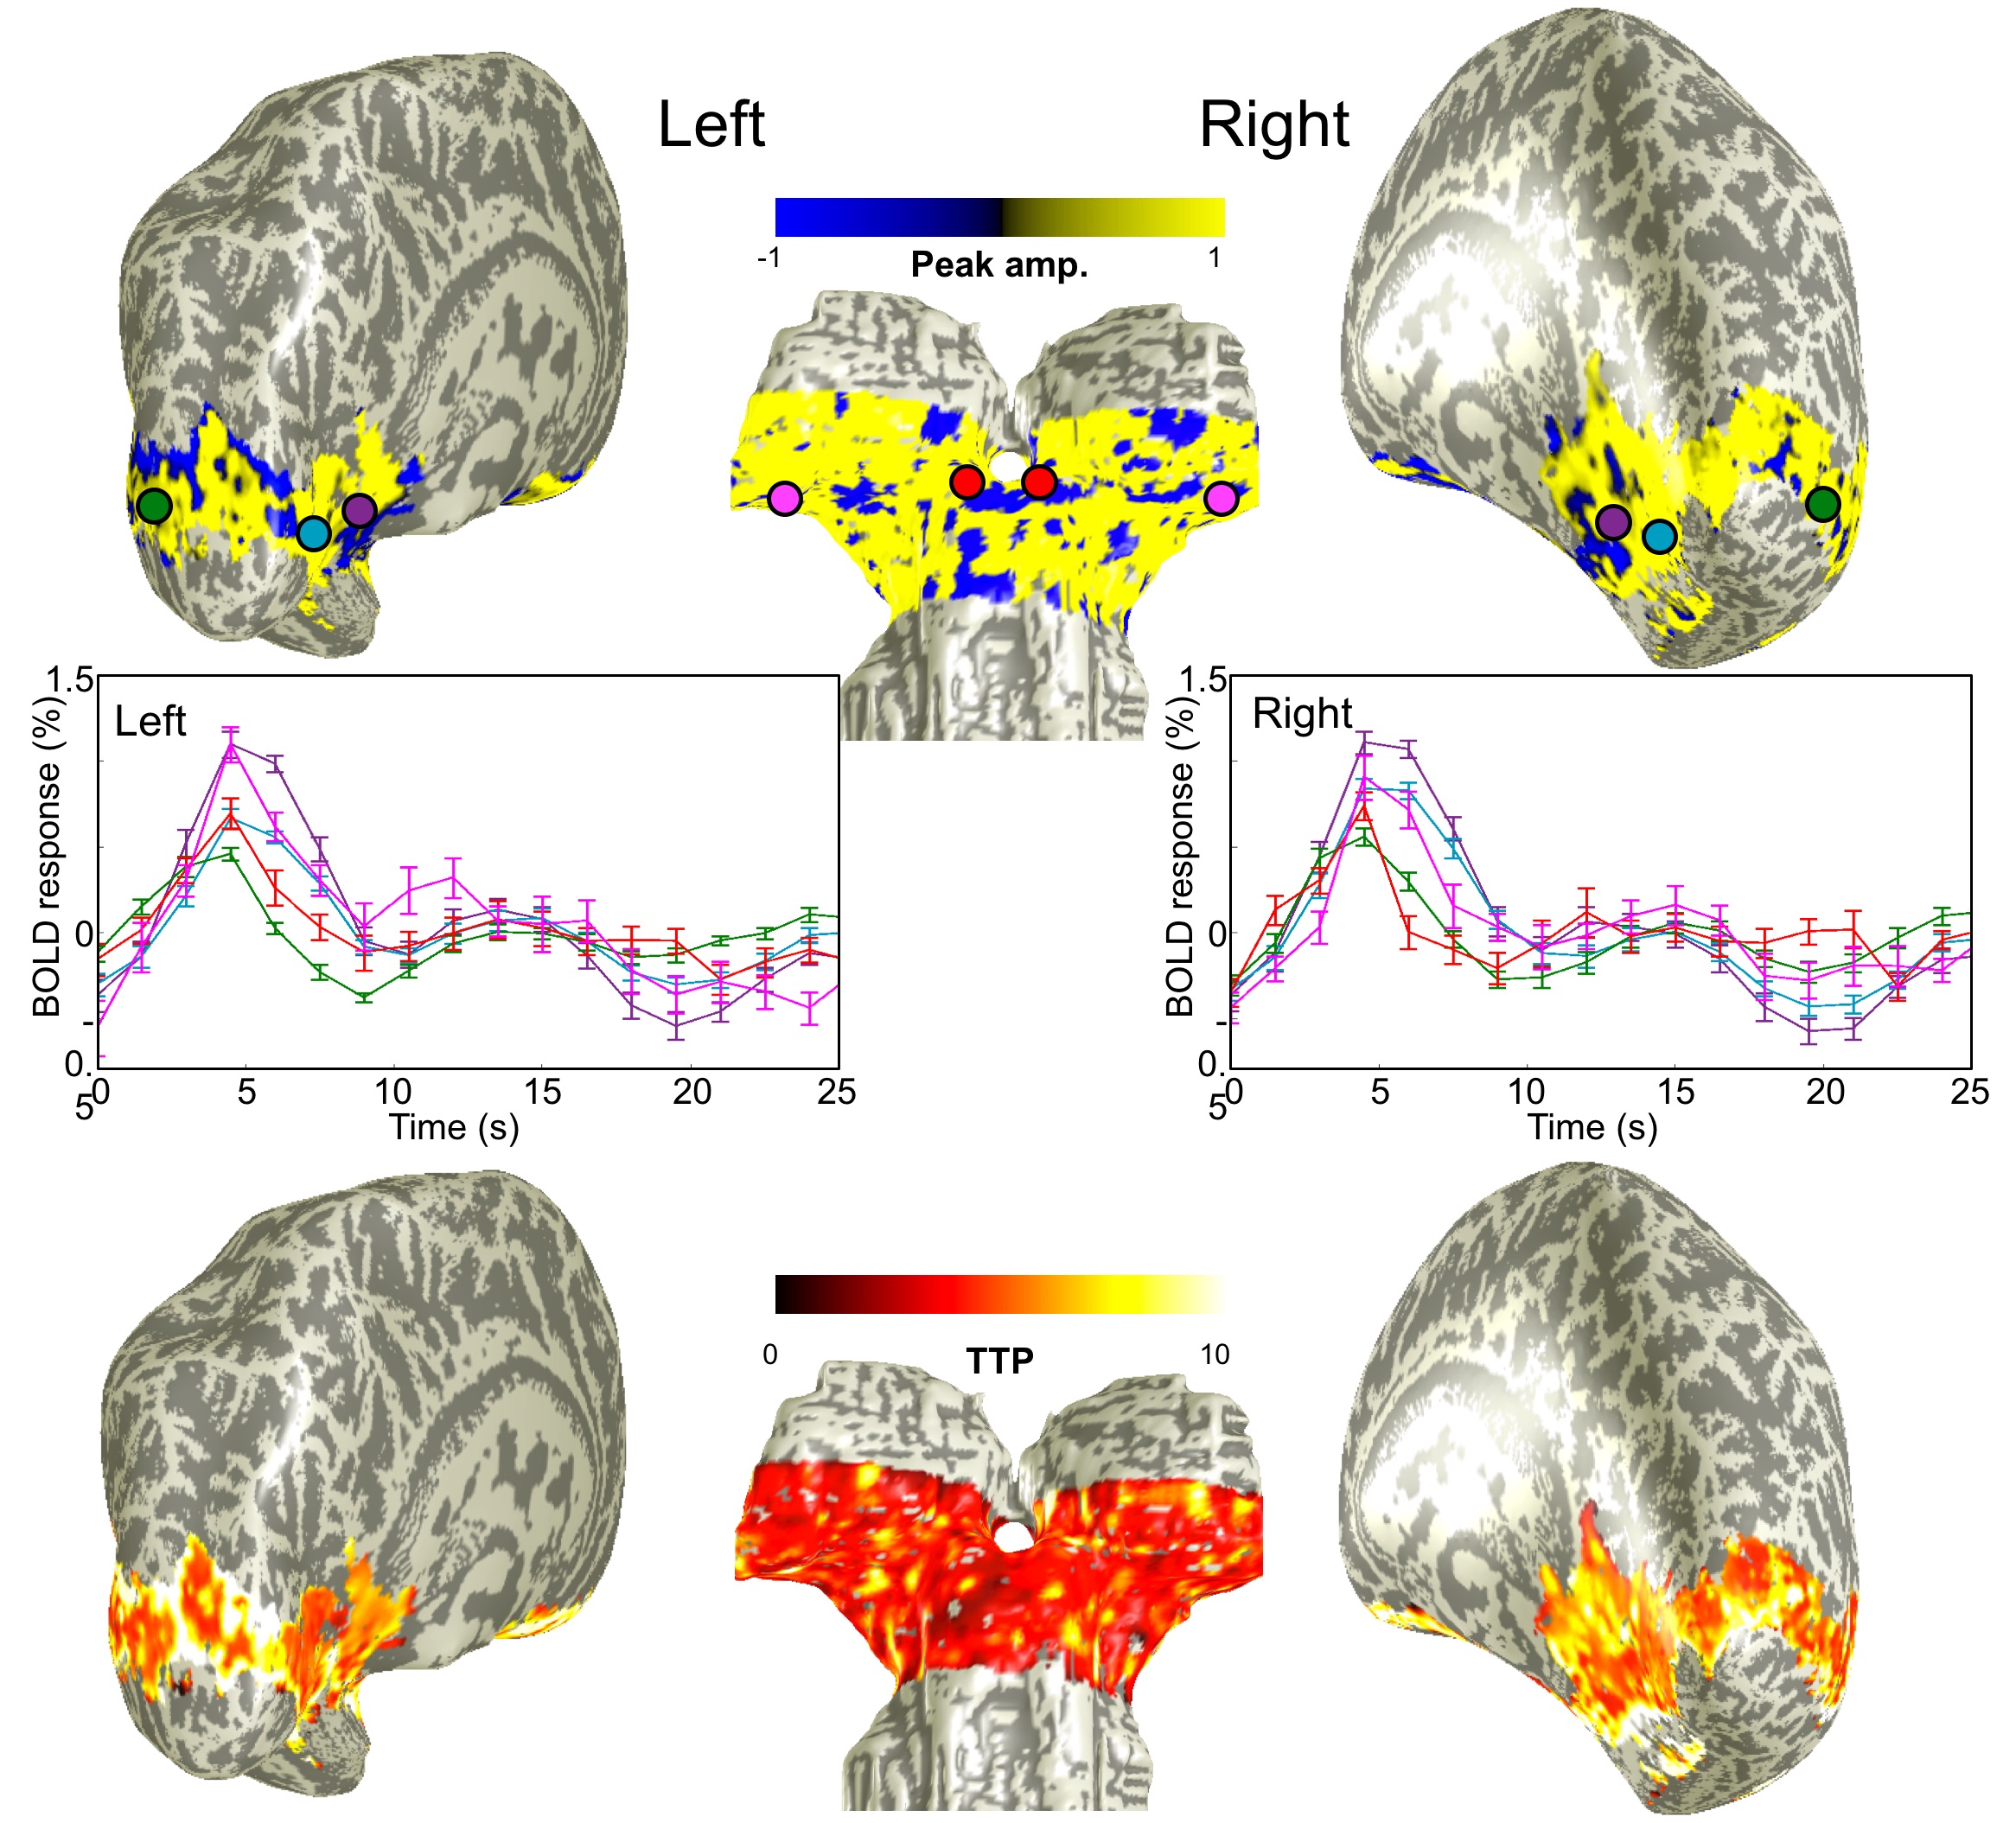
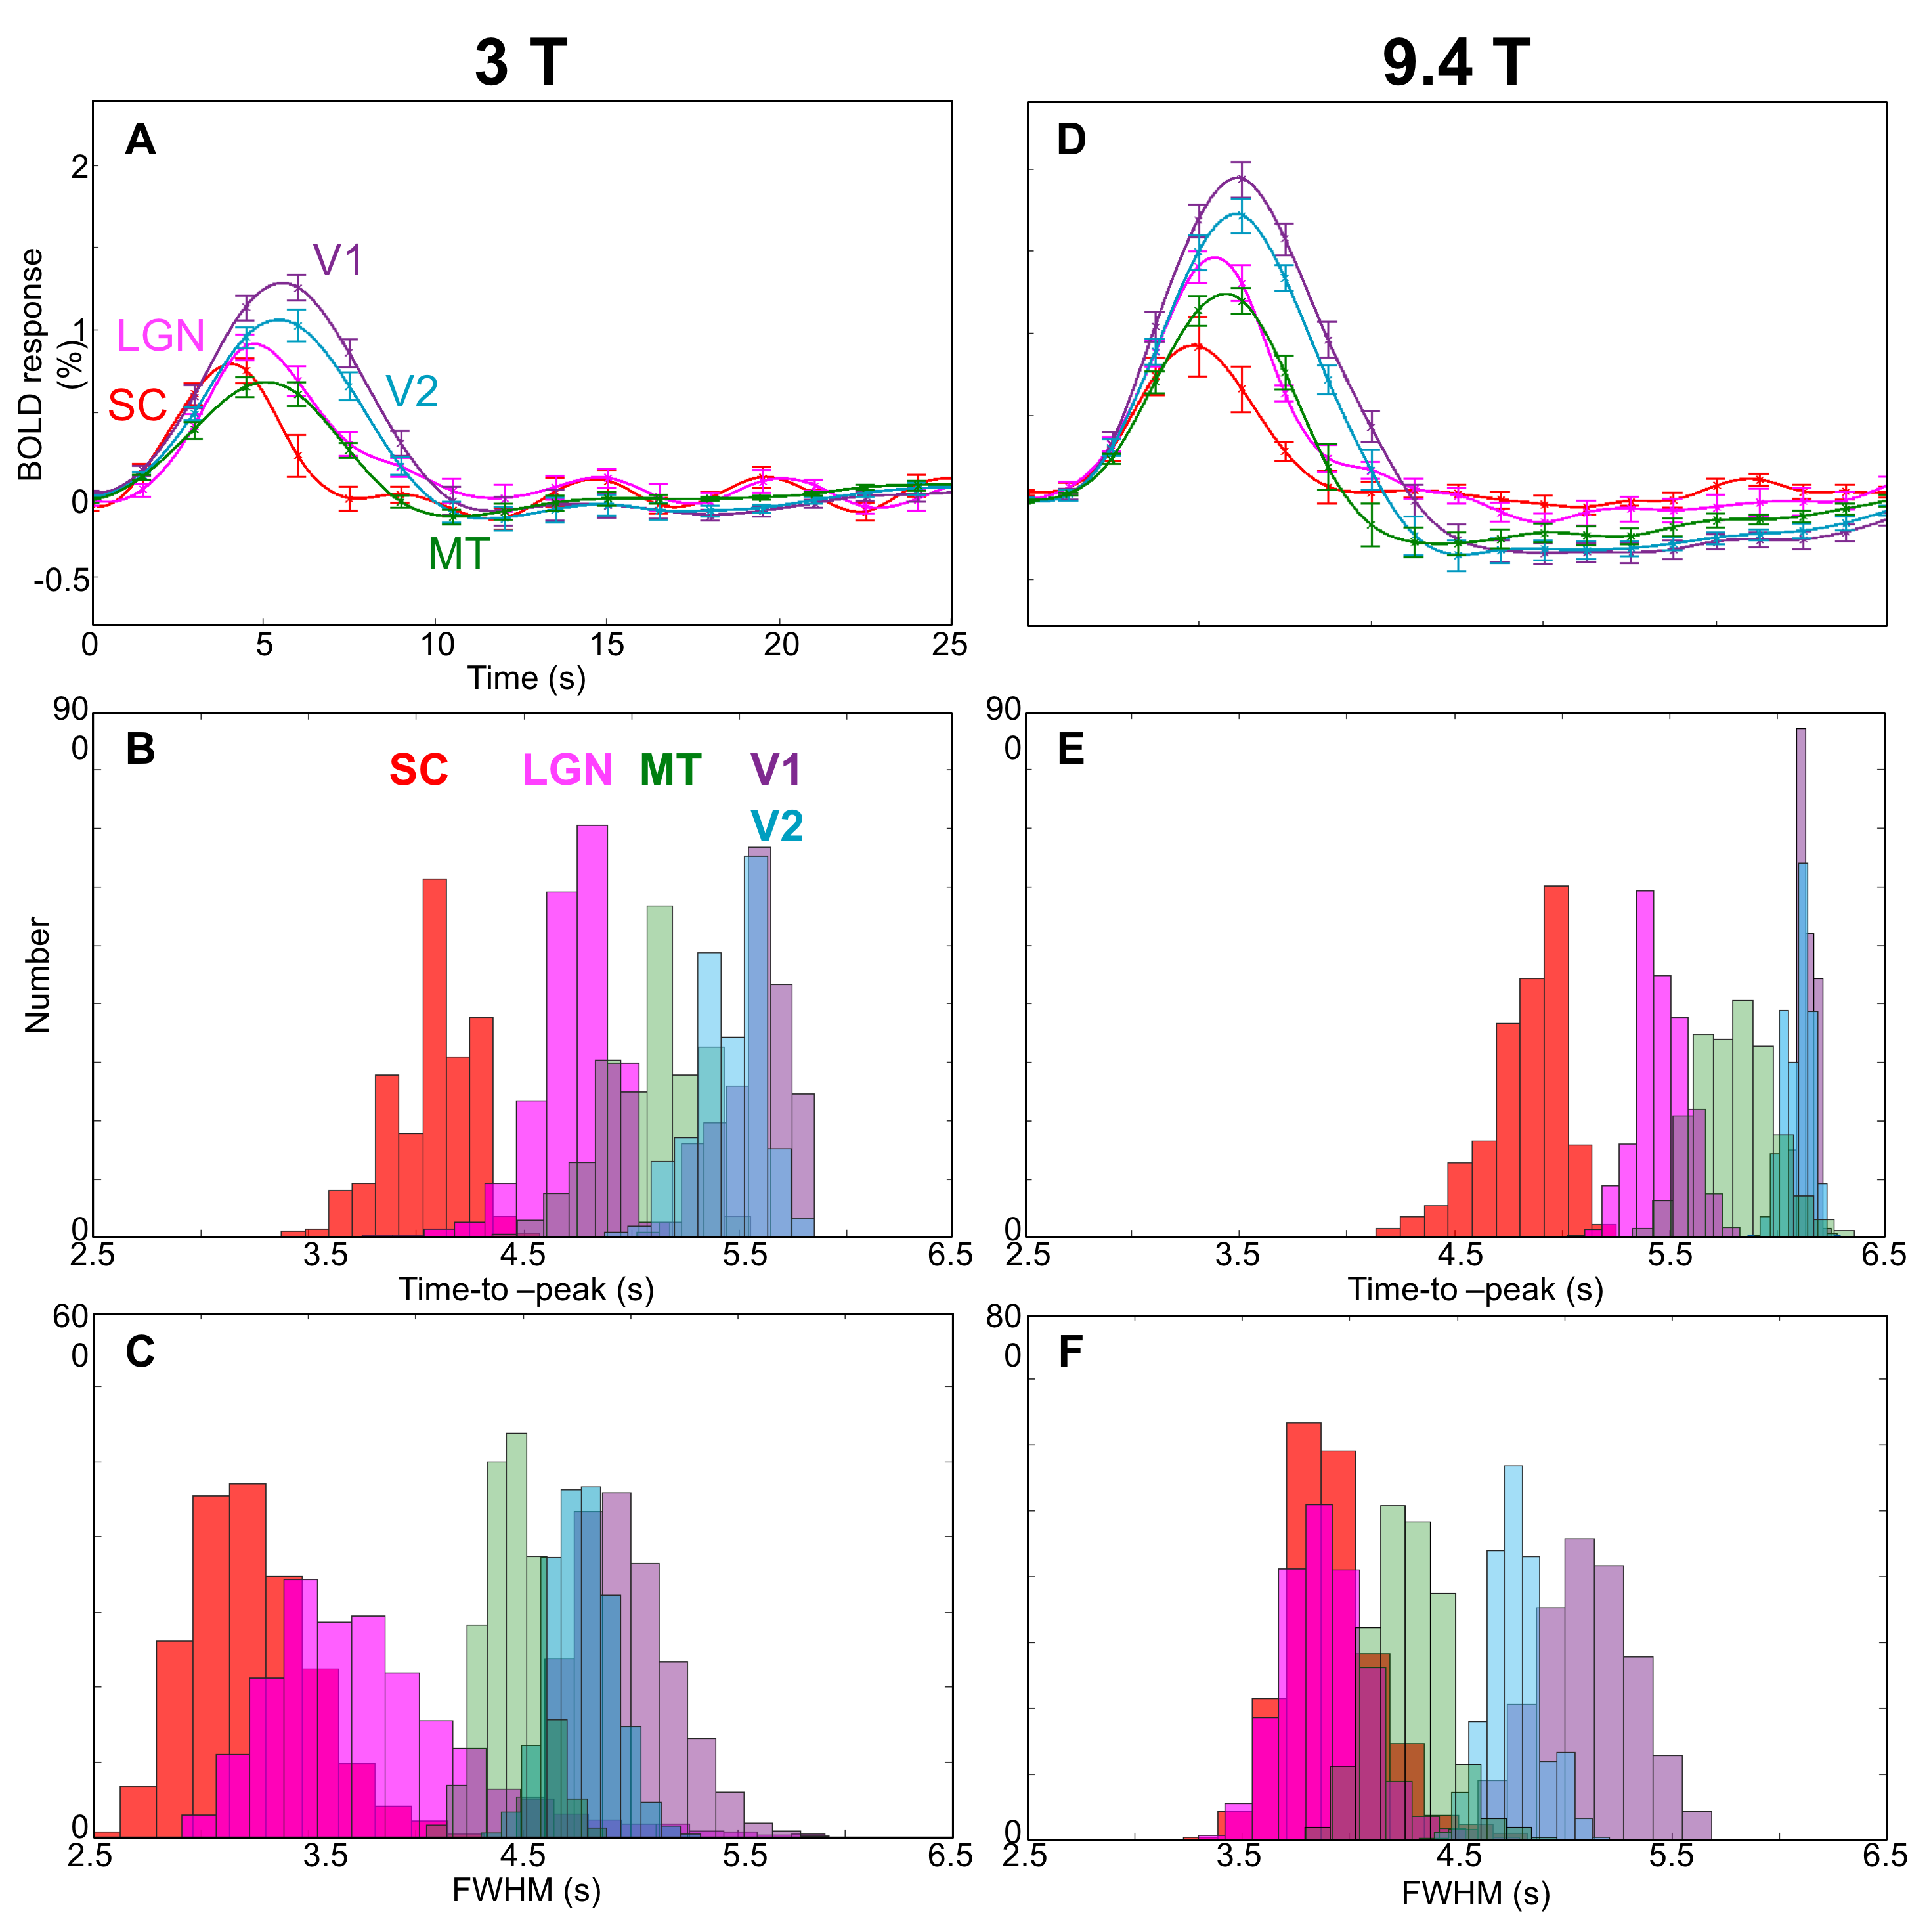
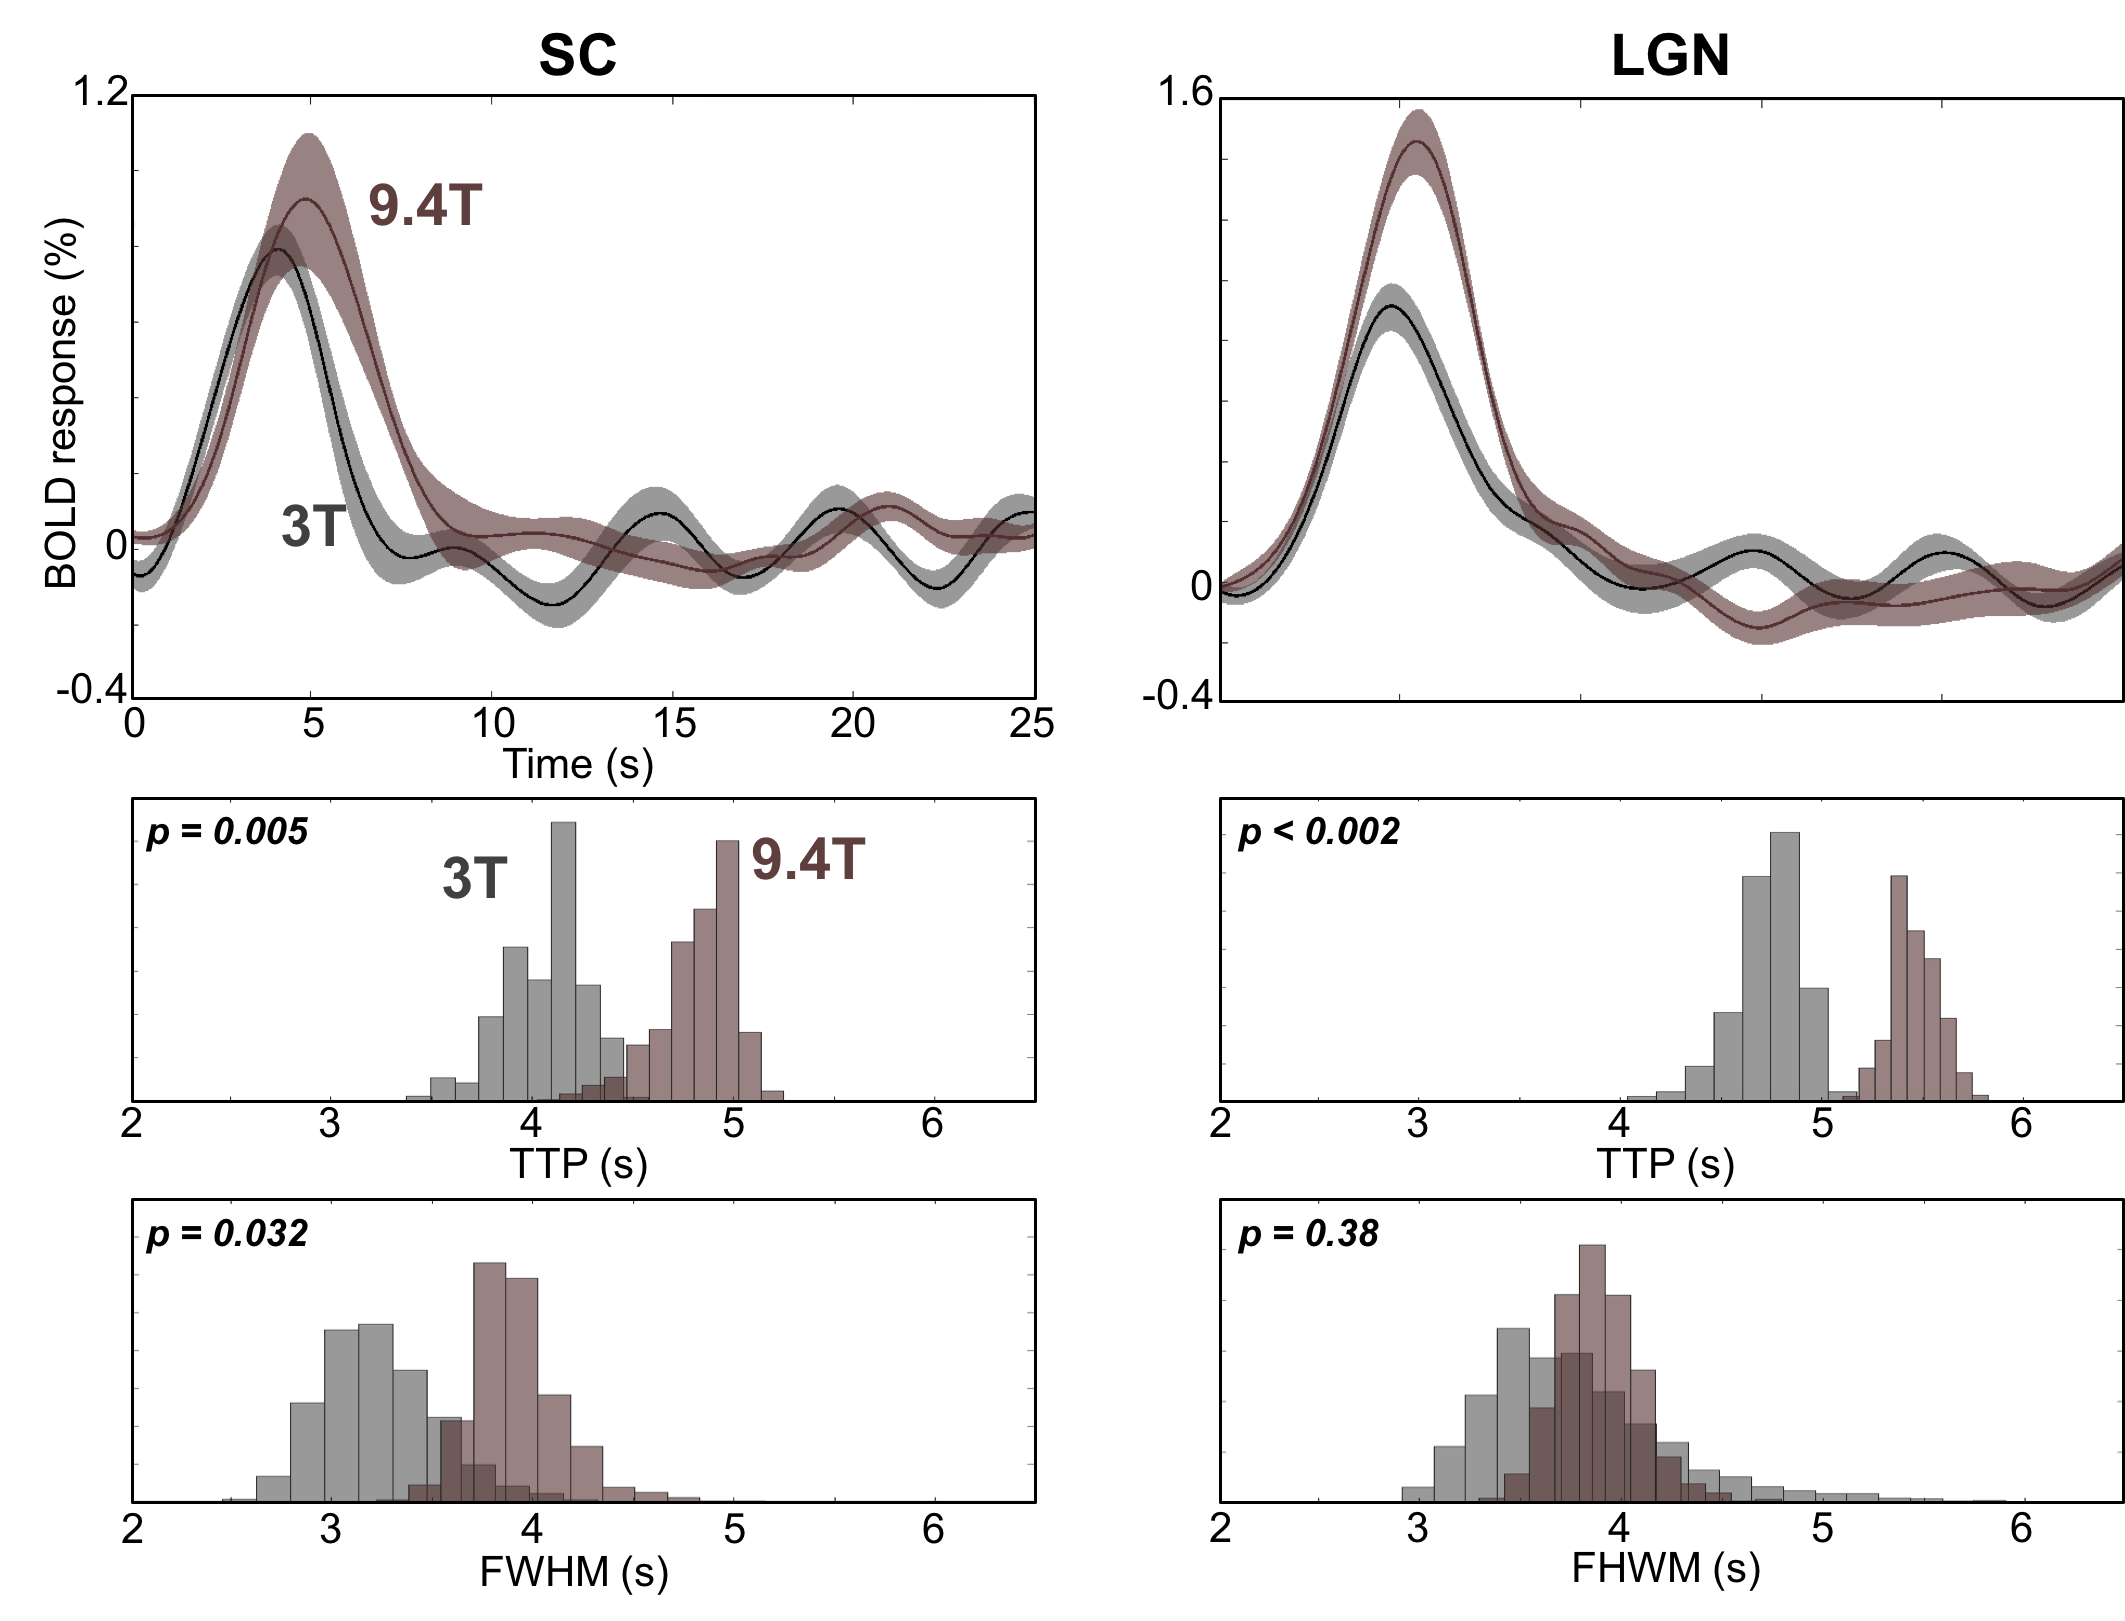
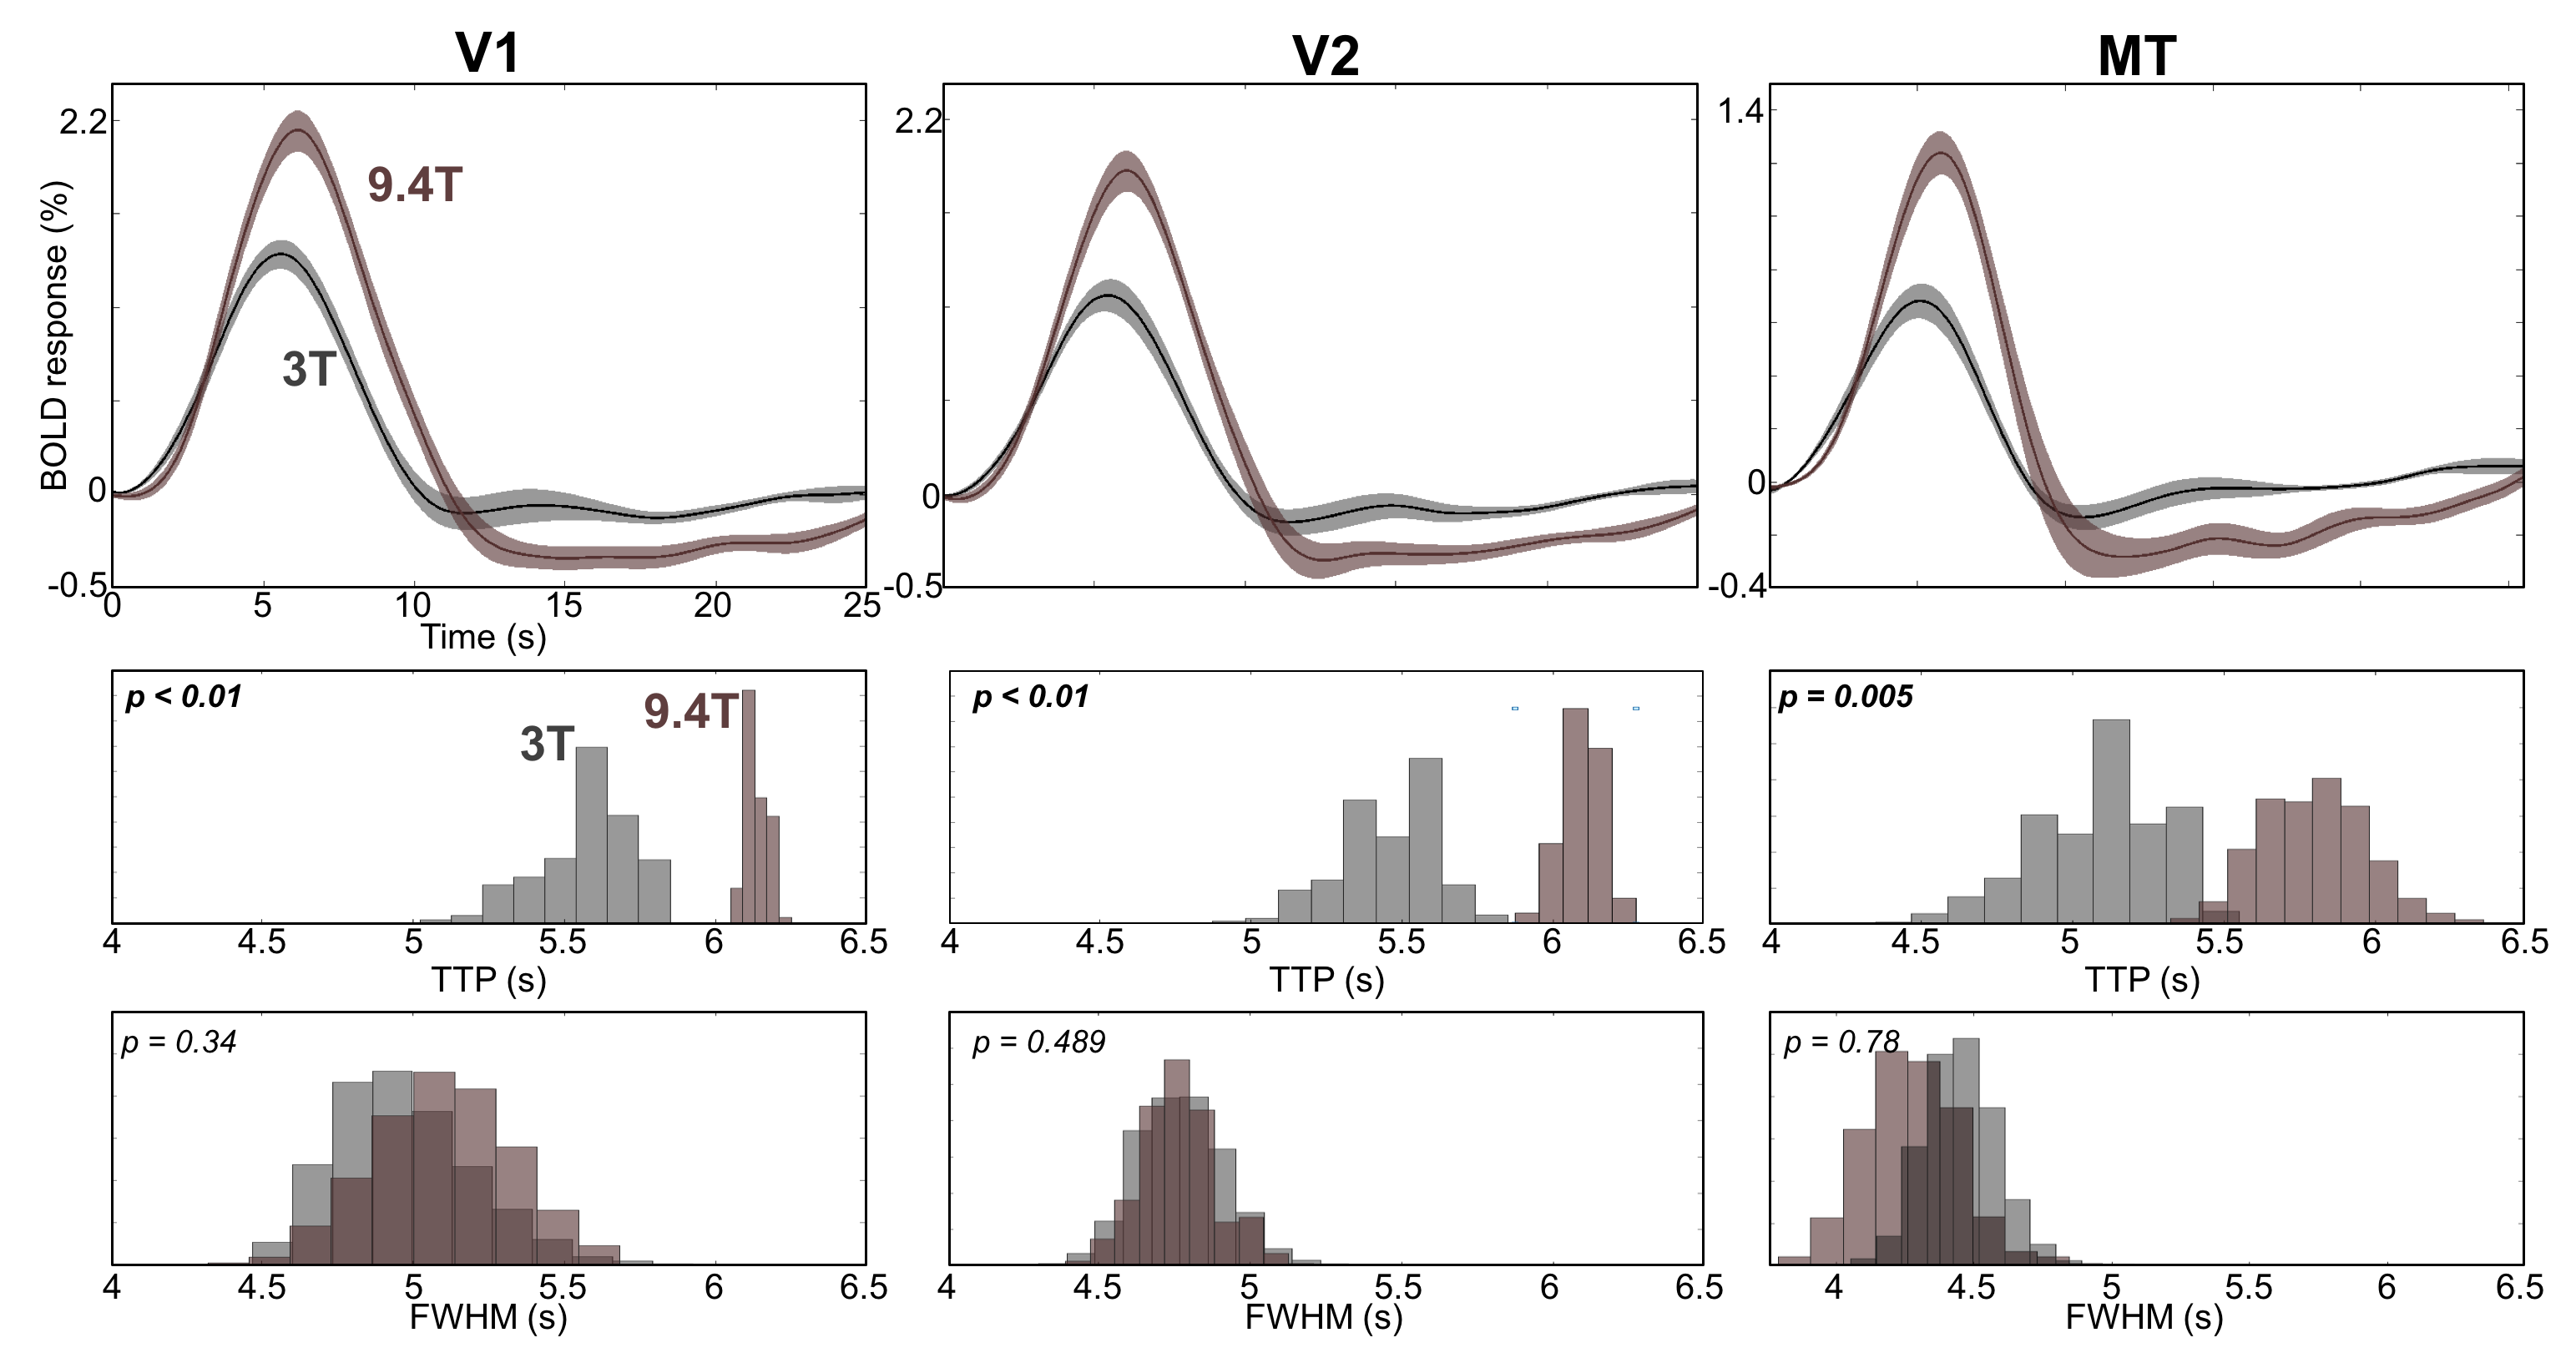
We were able to measure strong and reliable (CNR >2) HRFs in subcortical and cortical regions, Fig. 2. We found the fastest time-to-peak (TTP) in SC (red) followed by that in LGN (magenta) at both 3T and 9.4T, Fig 3. The TTPs of HRFs in both SC and LGN are significantly faster than those in V1(purple) and V2 (light blue). Note that TTP in MT (green) is sparsely distributed between subcortical regions and early visual cortex. Full-width-half-max (FWHM) also show similar distribution patterns, which appeared narrower in subcortical regions than in cortical regions. However, there is no significant difference in FWHM between SC and LGN. We found similar characteristics among the ROIs (SC & LGN < V1 & V2) in FWHM at 9.4T.Discussion
We measured reliable subcortical HRFs and compared them with cortical HRFs at both 3T and 9.4T. The subcortical HRFs are stereotypical within a ROI and across subjects, which is similar to the cortical HRFs observed in the previous studies3,4. However, the subcortical HRFs show significantly faster dynamics comparing with those in early visual cortex, which can imply different neurovascular coupling in subcortical regions. This suggests that a separate characterization for subcortical HRFs is required. Moreover, we found different temporal characteristics between 3T and 9.4T, which may suggest that different component mechanisms exist to produce the BOLD signal in different field strengths.Acknowledgements
This work was supported by NIH K25 HL131997, and NIH R01 NS095933.References
1. Griffeth VE, Buxton RB. A theoretical framework for estimating cerebral oxygen metabolism changes using the calibrated-BOLD method: modeling the effects of blood volume distribution, hematocrit, oxygen extraction fraction, and tissue signal properties on the BOLD signal. Neuroimage 2011; 58: 198-212.
2. Caeyenberghs K, Leemans A, Geurts M, Taymans T, Vander Linden C, Smits-Engelsman B et al. Brain-behavior relationships in young traumatic brain injury patients: fractional anisotropy measures are highly correlated with dynamic visuomotor tracking performance. Neuropsychologia 2010; 48: 1472-1482.
3. Taylor, A.J., Kim, J.H., Ress, D. Characterization of the hemodynamic response function across the majority of human cerebral cortex. NeuroImage 2018;173, 322-331.
4. Kim JH, Ress D. Arterial impulse model for the BOLD response to brief neural activation. NeuroImage 2016; 124: 394-408.
Figures