0534
Negative BOLD responses in the rat visual pathway1Champalimaud Neuroscience Programme, Champalimaud Centre for the Unknown, Lisbon, Portugal
Synopsis
Negative BOLD responses (NBRs) in the rat visual cortex (VC) are reported, for the first time, upon high frequency visual stimulation. So far, in rats, only an attenuation of the positive BOLD response (PBR) in VC had been reported with increase of the stimulus frequency up to 10-12Hz1,2. Here, experiments with very high sensitivity thanks to a cryoprobe operating at 9.4T, reveal NBRs in VC and how they are modulated by hyperoxia (already reported for PBRs3,4). Results suggest the possibility that the neurovascular couplings operating under PBRs and NBRs might not be the same.
Introduction
Previous rodent visual system studies5-11show strong Positive BOLD Responses (PBRs) in superficial layers of the superior colliculus (SC) and lateral geniculate nucleus (LGN). Negative BOLD Responses (NBRs) in Visual Cortex (VC) have been reported for 10 Hz visual stimulation in mice11; however, insofar high frequency stimulation evidenced only a decrease in cortical PBRs in rats1,2,7. Here we report, for the first time, NBRs in VC of the rat when a 15Hz stimulus is presented, and study how they are modulated by hyperoxia. Our findings suggest that the neurovascular couplings operating under PBRs and NBRs might not be the same.Methods
All animal experiments were preapproved by the institutional and national authorities and were carried out according to European Directive 2010/63.
Animal preparation. Adult Female Long Evan rats (n=5) were kept under medetomidine sedation17 while temperature and respiration rate were continuously monitored and remained stable.
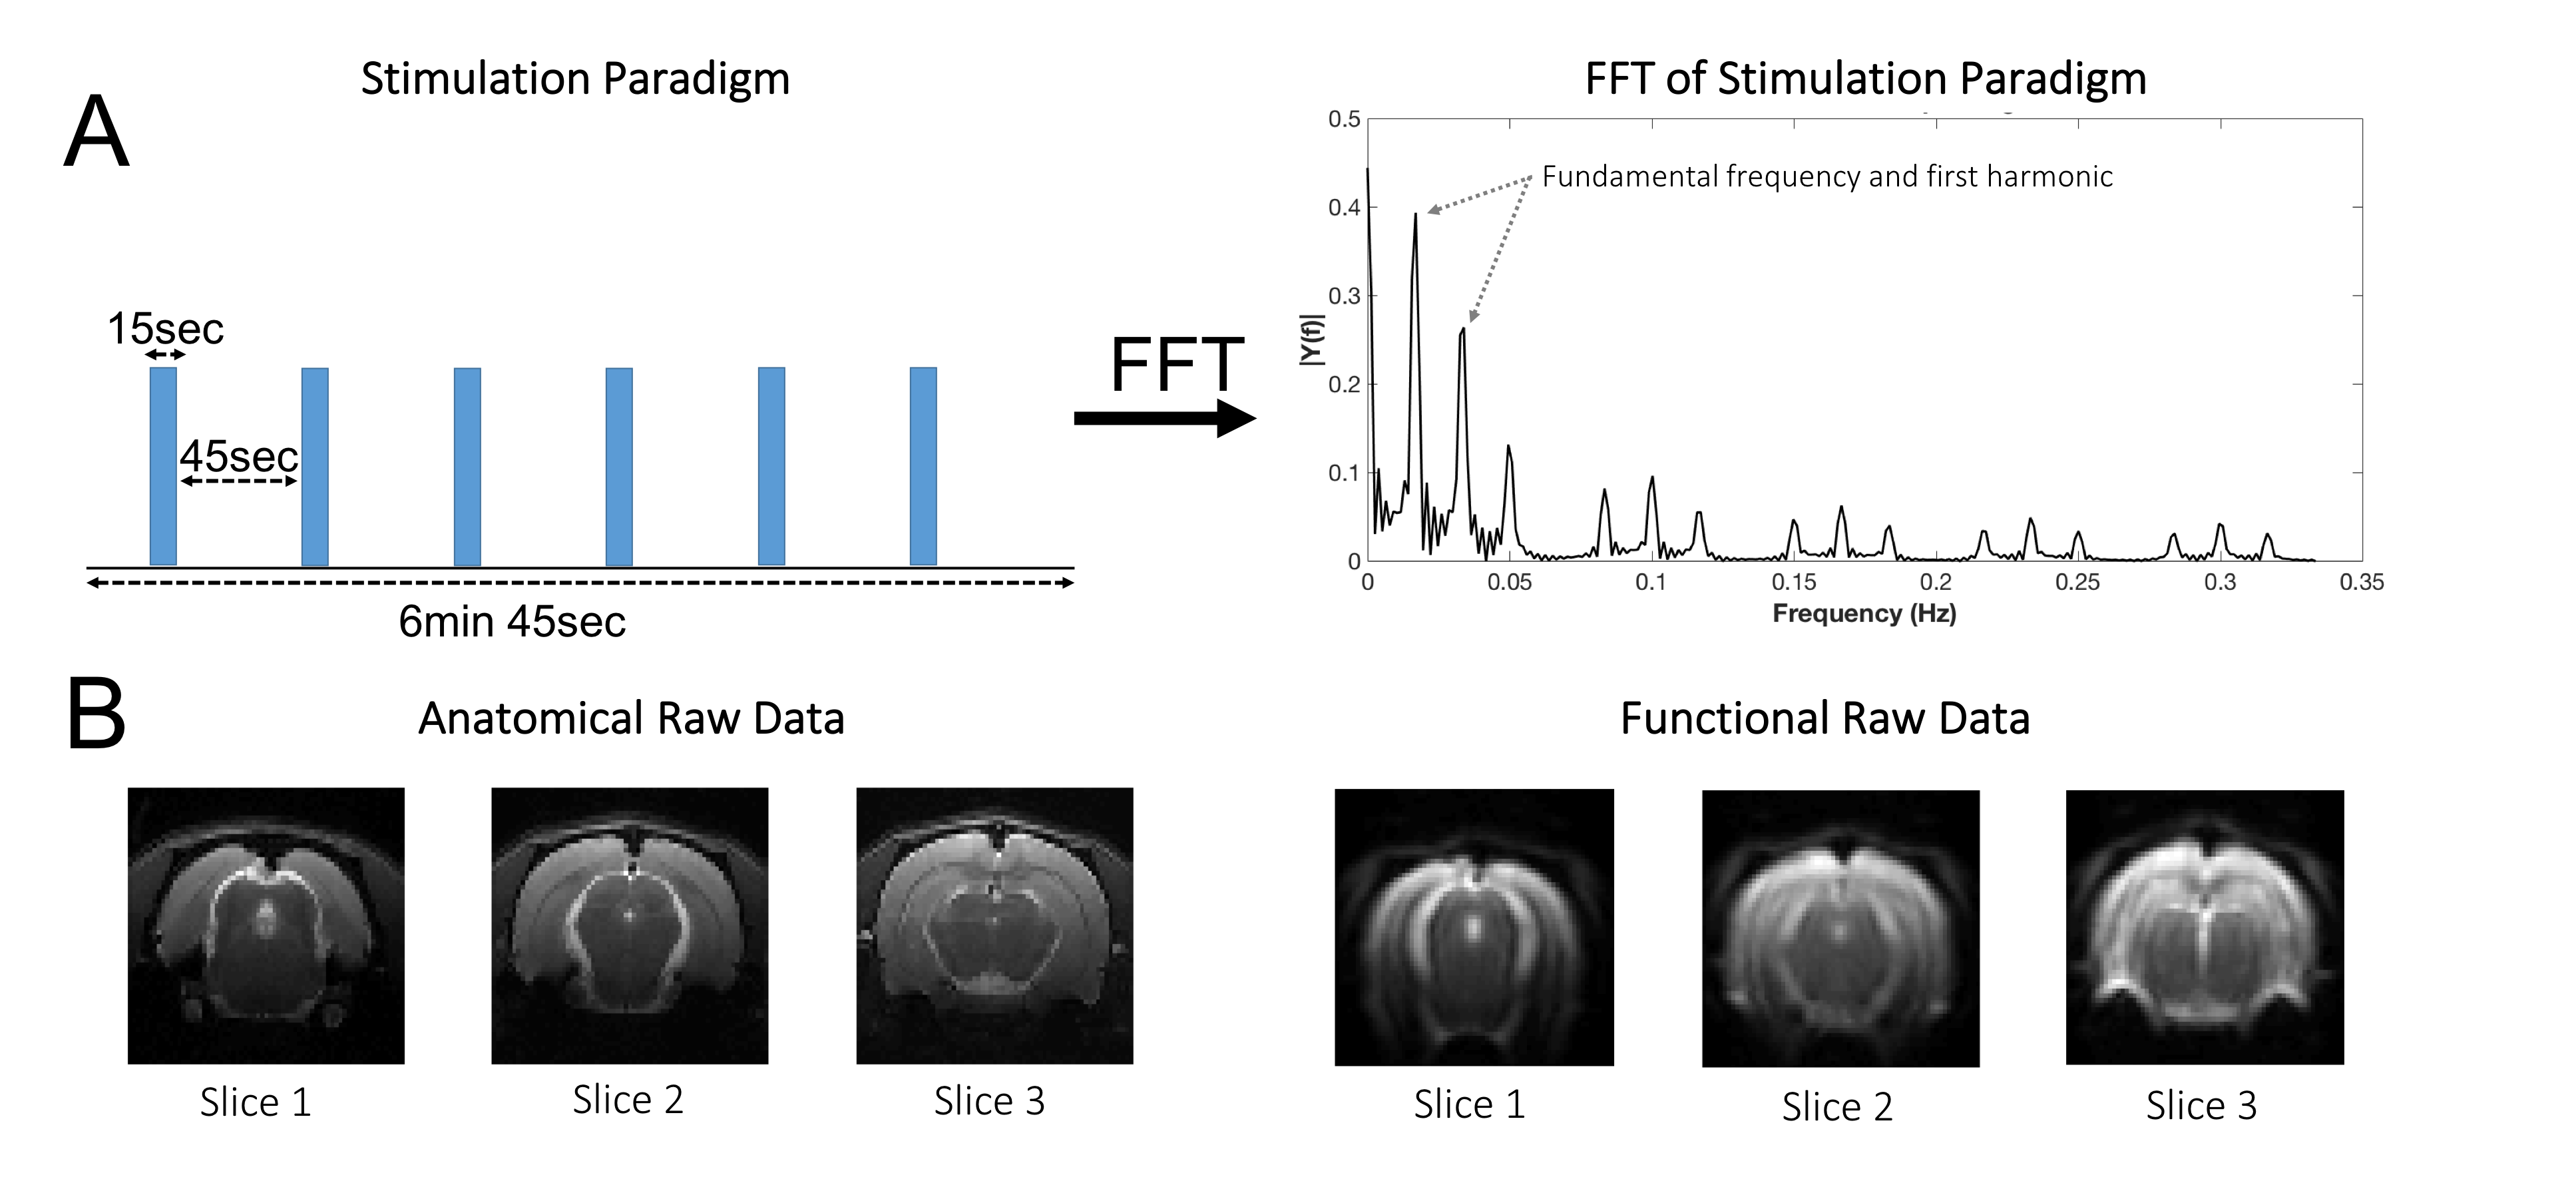
MRI experiments. Images were acquired using a 9.4T BioSpec scanner (Bruker, Karlsruhe, Germany) with an 86mm quadrature resonator for transmittance and a 4-element array cryoprobe20,21 (Bruker, Fallanden, Switzerland) for signal reception. For fMRI, a SE-EPI sequence was used: TE/TR=42.5/1500msec, partial Fourier coefficient 1.5, FOV=18x16.1 mm2, resolution=269x268 μm2, slice thickness=1.5mm, tacq=7min 30sec.
Paradigm design. A 470nm LED (8.1x10⁻¹ W/m2) was used for binocular visual stimulation delivered using two optic fibers placed near the rat eyes. The paradigm consisted of 15sec stimulation (frequency=15Hz; pulse width=670μsec) and 45sec rest, repeated six times (Fig.1A). The paradigm was repeated twice for each condition in a pseudo-random order (except for one animal where only one run per condition was performed) with 7 min of rest between runs.
Hyperoxia challenge. Oxygen percentage was varied between 22%, 28% and 95% and the same experiments as above were repeated after the animals stabilized in breathing rate.
Data analysis. Data was first denoised22, and then analysed using Statistical Parametric Mapping in Matlab®. Slice-timing was corrected using sinc-interpolation. Data were spatially smoothed (3D Gaussian kernel, FWHM=0.2685mm isotropic), realigned to the mean volume and co-registered to an anatomical reference. An HRF (peaking at 1.39 sec) was convolved with the stimulation paradigm prior to General Linear Model (GLM) analysis.The p-value and minimum cluster size thresholds considered for statistical significance were 0.001 and 8, respectively. ROI analysis was performed using anatomically-defined regions.
To avoid assumptions on the HRF, we additionally performed a data-driven spectral analysis as in [23]. The area under the paradigm’s fundamental frequency and first harmonic (Fig.1A) were mapped for every pixel’s Fourier spectrum.
Statistical test were performed using the Kruskal-Wallis test.
Results
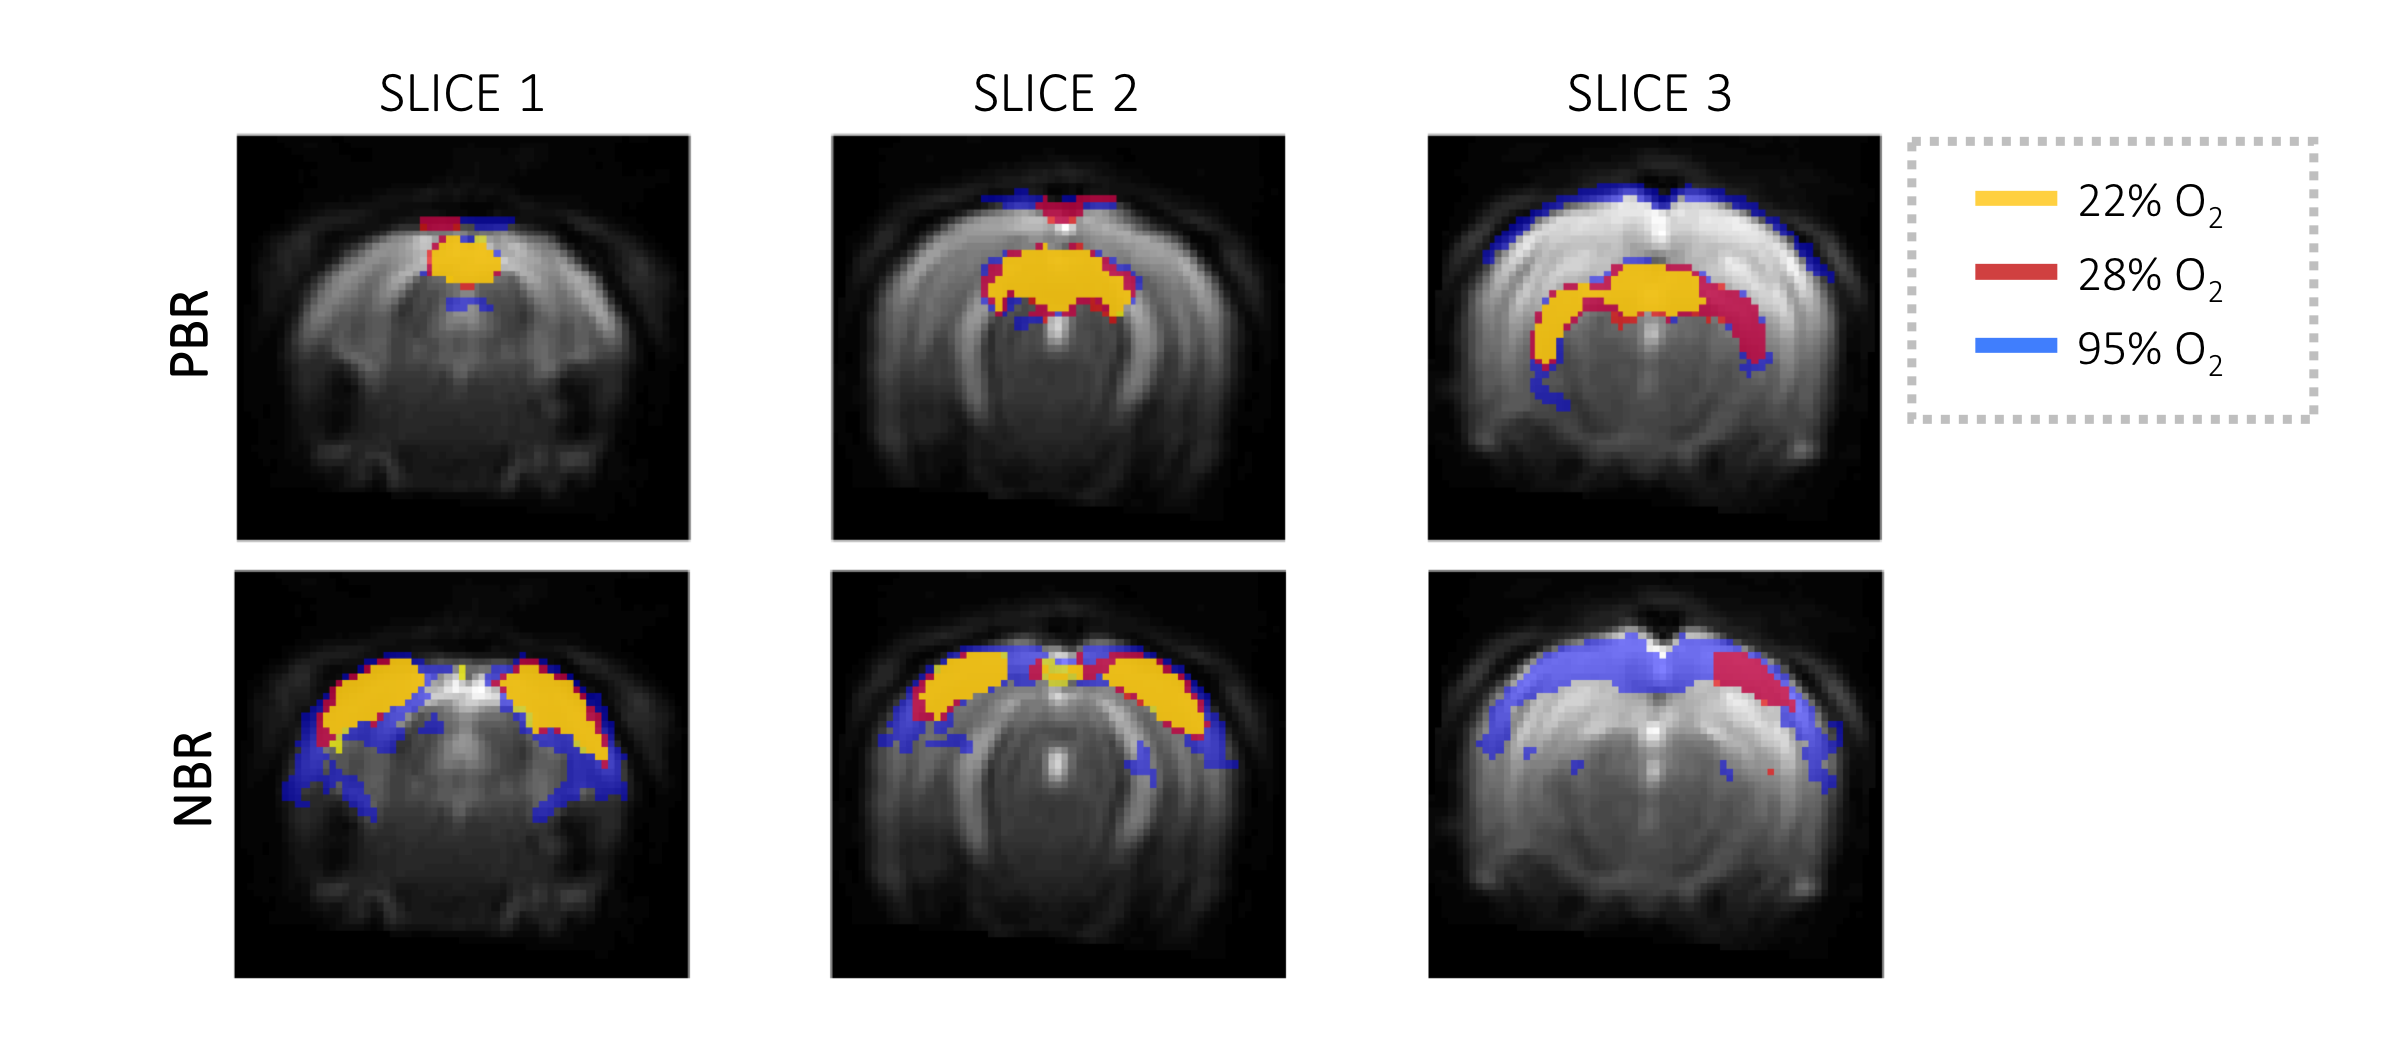
The SNR in the fMRI experiments was rather high: 144.4, 263 and 170.6 in SC, LGN and V1 respectively. Fig.2 shows activation maps derived from GLM analysis, where strong PBRs for SC and LGN can be seen along with NBRs in the VC for all oxygen concentrations. The t-values of NBRs as well as their area increased with increasing oxygen concentration, despite that the stimulus remained constant. Data-driven spectral analysis (Fig.3) revealed very similar patterns as GLM (Fig.2). NBR areas clearly increased with increasing O2 levels. Averaged cycles for different structures are plotted in Fig.4. Higher response magnitudes were observed for PBRs and NBRs with increasing %O2. NBR temporal profiles evidenced oscillations at lower O2 percentage and flatter (yet stronger) responses with increasing oxygen fraction. The NBRs varied significantly (p<0.001) with O2, whereas PBRs varied only between the highest and lowest oxygen concentration (Fig.5).Discussion
We report NBRs in rat VC for the first time (to our knowledge), consistent with previous reports of NBRs in mice11. Previous rat studies showed that high-frequency stimulation attenuated PBRs in rat VC1. However, electrical recordings revealed that multiunit activity remain elevated1,8,12 which leads to the hypothesis that NBRs in rat VC may reflect inhibitory activity.
Since our visual stimulation was identical for all O2 concentrations and no significant oxygen consumption changes upon hyperoxia were reported in humans24, it can be assumed that hyperoxia does not affect neural activity per-se. Therefore, NBR modulations with O2 likely reflect a vascular component. Interestingly, the underlying neurovascular couplings for PBRs and NBRs seem not be mirroring one another. As PBRs were shown to increase with hyperoxia due to increases in oxygenated blood4,11, the same mechanism would decrease the amplitude of NBRs, which contradicts our observations. This suggests potentially interesting differences in neurovascular coupling mechanisms governing PBRs and NBRs
Conclusions
We observed NBRs in the rat VC upon visual stimulation using highly sensitive SE-BOLD experiments. These NBRs were modulated in different ways than PBRs upon oxygen challenges, suggesting different underlying neurovascular coupling mechanisms.Acknowledgements
This study was supported by funding from the European Research Council (ERC) under the European Union’s Horizon 2020 research and innovation programme (Starting Grant, agreement No. 679058) and Fundação da Ciência e Tecnologia (FCT), Portugal (PD/BD/128297/2017). RG would like to thank Dr. Daniel Nunes for the help during the preparation of MRI experiments and animal monitoring and Dr. Rui Simões for the helpful discussions.References
[1] Pawela, Christopher P., et al. "Modeling of region-specific fMRI BOLD neurovascular response functions in rat brain reveals residual differences that correlate with the differences in regional evoked potentials." Neuroimage 41.2 (2008): 525-534.
[2] Van Camp, Nadja, et al. "Light stimulus frequency dependence of activity in the rat visual system as studied with high-resolution BOLD fMRI." Journal of neurophysiology 95.5 (2006): 3164-3170.
[3] Sicard, Kenneth M., and Timothy Q. Duong. "Effects of hypoxia, hyperoxia, and hypercapnia on baseline and stimulus-evoked BOLD, CBF, and CMRO2 in spontaneously breathing animals." Neuroimage 25.3 (2005): 850-858.
[4] Lu, Jie, et al. "Characterization of cerebrovascular responses to hyperoxia and hypercapnia using MRI in rat." Neuroimage45.4 (2009): 1126-1134.
[5] Van Camp, Nadja, et al. "Light stimulus frequency dependence of activity in the rat visual system as studied with high-resolution BOLD fMRI." Journal of neurophysiology 95.5 (2006): 3164-3170.
[6] Lau, Condon, et al. "BOLD responses in the superior colliculus and lateral geniculate nucleus of the rat viewing an apparent motion stimulus." Neuroimage 58.3 (2011): 878-884.
[7] Lau, Condon, et al. "BOLD temporal dynamics of rat superior colliculus and lateral geniculate nucleus following short duration visual stimulation." PLoS One 6.4 (2011): e18914.
[8] Bailey, Christopher J., et al. "Analysis of time and space invariance of BOLD responses in the rat visual system." Cerebral cortex 23.1 (2012): 210-222.
[9] Huang, Wei, et al. "Magnetic resonance imaging (MRI) detection of the murine brain response to light: temporal differentiation and negative functional MRI changes." Proceedings of the National Academy of Sciences 93.12 (1996): 6037-6042.
[10] Lau, Condon, et al. "BOLD Temporal Dynamics of Superior Colliculus and Lateral Geniuclate Nucleus During Monocular Visual Stimulation." Proc. Intl. Soc. Mag. Reson. Med. Vol. 18. 2010.
[11] Niranjan, Arun, et al. "fMRI mapping of the visual system in the mouse brain with interleaved snapshot GE-EPI." Neuroimage 139 (2016): 337-345.
[12] Logothetis, Nikos K., et al. "Neurophysiological investigation of the basis of the fMRI signal." Nature 412.6843 (2001): 150.
[13] Rees, Geraint, Karl Friston, and Christof Koch. "A direct quantitative relationship between the functional properties of human and macaque V5." Nature neuroscience 3.7 (2000): 716.
[14] Heeger, David J., et al. "Spikes versus BOLD: what does neuroimaging tell us about neuronal activity?." Nature neuroscience 3.7 (2000): 631.
[15] Harel, Noam, et al. "Origin of negative blood oxygenation level—dependent fMRI signals." Journal of cerebral blood flow & metabolism 22.8 (2002): 908-917.
[16] Wade, Alex R. "The negative BOLD signal unmasked." Neuron36.6 (2002): 993-995.
[17] Schridde, Ulrich, et al. "Negative BOLD with large increases in neuronal activity." Cerebral cortex 18.8 (2007): 1814-1827.
[18] Moraschi, Marta, Mauro DiNuzzo, and Federico Giove. "On the origin of sustained negative BOLD response." Journal of neurophysiology 108.9 (2012): 2339-2342.
[19] Bandettini, Peter A. "The BOLD plot thickens: sign-and layer-dependent hemodynamic changes with activation." Neuron76.3 (2012): 468-469.
[20] Niendorf, Thoralf, et al. "Advancing cardiovascular, neurovascular and renal magnetic resonance imaging in small rodents using cryogenic radiofrequency coil technology." Frontiers in pharmacology 6 (2015): 255.
[21] Baltes, Christof, et al. "Micro MRI of the mouse brain using a novel 400 MHz cryogenic quadrature RF probe." NMR in Biomedicine: An International Journal Devoted to the Development and Application of Magnetic Resonance In vivo22.8 (2009): 834-842.
[22] Veraart, Jelle, et al. "Denoising of diffusion MRI using random matrix theory." NeuroImage 142 (2016): 394-406.
[23] Nunes, Daniel, Andrada Ianus, and Noam Shemesh. "Layer-specific connectivity revealed by diffusion-weighted functional MRI in the rat thalamocortical pathway." NeuroImage 184 (2019): 646-657.
[24] Kety, Seymour S., and Carl F. Schmidt. "The effects of altered arterial tensions of carbon dioxide and oxygen on cerebral blood flow and cerebral oxygen consumption of normal young men." The Journal of clinical investigation 27.4 (1948): 484-492.
Figures