0530
Resting-State “Physiological” Networks1Athinoula A. Martinos Center for Biomedical Imaging, Massachusetts General Hospital, Boston, MA, United States, 2Department of Radiology, Harvard Medical School, Boston, MA, United States, 3Biomedical Engineering, Boston University, Boston, MA, United States, 4Department of Electrical Engineering and Computer Science, Vanderbilt University, Nashville, TN, United States, 5Harvard-Massachusetts Institute of Technology Division of Health Sciences and Technology, Cambridge, MA, United States
Synopsis
In this abstract, we offer a systemic characterization of the spatiotemporal patterns of fMRI signals subsequent to slow fluctuations in respiratory volume and heart rate. We show that these slow physiological dynamics contain structured network patterns that are somewhat consistent across individuals. We also show that global signal regression (GSR) may introduce anti-correlating patterns of the physiological dynamics to the final observations of functional connectivity.
Introduction
Slow changes in respiratory volume (RV) and heart rate (HR) can elicit considerable fluctuations in fMRI time series[1,2], which may manifest as structured spatial patterns that confound neural signals[3,4]. Yet little effort has been devoted to a systematic investigation of such “physiological” networks—sets of segregated brain regions that exhibit similar physiological responses. Here, by analyzing data from the 3T Human Connectome Project (HCP)[5], we reveal brain-wide and noticeably heterogenous dynamics attributable to RV/HR changes, and identify apparent network-like structures associated with these physiologic dynamics. We further use posterior cingulate cortex (PCC, a primary node of the default mode network (DMN)) centered correlations as an example to demonstrate that, because global signal regression (GSR) does not account for regional heterogeneity, it may not minimize noise, but can instead introduce anti-correlated patterns of these physiological networks to functional connectivity.Methods
1. Regional dynamics following RV and inter-heart-beat-interval (HBI) changes:
Resting-state scans of 190 subjects with clean physiological recordings were chosen from the HCP cohort (first scan of first visit, 3T, 2 mm iso. resolution, TR = 0.72 s). Following the minimal preprocessing pipeline[6], impulse responses triggered by RV and heartbeat interval (HBI) recordings were jointly de-convolved from each voxel’s time series[7] (see Fig. 1 for illustration), termed the respiration response function (RRF) and inverse cardiac response function (iCRF, given that HBI is anticorrelated with HR). Quasi-periodical fluctuations locked to respiratory and cardiac cycles (RETROICOR regressors[8]) were also included in the deconvolution process to account for additional variance in each voxel. Structured spatial patterns within both RRF and iCRF (averaged across 190 subjects) dynamics were further characterized by K-means clustering.
2. PCC-centered respiratory networks:
Datasets containing pure RV dynamics (and no neural dynamics) were synthesized by convolving the RV waveforms recorded from each subject (of the HCP cohort) with the voxel-wise RRFs averaged across all subjects. PCC-centered correlations were computed for both the synthesized RV dynamics (PCC-RV) and for each subject’s real data (PCC-FC) post RETROICOR correction, with and without GSR.
3. Influence of RV fluctuations on PCC-centered correlations (post GSR):
Breath-holding (BH) tasks with different BH periods (8 s and 2 s) were used to introduce two different task conditions that induce different fractional contributions of RV changes to the global signal but exert comparable attentional load and expectation in the subjects (illustrated in Fig. 5 A). Five subjects participated in this experiment (functional scans were collected in a 3T Siemens Prisma scanner using EPI with blipped-CAIPI[9], TR/TE/FA = 1030ms/31ms/53o, voxel size = 2.5 mm iso., SMS factor = 3). PCC-centered correlations after GSR were compared between the two scans for each individual.
Results
1. We identified consistent spatiotemporal patterns of RRFs and iCRFs across subjects (Fig. 2). Notably, fluctuations linked with both RV and HBI changes exhibit heterogeneous amplitudes and delays across the brain. Using K-means clustering, we next found that these structured physiological patterns are spatially organized in ways that can resemble networks (Fig. 3). When dividing into two clusters (k = 2), RRF dynamics were separated into two major networks: one comprising primary sensory regions (‘red’) and the other covering frontal-parietal regions that are commonly involved in higher cognitive functions (‘blue’). In the iCRF dynamics, we observed a clear division between cortical regions and ventricles. Higher values of k continues to resolve symmetric spatial patterns with distinguishable physiologic dynamics.
2. A clear similarity is observed between PCC-RV and PCC-FC without GSR (Fig. 4A), consistent with previous reports[1]. However, as GSR does not capture spatially heterogeneous physiological fluctuations, it induces two opposing set s of brain regions whose spatial topologies closely resemble RRF networks seen at k = 2 (Fig. 4B) in our synthesized respiratory-only dataset. It is noteworthy that regions of negative correlations within PCC-RV and PCC-FC after GSR overlap extensively, implying that PCC-centered anti-correlations can result from structured patterns of physiologic noise[10].
3. We next used two BH tasks in order to manipulate the fractional contribution from respiratory effects to global fMRI signals, and found that higher fractional contributions from RV effects result in stronger PCC anti-correlations (Fig. 5, comparing the 8-s BH case to the 2-s BH case), in agreement with our simulations.
Conclusions
Here we have characterized the spatiotemporal patterns of fMRI signals subsequent to RV and HR changes, and showed that such dynamics can give rise to apparent “physiological” networks that are somewhat consistent across individuals, the biological origins of which remain unclear. We further show that GSR may not de-noise fMRI data effectively, but in turn introduce anti-correlating network patterns that originate from physiological sources.Acknowledgements
This work was supported in part by the NIH NIBIB (grants P41-EB015896 and R01-EB019437), by the BRAIN Initiative (NIH NIMH grants R01-MH111438 and R01-MH111419), and by the MGH/HST Athinoula A. Martinos Center for Biomedical Imaging; and was made possible by the resources provided by NIH Shared Instrumentation Grants S10-RR023043 and S10-RR019371. Data were provided in part by the Human Connectome Project, WU-Minn Consortium (Principal Investigators: David Van Essen and Kamil Ugurbil; 1U54MH091657) funded by the 16 NIH Institutes and Centers that support the NIH Blueprint for Neuroscience Research; and by the McDonnell Center for Systems Neuroscience at Washington University.References
[1] Birn, R. M., Diamond, J. B., Smith, M. A., & Bandettini, P. A. (2006). Separating respiratory-variation-related fluctuations from neuronal-activity-related fluctuations in fMRI. Neuroimage, 31(4), 1536-1548.
[2] Shmueli, K., van Gelderen, P., de Zwart, J. A., Horovitz, S. G., Fukunaga, M., Jansma, J. M., & Duyn, J. H. (2007). Low-frequency fluctuations in the cardiac rate as a source of variance in the resting-state fMRI BOLD signal. Neuroimage, 38(2), 306-320.
[3] Tong, Y., Hocke, L. M., Fan, X., & Janes, A. C. (2015). Can apparent resting state connectivity arise from systemic fluctuations?. Frontiers in human neuroscience, 9, 285.
[4] Bright, G. M., Murphy, K. (2014). Spatially coupled functional and vascular networks. ISMRM, Milan, Italy.
[5] David C. Van Essen, Stephen M. Smith, Deanna M. Barch, Timothy E.J. Behrens, Essa Yacoub, Kamil Ugurbil, for the WU-Minn HCP Consortium. (2013). The WU-Minn Human Connectome Project: An overview. NeuroImage 80(2013):62-79.
[6] Glasser, M. F., Sotiropoulos, S. N., Wilson, J. A., Coalson, T. S., Fischl, B., Andersson, J. L., ... & Van Essen, D. C. (2013). The minimal preprocessing pipelines for the Human Connectome Project. Neuroimage, 80, 105-124.
[7] Chang, C., Cunningham, J. P., & Glover, G. H. (2009). Influence of heart rate on the BOLD signal: the cardiac response function. Neuroimage, 44(3), 857-869.
[8] Glover, G. H., Li, T. Q., & Ress, D. (2000). Image‐based method for retrospective correction of physiological motion effects in fMRI: RETROICOR. Magnetic Resonance in Medicine: An Official Journal of the International Society for Magnetic Resonance in Medicine, 44(1), 162-167.
[9] Setsompop, K., Gagoski, B. A., Polimeni, J. R., Witzel, T., Wedeen, V. J., & Wald, L. L. (2012). Blipped‐controlled aliasing in parallel imaging for simultaneous multislice echo planar imaging with reduced g‐factor penalty. Magnetic resonance in medicine, 67(5), 1210-1224.
[10] Murphy, K., Birn, R. M., Handwerker, D. A., Jones, T. B., & Bandettini, P. A. (2009). The impact of global signal regression on resting state correlations: are anti-correlated networks introduced?. Neuroimage, 44(3), 893-905.
Figures
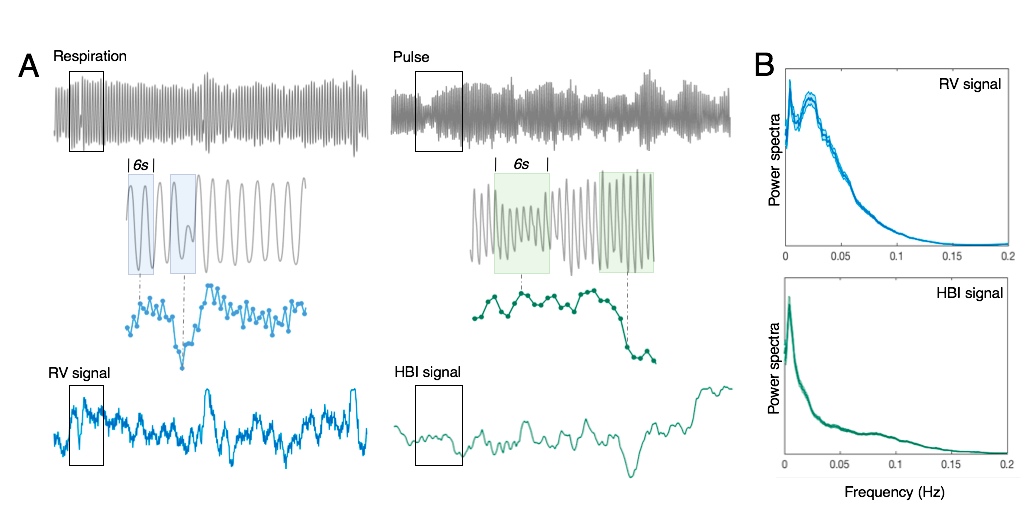
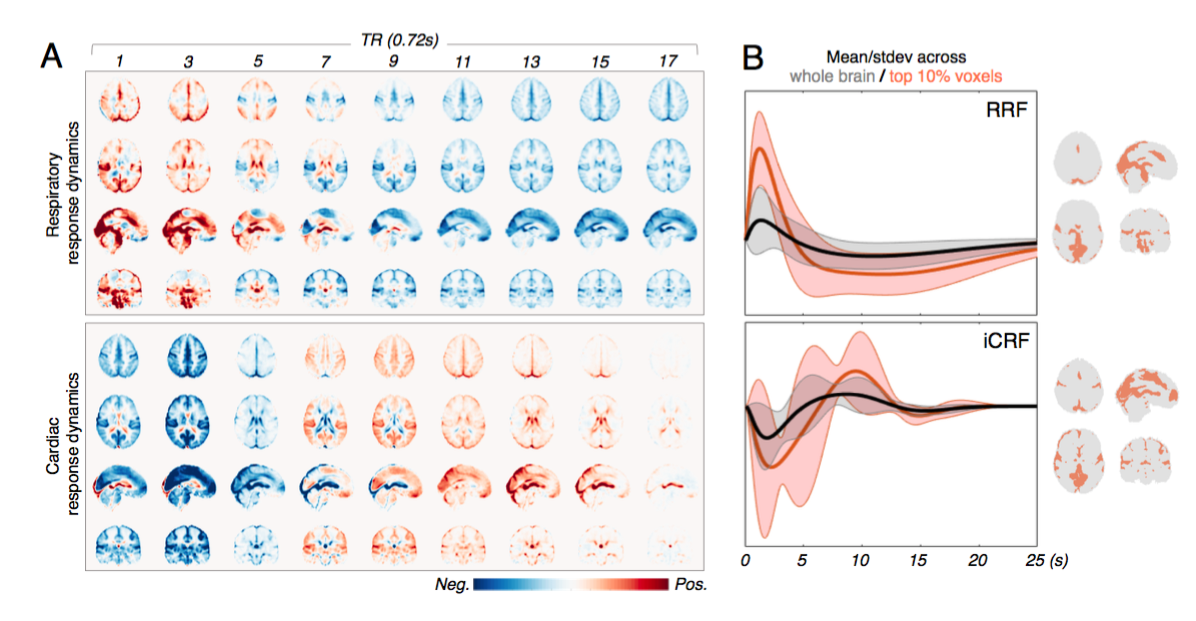
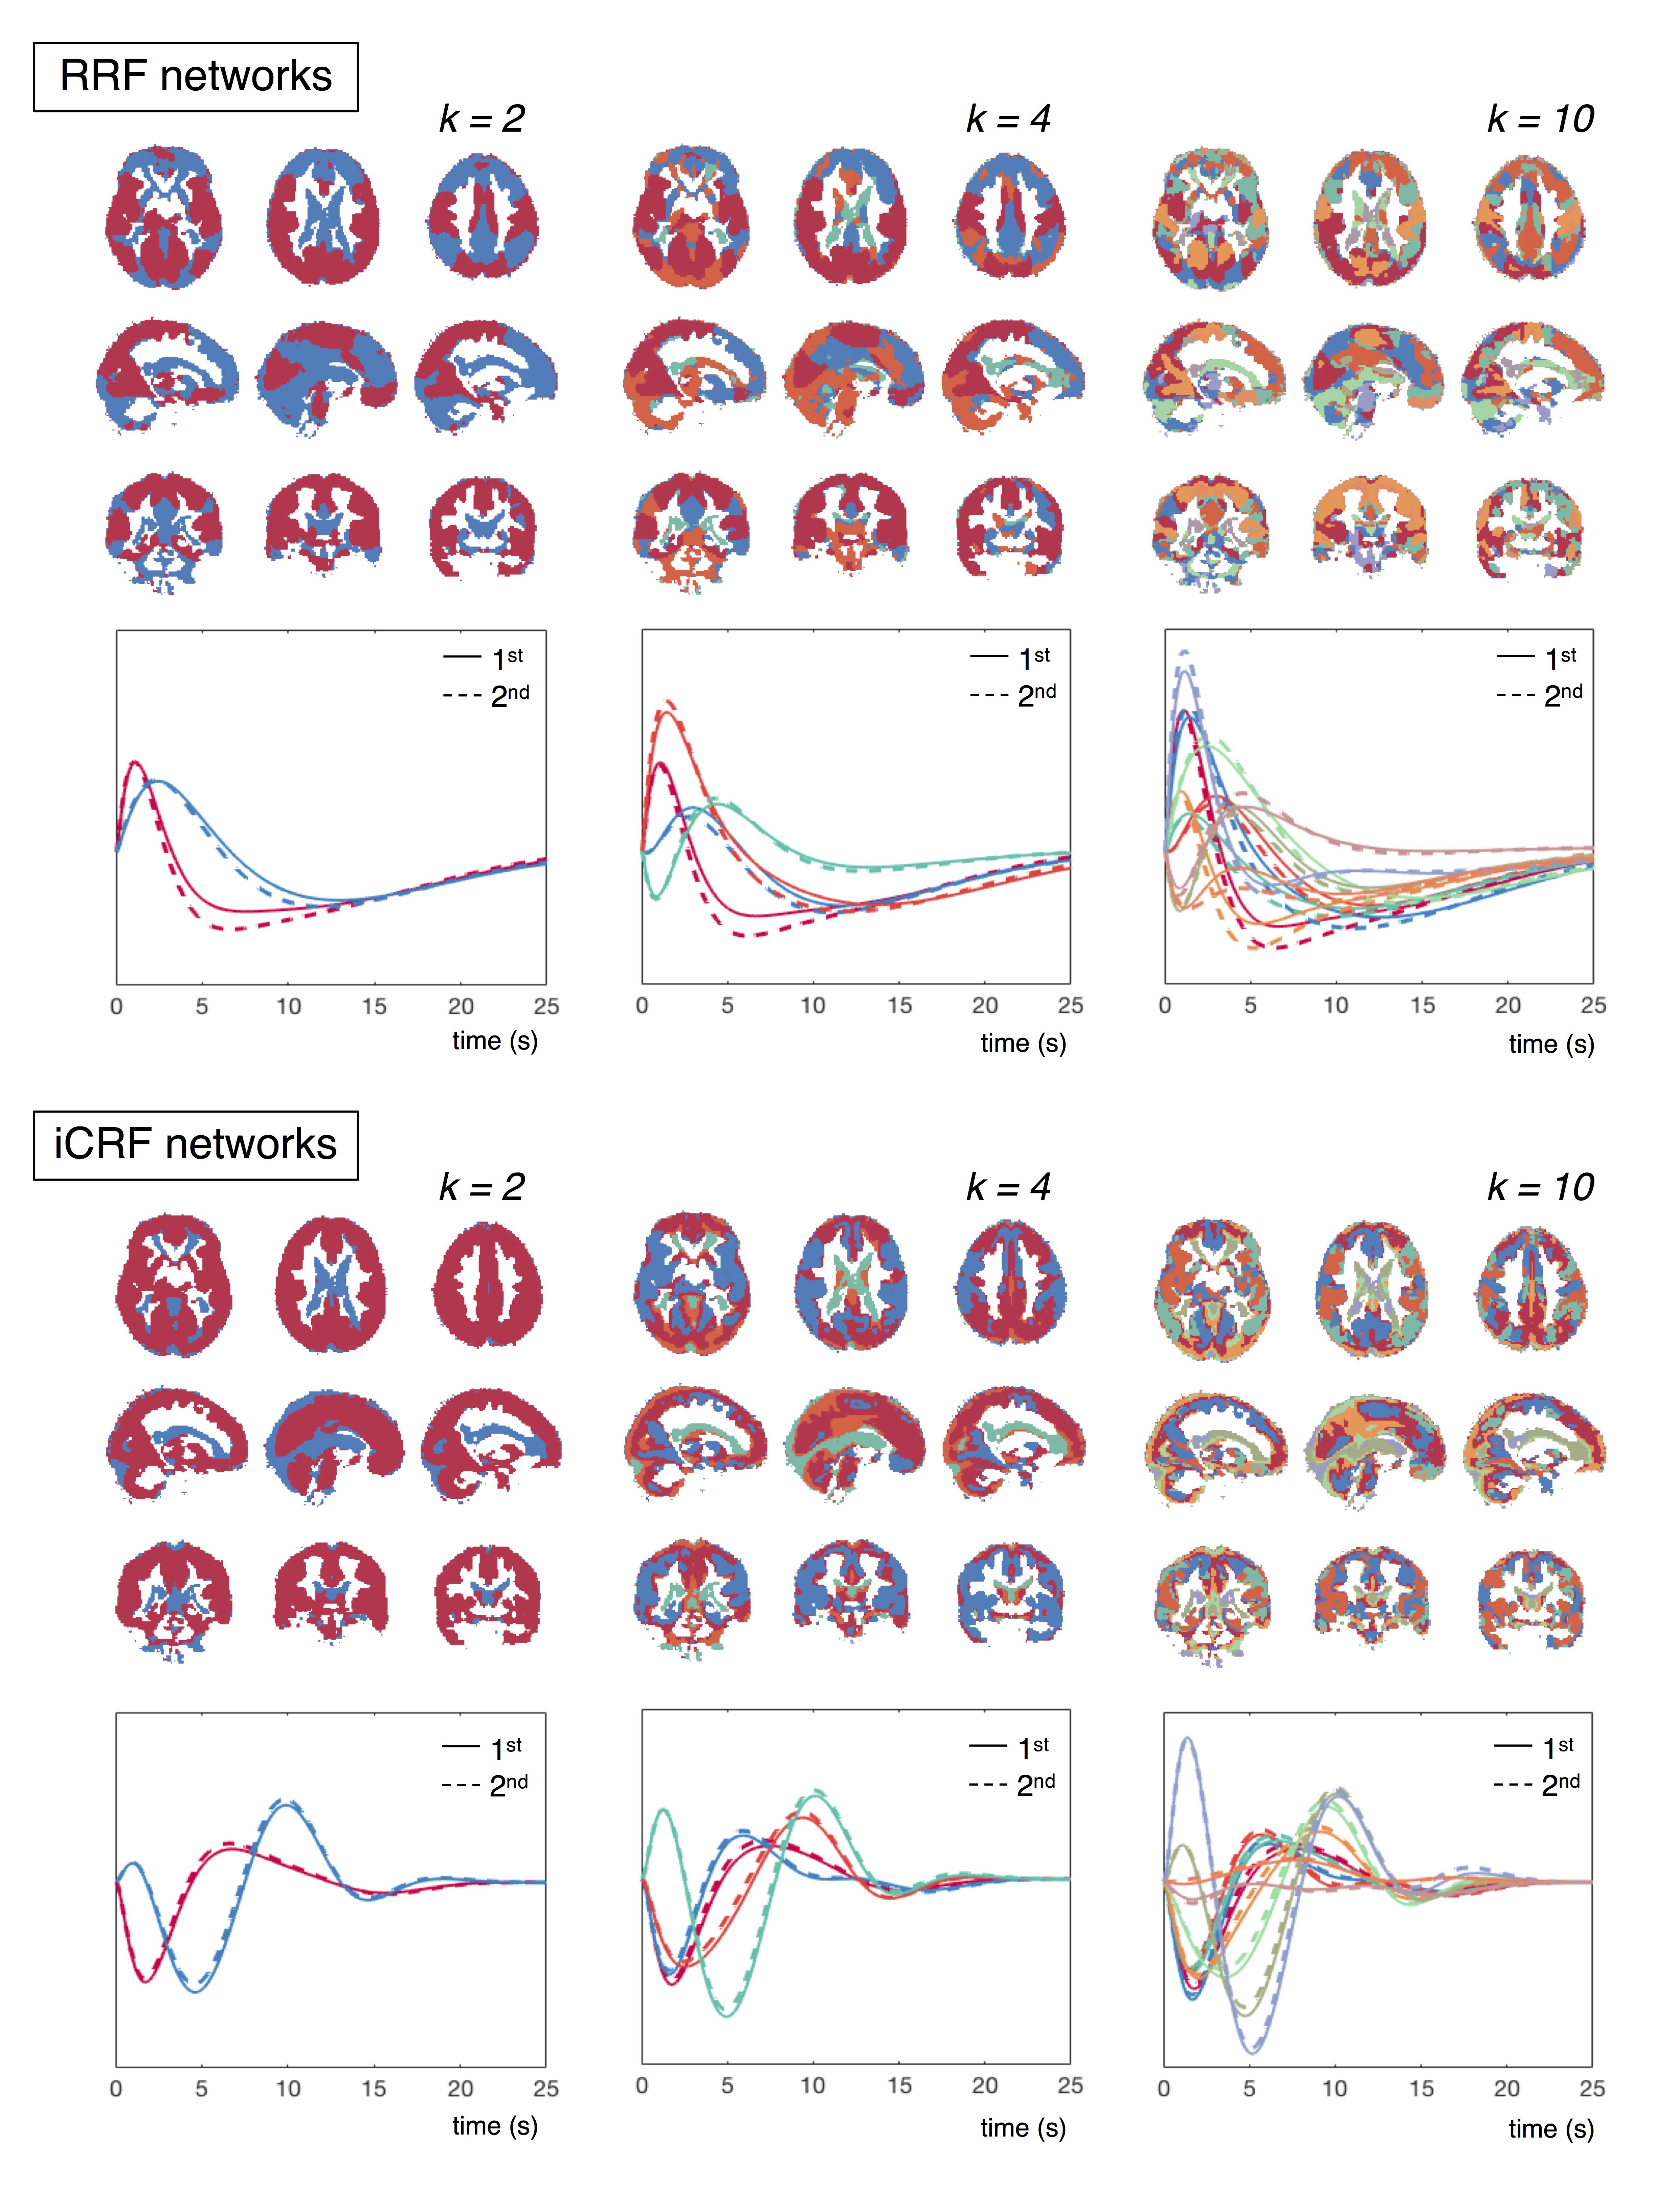
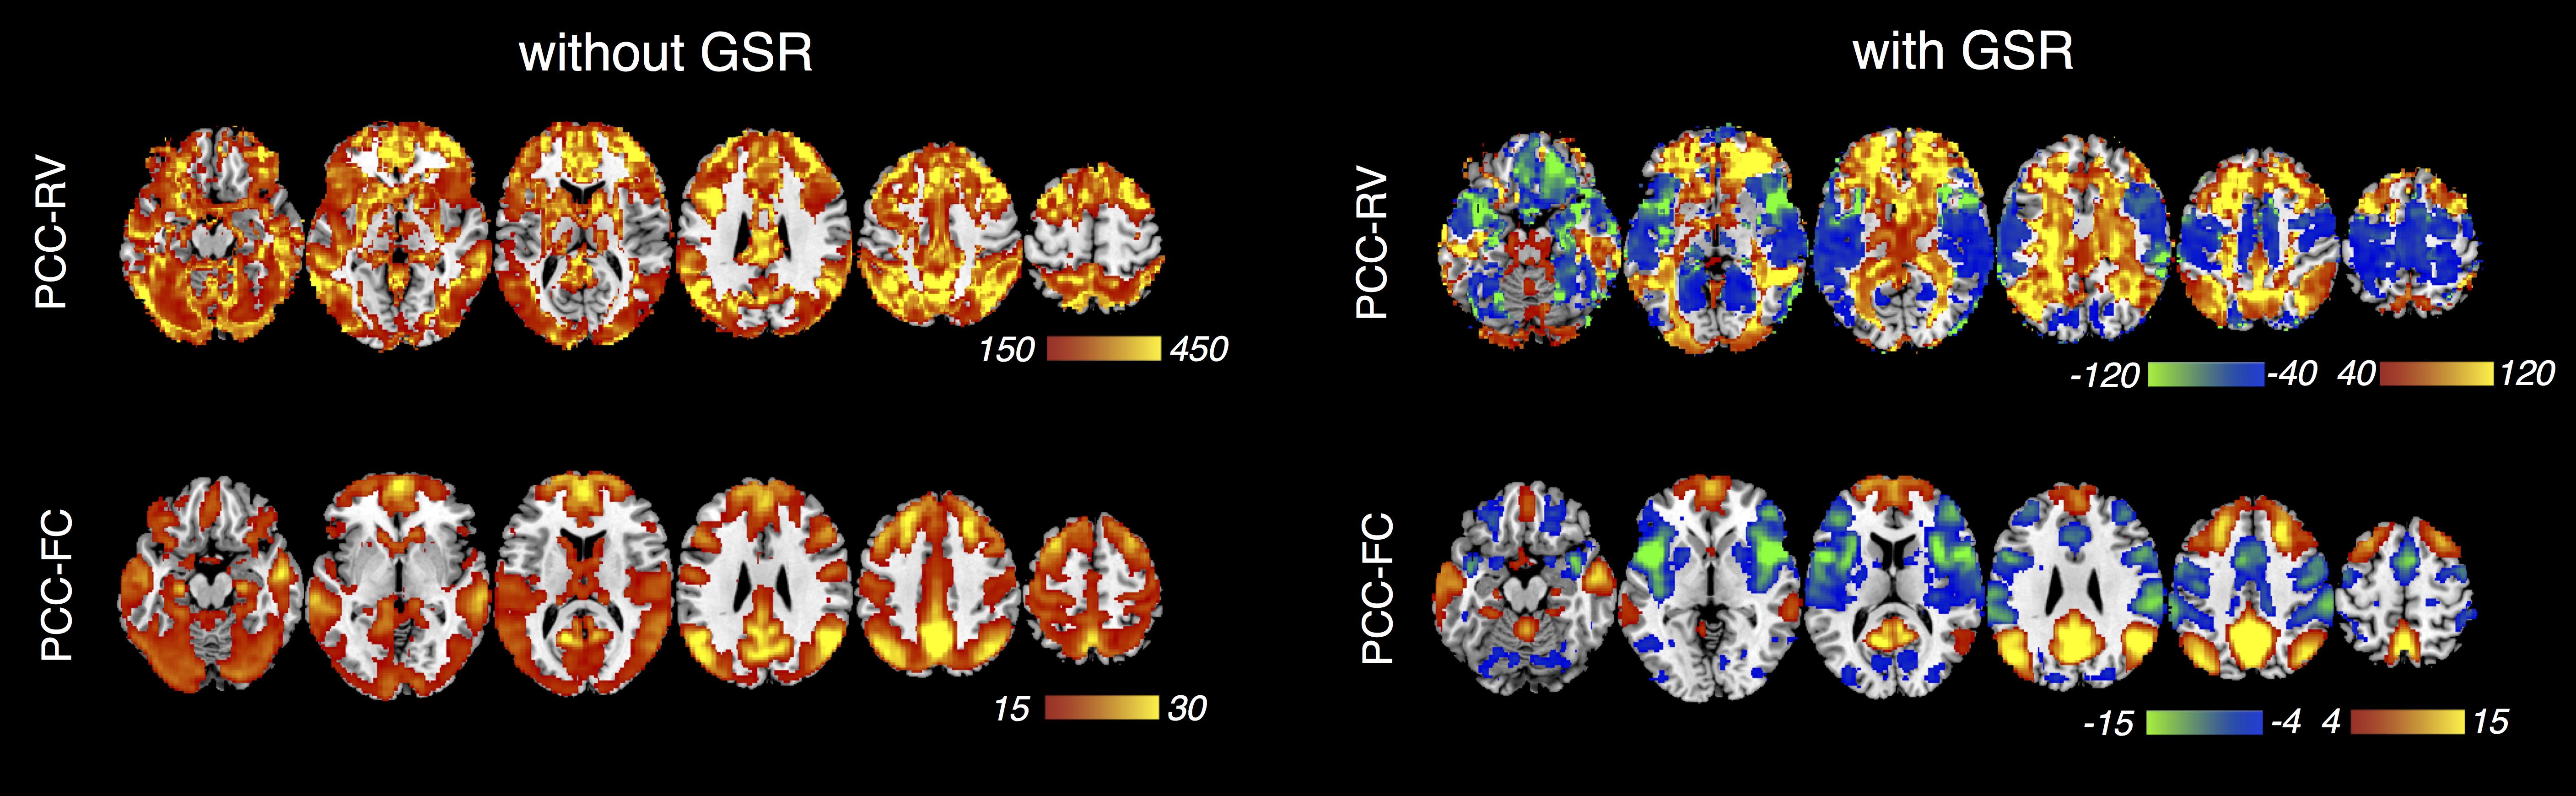
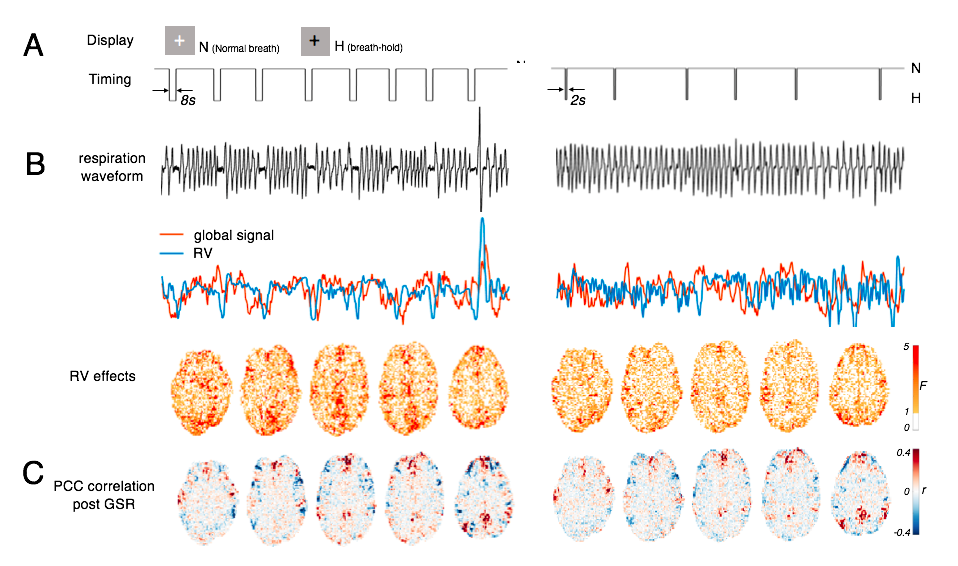
Fig. 5: Influence of fractional contribution from RV effects (imposed by BH challenge) on PCC-centered anti-correlations post-GSR, in a representative subject. (A) Display and timing of the BH tasks; (B) 8s-BH case introduces a larger factional contribution from RV to fMRI signals compared to the 2s-BH case; (C) PCC-centered anti-correlations are stronger in the 8s-BH case post-GSR.