0528
Using Quantitative MT- and CEST-derived Metrics to Evaluate Longitudinal Tissue Changes in the Spinal Cord of Multiple Sclerosis Patients at 3T1Department of Biomedical Engineering, Vanderbilt University, Nashville, TN, United States, 2Vanderbilt University Institute of Imaging Science, Nashville, TN, United States, 3Phillips Healthcare, Baltimore, MD, United States, 4University of Oxford, Oxford, United Kingdom, 5Department of Neurology, Vanderbilt University, Nashville, TN, United States, 6Department of Radiology and Radiological Science, Vanderbilt University, Nashville, TN, United States
Synopsis
Conventional T1 and T2 weighted MRI are ubiquitously used to diagnose and monitor disease progression in multiple sclerosis, but are only sensitive to later-stage inflammatory lesions and atrophy. Imaging biomarkers sensitive to tissue changes earlier in disease pathology may have significant implications in the diagnosis and prognosis of MS. Quantitative magnetization transfer (qMT) and chemical exchange saturation transfer (CEST) MRI have shown sensitivity to macromolecules and tissue biochemistry, respectively. In this work, we investigate quantitatively derived metrics from qMT and CEST as potential biomarkers for pathological changes which precede lesion formation.
Introduction
Multiple sclerosis is an autoimmune disorder of the central nervous system characterized by demyelination, inflammation, and axonal degeneration. Research has shown that the spinal cord accumulates tissue damage resulting in neurological deterioration longitudinally in MS patients [1]. Conventional clinical MRI is sensitive to late-stage inflammatory lesions and tissue atrophy, but are often poor indicators of disease progression and do not report on underlying pathophysiology of MS. Quantitative MRI biomarkers capable of detecting tissue changes earlier in the disease pathology may have significant implications in the diagnosis, prognosis, and treatment of MS. Quantitative magnetization transfer (qMT) and chemical exchange saturation transfer (CEST) MRI have shown sensitivity to macromolecules and tissue biochemistry, respectively. qMT can be used to derive the pool-size-ratio (PSR), which is well correlated to white matter myelin density[2] which is lost during later stages of MS. Amide proton transfer (APT) CEST provides information on the concentration of proteins and peptides[3], which may be elevated during the early stages of MS prior to lesion formation. We hypothesized that observing the longitudinal changes in quantitative indices derived from these two modalities would reveal information on MS disease progression and potentially provide a biomarker sensitive to underlying tissue changes concomitant with inflammatory lesions.Methods
Three healthy volunteers (2F/1M, 39±10 years of age) and four mildly-affected relapsing remitting MS patients (2F/2M, 40±8 years of age, EDSS 0-1) participated in the study after informed consent. MS subjects were brought back for a follow up scan after 1.24 years on average. All images were obtained using a 3T whole body scanner (Philips, Best, The Netherlands). A single slice between the C3 and C4 vertebrae was acquired and all images were registered to a multi-slice, multi-echo gradient echo image (mFFE). The CEST sequence consisted of a single 150ms 2µT saturation pulse acquired at 36 asymmetric offset frequencies between ±5 ppm and corrected for respiration according to By et al[4]. Additional parameters include: FOV =160 x160 mm2, voxel size =1mm x 1mm, SENSE=2(RL), TR/TE=305/12ms, α=20°, NSA=5. The CEST results were quantified using a respiratory-corrected APT asymmetry shown in By et al[4]. The MT weighted images were acquired using a 3D MT-prepared spoiled gradient echo sequence with a GRE readout at 8 offsets and 2 powers. Additional parameters include: FOV=150 x 150 mm2, voxel size=1mm x 1mm, SENSE=2(RL), TR/TE=50/2.3ms, α=6°, NSA=5. qMT parameters were generated using the full fit model described in Yarnykh et al[5].Results
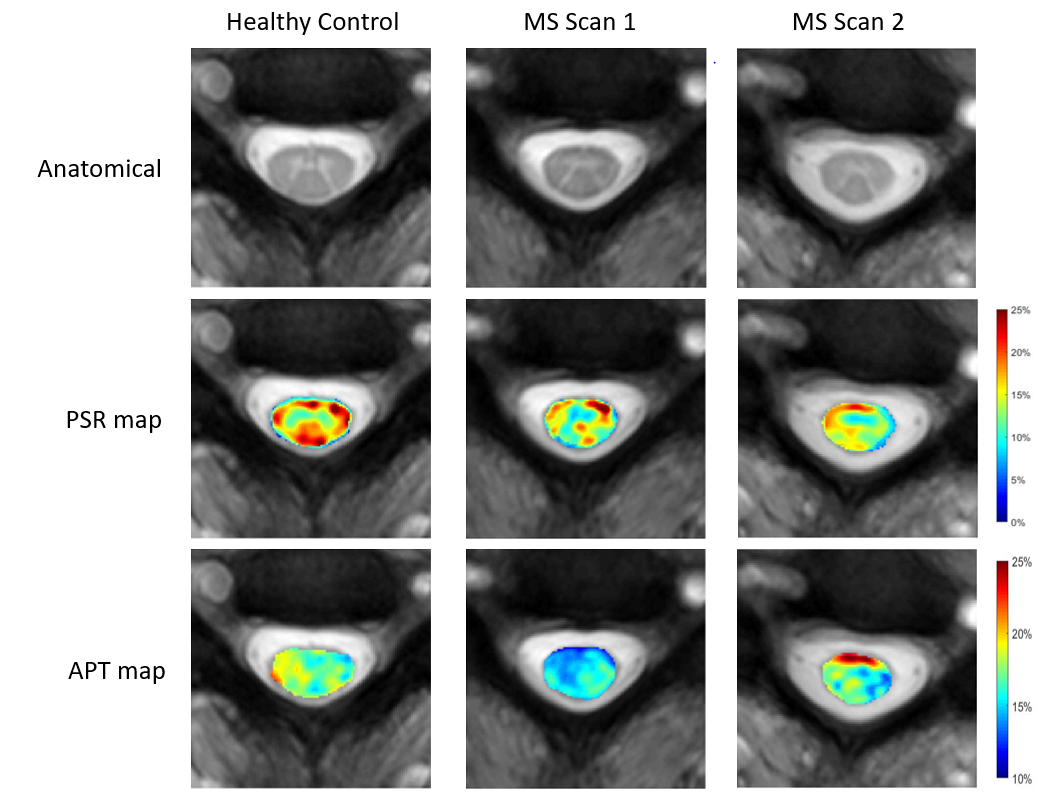
We observed a decrease in both APTasym and PSR between scans (ΔAPTasym = -2.37%, ΔPSR = -1.34%). In patients with no increase in EDSS score, a repeated measure, non-parametric ANOVA revealed no significant change between scans. A single MS patient had an increase in disability score between scans, from an EDSS score of 0 to 1. This subject displayed the largest change in APTasym (ΔAPTasym = 5.98%) and was the only patient whose APTasym increased between scans, but showed only a minimal change in PSR (ΔPSR = 1.3%). Metrics at time point 2 from the MS group were compared to healthy controls, and we found significant differences for APTasym in the dorsal column (p<0.05), though not in the PSR. Figure 1 shows scans 1 and 2 from a representative MS patient compared to a healthy control subject. Anatomical scans show little difference between MS and control subject, and the repeat scan shows very little change. PSR maps are lower in the MS subject, and we see a mild decrease at Scan 2. The APTasym maps display the largest difference between control and MS, and values increase dramatically between scans.Discussion
All of our subjects exhibited low clinical disability, and no lesions were identified within the region of interest. Excluding the single subject whose EDSS score increased to 1 prior to the second scan, all other subjects had an EDSS score of 0 at both time points. This is important to note that CEST shows tissue abnormality even in the absence of overt lesions and at low EDSS, whereas PSR appeared relatively normal. This further strengthens our hypothesis that CEST detects tissue changes prior to lesion formation and prior to demyelination. Furthermore, these patients early in disease lack identifiable spinal cord lesions and suffer from the lack of sensitivity of clinical scans. Traditional T1 and T2-weighted imaging shows no changes in these subjects, and even in our high-contrast mFFE we see minimal changes between scans. Our results, however, suggest that quantitative MRI contrast approaches such as the methods presented here are capable of detecting sub-voxel, molecular tissue changes early in MS development.Acknowledgements
National MS Society Conrad Hilton Foundation R21 (NIH/NINDS 1R21NS087465-01)References
1. Popescu, B.F.G., I. Pirko, and C.F. Lucchinetti, Pathology of multiple sclerosis: where do we stand? Continuum (Minneapolis, Minn.), 2013. 19(4 Multiple Sclerosis): p. 901-921.
2. Davies, G.R., et al., Estimation of the macromolecular proton fraction and bound pool T2 in multiple sclerosis. Mult Scler, 2004. 10(6): p. 607-13.
3. Zhou, J., et al., Using the amide proton signals of intracellular proteins and peptides to detect pH effects in MRI. Nat Med, 2003. 9(8): p. 1085-90.
4. By, S., et al., Amide proton transfer CEST of the cervical spinal cord in multiple sclerosis patients at 3T. Magn Reson Med, 2018. 79(2): p. 806-814.
5. Yarnykh, V.L., Pulsed Z-spectroscopic imaging of cross-relaxation parameters in tissues for human MRI: theory and clinical applications. Magn Reson Med, 2002. 47(5): p. 929-39.
Figures