0527
7T MRI Shows Enlarged Anterior Vein in the Spinal Cord of Multiple Sclerosis Patients1Vanderbilt University Institute of Imaging Science, Nashville, TN, United States, 2Harpeth Hall High School, Nashville, TN, United States, 3Neuroscience Graduate Program, Vanderbilt University, Nashville, TN, United States, 4Department of Radiology, Monroe Carell Jr Children's Hospital at Vanderbilt, Nashville, TN, United States
Synopsis
T2*-weighted Gradient Echo (T2*FFE) were collected at 7-Tesla in patients with relapsing-remitting multiple sclerosis (MS) and healthy controls for a more detailed image of the spinal cord, specifically the vasculature of the spinal cord. Analyzing the anterior vein may provide insight into the connection between the vasculature and lesion presence in the spinal cord of MS patients. Our results demonstrate significantly enlarged anterior veins in MS patients compared to healthy controls. The anterior vein in the spinal cord has not been studied in great detail prior to this study.
Introduction
Multiple sclerosis (MS) is a debilitating disease that causes microstructural and axonal changes within the spinal cord that can be hard to detect with conventional MRI. However, higher field strength and advanced imaging techniques reveal a more detailed picture of the spinal cord including the vasculature of the cord. A study by Daniel Reich et al. determined the Central Vein Sign (CVS) within white-matter lesions to be a biomarker of MS in the brain1. The CVS is an indication of an interaction between antigen-presenting cells and other immune cells within the perivascular space, thus leading to axonal and tissue degradation surrounding the vein. They also demonstrated a relationship between lesion presence and vascular involvement after observing enlarged extralesional parenchymal veins in the brains of MS patients2. As of now, there have been no studies confirming whether or not the perivascular involvement is present in the spinal cord of MS patients. We hypothesize that the anterior vessel of the spinal cord appears larger in MS patients than healthy individuals due to the prevalence of blood materials surrounding the vein. Leaky, porous blood veins in MS patients may be correlated to the presence of lesions in the spinal cord. Increased porosity could lead to immune cells traveling to and attacking the myelin near the leaky vein, leading to a lesion in the area.Methods
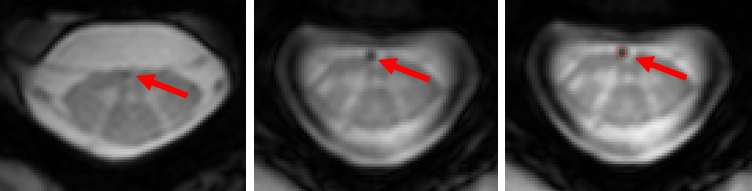
Acquisition: 19 healthy volunteers and 32 relapsing-remitting (RR) MS patients (EDSS ranged from 0 to 6) were scanned at 7 Tesla (Achieva, Philips Medical Systems) using a T2*-weighted Gradient Echo (T2*FFE) with 0.5 x 0.5 x 4mm3 resolution3. A region of interest (ROI) was drawn in MIPAV around the anterior vein in 20 spinal cord slices per subject. The ROI masks were processed in MATLAB before further analysis in Microsoft Excel in order to determine the cross-sectional area (CSA) of each slice between the second vertebrae of the cervical spine (C2) and the sixth vertebrae of the cervical spine (C6). The references to the cord within the calculations included the number of MRI slices between C2 and C6 (Nsl) and the number of slices multiplied by the slice thickness of 4mm (total volume or Vtot). Our equations included:
- Normalized Sum CSA of Drawn ROI: $$Sum CSA/Vtot$$
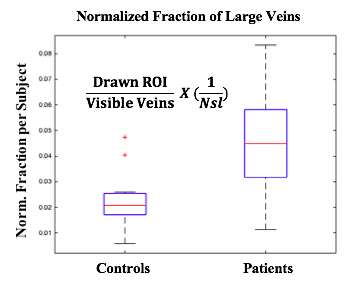
- Normalized Fraction of Large Veins: $$(Drawn ROI/Visible Veins) * (1/Nsl)$$
These two tests were determined to be the most effective in demonstrating a significant relationship between multiple sclerosis and enlarged anterior veins in the spinal cord. The normalized sum CSA of the drawn ROIs was used as a measurement of the size of the vein in the spinal cord by extracting the summed area of the total slices. The normalized fraction of large veins provided a similar measure to determine the number of large veins per overall visible veins in the spinal cord while compensating for neck length.
Results and Conclusions
We show a significant difference (p = <0.05) between the anterior spinal cord vein in the spinal cord of MS patients compared to healthy controls. The anterior vein in the spinal cord was larger and more frequently observed in MS patients compared to the controls. Our two-tail statistical analysis results (T<=t) were: p = 0.0180 for Normalized Sum CSA and p = 0.0001 for Normalized Fraction of Large Veins. The mean for those categories was also greater in the patients compared to the healthy controls. This study suggests that multiple sclerosis patients have both a greater average spinal cord slice CSA and more slices demonstrating enlarged vessels (more frequent slices with large CSA) compared to the controls. The enlarged vein in MS patients could serve as an additional marker for early disease diagnosis as well as a target for blood-flow related drugs (e.g. statins). Future studies should include an analysis of the relationship between vein size and disease severity as well as a longitudinal study on the prevalence of enlarged spinal cord veins in young adults and their likelihood of developing MS. We would also like to utilize the 7-Tesla MRI to better understand the relationship between lesion load and vessel size in the MS spinal cord.Acknowledgements
Thank you to the VUIIS Radiology Technologists, John Gore, Ben Conrad, and Aashim Bhatia for their efforts surrounding this project. I would also like to thank Seth Smith for his continued guidance and mentorship.References
1. D. Reich et al (2016). The Central Vein Sign and Its Clinical Evaluation for the Diagnosis of Multiple Sclerosis. Nature Reviews Neurology 12: 714-722
2. D. Reich et al (2013). Multiple Sclerosis Shrinks Intralesional, and Enlarges Extralesional, Brain Parenchymal Veins. Neurology 80(2): 145-151
3. A. Dula et al (2016). Magnetic Resonance Imaging of the Cervical Spinal Cord in Multiple Sclerosis at 7T. Multiple Sclerosis Journal 22(3): 320-328
Figures