0526
Spine atrophy and sensory-motor disability in African Americans with Multiple Sclerosis1Neurology, Department of Neurology, Icahn School of Medicine at Mount Sinai, NEW YORK, NY, United States, 2Department of Neuroscience, Rehabilitation, Ophthalmology, Genetics, and Mother-Child health, University of Genoa, Genoa, Italy, 3Department of Neurology, Icahn School of Medicine at Mount Sinai, New York, NY, United States, 4Department of Neurology, Columbia University Medical Center, New York, NY, United States, 5Department of Neurology, New York University School of Medicine, New York, NY, United States, 6Department of Neurology, Icahn School of Medicine, New York, NY, United States, 7Department of Neurology, Radiology and Neuroscience, Icahn School of Medicine at Mount Sinai, New York, NY, United States
Synopsis
African Americans with multiple sclerosis (MS) present a more severe disease course than Caucasians with MS, but the contribution of spinal lesions and cervical spinal cord damage to clinical disability has never been explored.
In the present study, we investigated the extent of cervical spinal cord (CSC) damage in AA MS patients compared to age-, sex- and race matched healthy controls. Our study showed that CSC damage in terms of both macroscopic lesions and atrophy significantly impacts motor and sensory performances in AA with MS.
Objective
To investigate the extent of spinal cord damage in African Americans (AA) with multiple sclerosis (MS) compared to age-, sex- and race matched healthy controls (HC).Background
AA with MS present a more severe disease course than Caucasians with MS. AAs not only show a lower age at onset, a preponderance of optico-spinal MS and an increased occurrence of multifocal signs and symptoms, but also a greater risk for secondary progression and poorer responses to disease-modifying therapies (Petracca 2018). Previous studies have suggested that the more severe course is associated with the higher white matter (WM) lesion load and diffuse microstructural damage in normal appearing WM, as well as cerebellar atrophy (Weinstock-Guttman et al., 2010; Howard et al., 2012; Al-Kawaz et al., 2016, Petracca et al., 2018) but the contribution of cervical spinal cord (CSC) lesions and atrophy, which are independently correlated with physical disability in the general MS population (Kearney et al., 2015), has never been explored specifically in AA.Methods
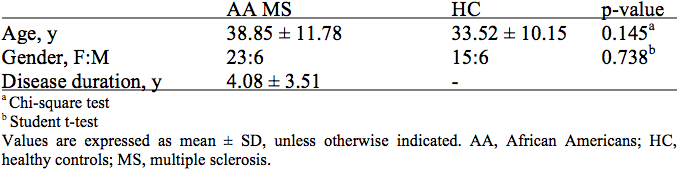
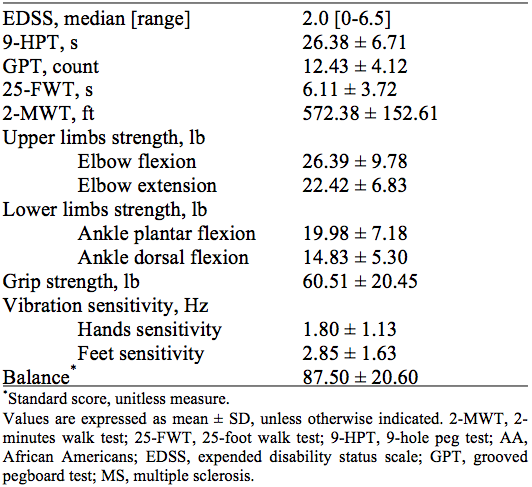
Twenty-nine AA MS patients (23F, mean age 38.85 ± 11.78 yrs, disease duration 4.08 ± 3.51 yrs, median expended disability status scale (EDSS) 2.0, range [0-6.5]) and 21 AA HC (15F, mean age 33.52 ± 10.15 yrs) were prospectively enrolled as part of an ongoing longitudinal study. Subjects underwent a brain and spinal cord 3T MRI (MAGNETOM Skyra 16-channel head and neck coil, Siemens Healthcare, Erlangen, Germany). The brain was imaged using a 3D T2-weighted SPACE sequence. Imaging parameters were: voxel size = 1x1x1 mm3, Field of View (FOV) = 256 mm, 176 sagittal slices, Repetition time (TR)/ Echo time (TE) = 3200/564 ms, GRAPPA with acceleration factor R = 2, acquisition time = 5:09 min. The spinal cord was imaged using a 3D T2-weighted SPACE and a 2D T2-weighted TIRM sequences. Imaging parameters were: (i) 3D T2-weighted SPACE: voxel size = 0.9x0.9x0.9 mm3, FOV = 230 mm, 64 sagittal slices, TR/TE = 1000/123 ms, flip angle = 120°, GRAPPA with acceleration factor R = 2, averages = 1.4, acquisition time = 4:29 min; (ii) 2D T2-weighted TIRM sequence: voxel size = 0.4x0.4x3 mm3, FOV = 220 mm, 15 sagittal slices, TR/TE = 3120/45 ms, flip angle = 160°, GRAPPA with acceleration factor R = 2, acquisition time = 3:52 min. In all subjects, an extensive sensory-motor evaluation was performed including: 9-hole peg test (9-HPT), grooved pegboard test (GPT), 25-foot walk test (25-FWT), 2-minutes walk test (2-MWT), evaluation of upper and lower limbs strength, grip strength, vibration sensitivity and balance. Cervical spinal cord volume was measured on the 3D T2-weighted SPACE images using the Spinal Cord Toolbox (De Leener et al., 2017). The CSC volume was normalized to the cranial cross-sectional area measured on the brain T2-weighted SPACE images using a semiautomated segmentation technique (JIM7, Xinapse Systems, Northants, UK) (Horsfield et al., 2010). The CSC lesions count and extent were visually identified by an experienced radiologist (MP) on the 2D T2-weighted TIRM images. Between-group comparison was performed with ANCOVA adjusted for age and gender. Partial correlations between MRI measures and clinical scores were also adjusted for disease duration. All statistical analyses were carried out using Statistical Package for Social Science (SPSS Inc, v. 19.0, Chicago, III).Results and Discussion
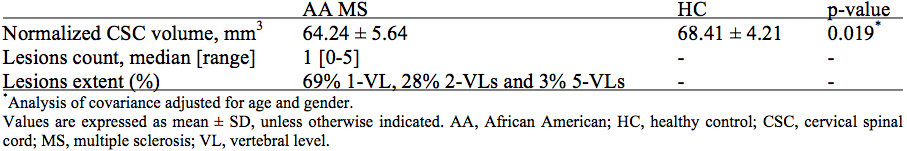
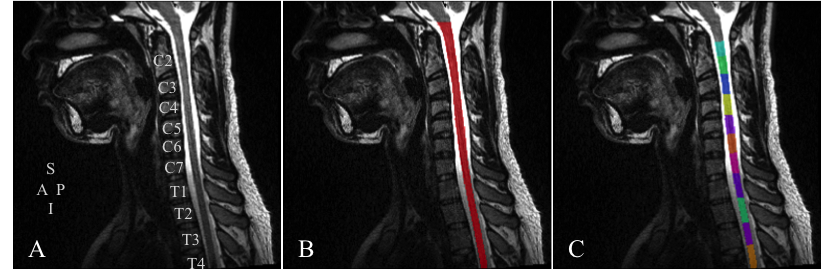
The main demographics, clinical measures and MRI findings are summarized in Table 1, Table 2 and Table 3, respectively. Figure 2 shows an example of segmentation and vertebral labeling results from an AA MS patient. A total number of 33 CSC lesions were found in AA patients (median: 1, range: [0-5]). Sixty-nine percent of the lesions were limited in extension to one cervical level with the highest lesion frequency at C2 (22%), showing an anatomical extension and location similar to what reported in CA patients with MS. AA showed lower normalized CSC volume than HC (AA: 64.24 ± 5.64 mm3, HC: 68.41 ± 4.21 mm3, p = 0.019). Lesion count was correlated with hand vibration sensitivity (r = 0.78, p = 0.003), while normalized CSC volume was correlated with 2-MWT (r = 0.47, p = 0.021), grip strength (r = 0.49, p = 0.016) and lower limbs strength quantified as ankle plantar and dorsal flexion (r = 0.61, p = 0.013; r = 0.50, p = 0.047) and showed association trends with upper limb strength quantified as elbow flexion (r = 0.38, p = 0.070), foot vibration sensitivity (r = -0.50, p = 0.080) and balance test (r = -0.43, p = 0.080).Conclusions
CSC damage in terms of both macroscopic lesions and atrophy significantly impacts motor and sensory performances in AA with MS.Acknowledgements
This study was supported by the National Institute of Health (5R01NS100811).References
Al-Kawaz M, Monohan E, Morris E, Perumal JS, Nealon N, Vartanian T, Gauthier SA. Differential Impact of Multiple Sclerosis on Cortical and Deep Gray Matter Structures in African Americans and Caucasian Americans. J Neuroimaging. 2017 May;27(3):333-338.
De Leener B, Lévy S, Dupont SM, Fonov VS, Stikov N, Louis Collins D, Callot V, Cohen-Adad J. SCT: Spinal Cord Toolbox, an open-source software for processing spinal cord MRI data. Neuroimage. 2017 Jan 15;145(Pt A):24-43.
Horsfield MA, Sala S, Neema M, Absinta M, Bakshi A, Sormani MP, Rocca MA, Bakshi R, Filippi M. Rapid semi-automatic segmentation of the spinal cord from magnetic resonance images: application in multiple sclerosis. Neuroimage. 2010 Apr 1;50(2):446-55
Howard J, Battaglini M, Babb JS, Arienzo D, Holst B, Omari M, De Stefano N, Herbert J, Inglese M. MRI correlates of disability in African-Americans with multiple sclerosis. PLoS One. 2012;7(8):e43061.
Kearney H, Altmann DR, Samson RS, Yiannakas MC, Wheeler-Kingshott CA, Ciccarelli O, Miller DH. Cervical cord lesion load is associated with disability independently from atrophy in MS. Neurology. 2015 Jan 27;84(4):367-73.
Petracca M, Zaaraoui W, Cocozza S, Vancea R, Howard J, Heinig MM, Fleysher L, Oesingmann N, Ranjeva JP, Inglese M. An MRI evaluation of grey matter damage in African Americans with MS. Mult Scler Relat Disord. 2018 Oct;25:29-36.
Weinstock-Guttman B, Ramanathan M, Hashmi K, Abdelrahman N, Hojnacki D, Dwyer MG, Hussein S, Bergsland N, Munschauer FE, Zivadinov R. Increased tissue damage and lesion volumes in African Americans with multiple sclerosis. Neurology. 2010 Feb 16;74(7):538-44.
Figures