0524
Does myelin content heterogeneity in the spinal cord reflect disability in multiple sclerosis?1Medicine, University of British Columbia, Vancouver, BC, Canada, 2Physics and Astronomy, University of British Columbia, Vancouver, BC, Canada, 3International Collaboration on Repair Discoveries (ICORD), Vancouver, BC, Canada, 4Radiology, University of British Columbia, Vancouver, BC, Canada, 5Pathology & Laboratory Medicine, University of British Columbia, Vancouver, BC, Canada, 6Biomedical Engineering, University of British Columbia, Vancouver, BC, Canada
Synopsis
The spinal cord is inherently more difficult to image than brain resulting in fewer MRI studies in multiple sclerosis (MS) patients. We used GRASE-derived myelin water fraction (MWF) mean (myelin content) and standard deviation (SD; myelin content heterogeneity) to better understand MS cervical spinal cord pathology compared to healthy controls. We found significant differences in cervical spinal cord MWF SD between progressive MS, relapsing-remitting MS and healthy controls. Further, MWF SD was correlated with disability measures in progressive MS. Our findings suggest that MWF SD as a measure of myelin abnormality in cervical cord relates to disability in MS.
Introduction
Myelin water fraction (MWF), a ratio of the MR signal from the short T2 component (myelin water) to the total signal, has been proposed as an in vivo marker of myelin content in the CNS1–3. The spinal cord is commonly affected in multiple sclerosis (MS) patients and is an important contributor to physical disability. However, fewer studies have been performed in the spinal cord than the brain in MS as the spinal cord is more difficult to image due to its small size, motion artefacts and inhomogeneous magnetic field that may result in image distortion and signal loss4. We aimed to 1) compare myelin abnormality in the cervical cord between relapsing-remitting MS (RRMS), progressive MS (ProgMS) and healthy controls (HC) and 2) evaluate the correlation between MWF in the cervical cord and clinical disability as measured by Expanded Disability Status Scale (EDSS), Nine-Hole Peg Test (9HPT) and Timed 25-foot Walk (T25W), as well as disease duration (DD). MWF mean (myelin content) and standard deviation (SD; myelin content heterogeneity) were used to study myelin abnormality.Methods
Myelin water imaging (MWI) data was acquired from 13 RRMS (mean age 42y (range 26-57y), median EDSS 2.5 (1.0-4.0)), 17 ProgMS (mean age 59y (48-65y), median EDSS 4.0 (2.0-8.5)) and 13 HC (mean age 39y (22-63y)) using a gradient and spin echo (GRASE) sequence (32 echoes, TE=10ms, TR=1501ms, SENSE factor=2, 8 slices acquired at 0.75x0.75x5mm3 reconstructed to 16 slices at 0.63x0.63x2.5mm3, acquisition time=8.5min) at cord level C2/C3 on a 3T Philips scanner. MWF was calculated using a regularized non-negative least squares algorithm with stimulated echo correction1,5,6. Registration and segmentation were performed using Spinal Cord Toolbox7. Mann-Whitney U tests were performed to compare MWF mean and SD in global cervical cord, global white matter (WM), dorsal column and lateral/ventral funiculi between groups. Spearman’s rho (r) was used to examine the correlation of MWF mean and SD with EDSS, 9HPT, T25W and DD.Results
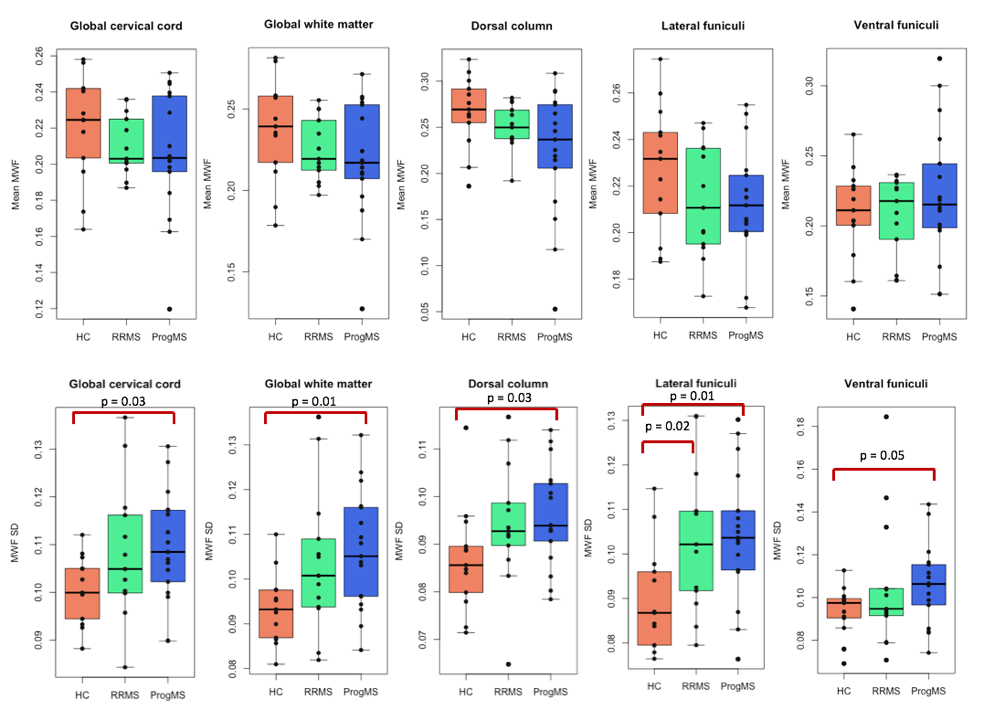
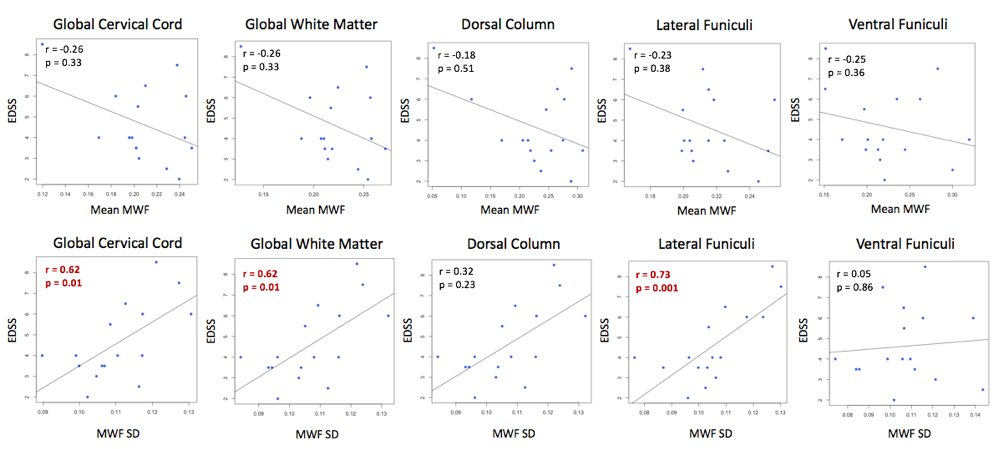
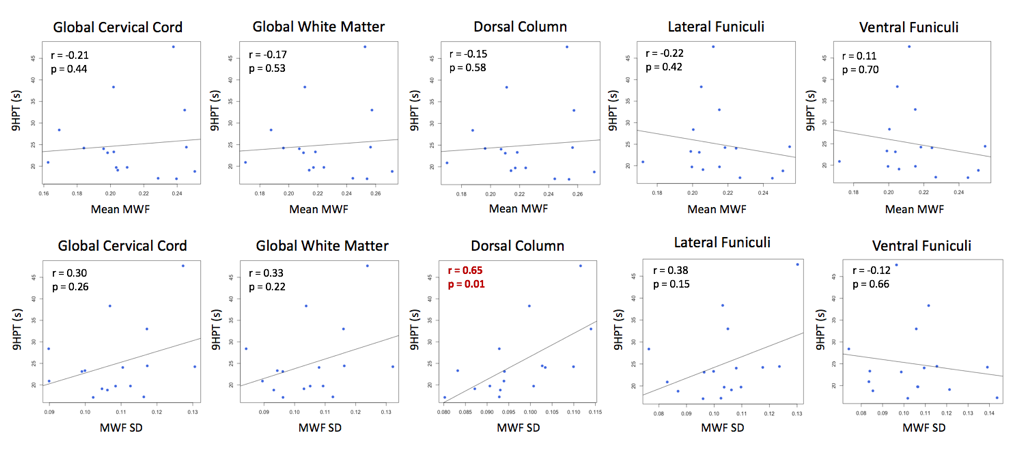
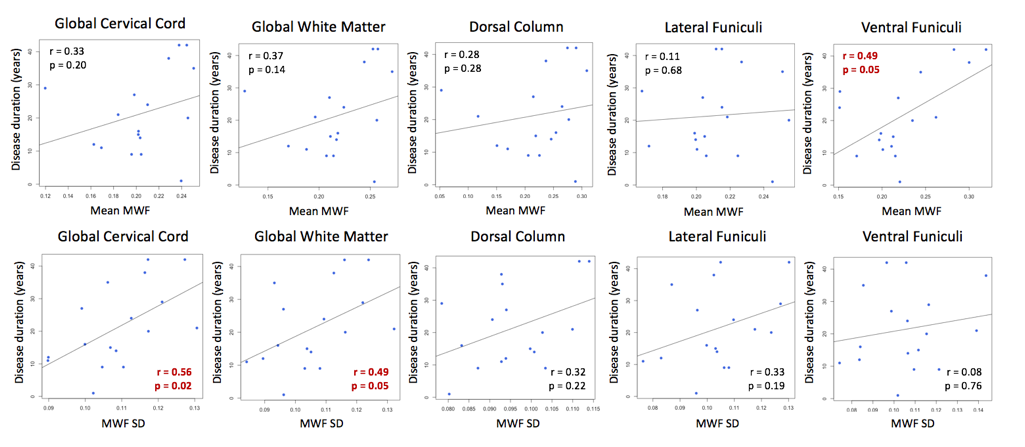
RRMS and ProgMS had lower mean MWF in global cervical cord, global WM, dorsal column and lateral funiculi compared to HC although not reaching significance (Fig.1). Compared to HC, MWF SD was significantly higher in ProgMS global cervical cord (+8.77%, p=0.03), global WM (+13.61%, p=0.01), dorsal column (+10.37%, p=0.03), lateral funiculi (+16.43%, p=0.01) and ventral funiculi (+13.06%, p=0.05) (Fig.1). MWF SD was significantly higher in RRMS than HC in lateral funiculi (+15.53%, p=0.02). MWF SD was significantly correlated with EDSS in the global cervical cord (r=0.62, p=0.01), global WM (r=0.62, p=0.01) and lateral funiculi (r=0.73, p=0.001) for ProgMS (Fig.2). MWF SD was also significantly correlated with 9HPT in the dorsal column (r=0.65, p=0.01) and with disease duration in the global cervical cord (r=0.56, p=0.02) and global WM (r=0.49, p=0.05) for ProgMS (Fig.3,4). There was no significant correlation between MWF mean or SD and T25W.Discussion
Cervical cord myelin content heterogeneity (MWF SD) was significantly different between MS and HC and was correlated with disability as measured by EDSS and 9HPT. Higher myelin content heterogeneity in the dorsal column correlated with reduced dexterity as measured by 9HPT, which may be explained by the cuneate fasciculus, a tract of nerves in the dorsal column, functioning to regulate finger positioning and fine motor control of the digits8,9. There was also a correlation between global cervical cord myelin content heterogeneity and disease duration. As our goal was to investigate the global pathology of MS that may contribute to clinical disability, including damage in both lesions and normal-appearing WM, the lesions were not excluded from our analysis.Conclusion
Lower myelin content and higher myelin content heterogeneity in ProgMS, as well as correlations between myelin content heterogeneity and clinical disability in ProgMS, suggest that myelin damage in cervical spinal cord is associated with disability in ProgMS. While mean MWF values vary greatly between individuals, even healthy controls, the distribution of values within an ROI (and thus SD) tends to be more consistent in the absence of pathology10. Therefore, myelin content heterogeneity (MWF SD) may detect subtle alterations in spinal cord myelin that may not be evident with mean MWF measures alone.Acknowledgements
This research was supported by Multiple Sclerosis Society of Canada. We would like to sincerely thank all participants, researchers and MR technologists at the UBC MRI Research Centre.References
1. MacKay A, Whittall K, Adler J, et al. In vivo visualization of myelin water in brain by magnetic resonance. Magn Reson Med. 1994;31(6):673-677.
2. Whittall KP, MacKay AL, Graeb DA, et al. In vivo measurement of T2 distributions and water contents in normal human brain. Magn Reson Med. 1997;37(1):34-43.
3. MacKay A, Laule C, Vavasour I, et al. Insights into brain microstructure from the T2 distribution. Magn Reson Imaging. 2006;24(4):515-525.
4. Stroman PW, Wheeler-Kingshott C, Bacon M, et al. The current state-of-the-art of spinal cord imaging: methods. Neuroimage. 2014;84:1070-1081.
5. Ljungberg E, Vavasour I, Tam R, et al. Rapid myelin water imaging in human cervical spinal cord. Magn Reson Med. 2017;78(4):1482-1487.
6. Prasloski T, Rauscher A, MacKay AL, et al. Rapid whole cerebrum myelin water imaging using a 3D GRASE sequence. Neuroimage. 2012;63(1):533-539.
7. De Leener B, Lévy S, Dupont SM, et al. SCT: Spinal Cord Toolbox, an open-source software for processing spinal cord MRI data. Neuroimage. 2017;145(Pt A):24-43.
8. Vierck CJ Jr and Cooper BY. Cutaneous texture discrimination following transection of the dorsal spinal column in monkeys. Somatosens Mot Res. 1998;15(4):309-315.
9. Darian-Smith C. Monkey models of recovery of voluntary hand movement after spinal cord and dorsal root injury. ILAR J. 2007;48(4):396-410.
10. Meyers SM, Vavasour IM, Madler B, et al. Multicenter measurements of myelin water fraction and geometric mean T2: intra- and intersite reproducibility. J Magn Reson Imaging. 2013;38(6):1445-1453.
Figures