0523
Reproducibility of Quantitative Cervical Spinal Cord MRI for Multi-center Clinical Trials in Multiple Sclerosis1Icahn School of Medicine at Mount Sinai, New York, NY, United States, 2Touro college of osteopathic medicine, New York, NY, United States, 3Washington University in St. Louis, St. Louis, MO, United States
Synopsis
Quantitative cervical spinal cord (C-spine) MRI offers promising biomarkers for progressive multiple sclerosis (MS). The intra- and inter-site, short- and long-term reproducibility of these quantitative C-spine MRI measurements is crucial for designing longitudinal or multi-site study. In this two-site pilot study, we evaluated the reproducibility of quantitative C-spine MRI and demonstrate the feasibility of multi-site study with high reproducibility using a harmonized protocol.
Introduction
Reliable imaging biomarkers of axonal degeneration and demyelination are key components to monitor disease progression and develop therapies for MS through clinical trials. In particular, multicenter clinical studies are necessary to recruit sufficient number of progressive MS patients for the required statistical power. Recent developments in quantitative C-spine MRI show promise of offering additional imaging biomarkers, other than those from brain MRI, to advise decision making in clinical trials for progressive MS. In this International Progressive MS Alliance (IPMSA)-sponsored two-site pilot study, we evaluated both intra- and inter-site reproducibility of quantitative MRI measurements of C-spine area and microstructural integrity at 3 T in healthy controls and progress MS patients.Methods
Subjects: We recruited three healthy controls and three progressive MS patients at each site. Subjects re-visited within two months (n=12) and after 6 months (n=6). In addition, 3 subjects were scanned at both sites within two months.
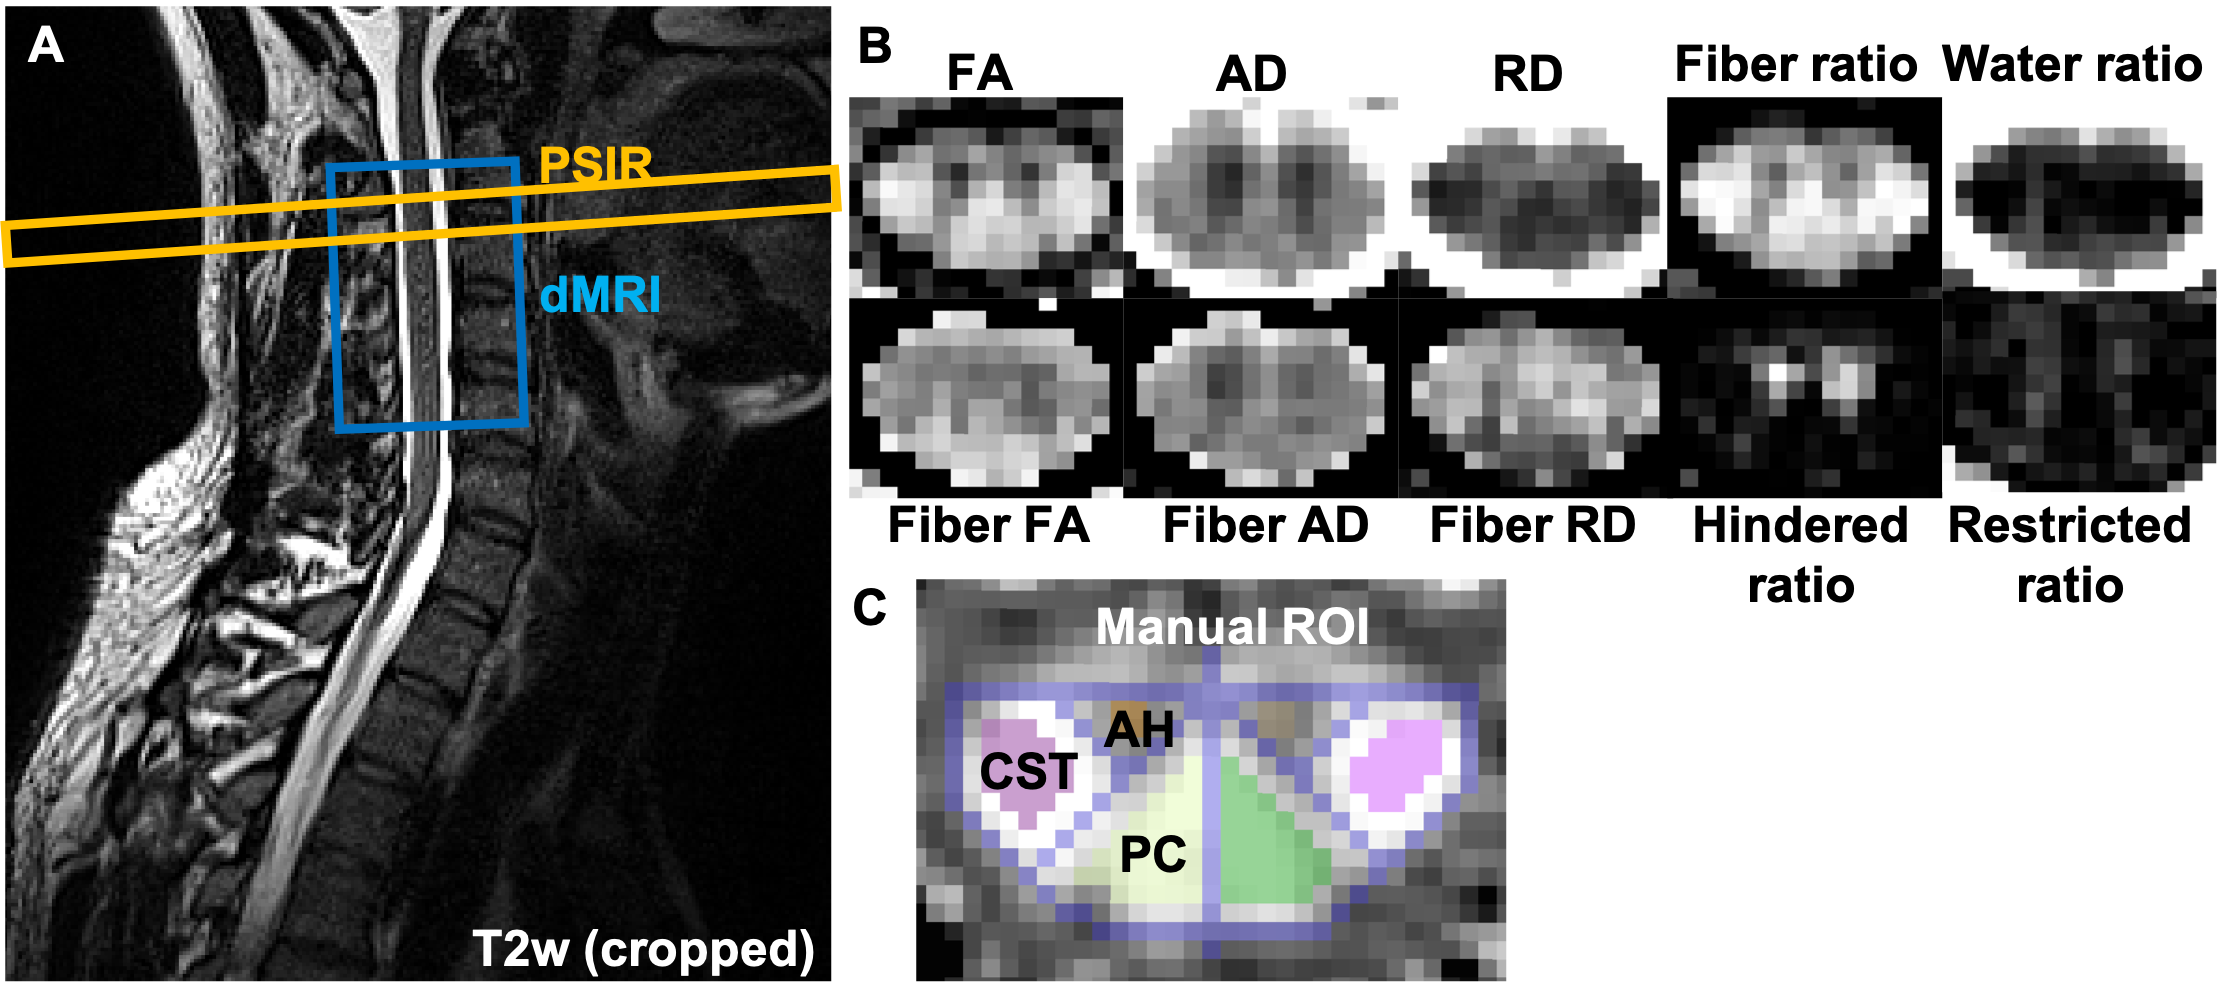
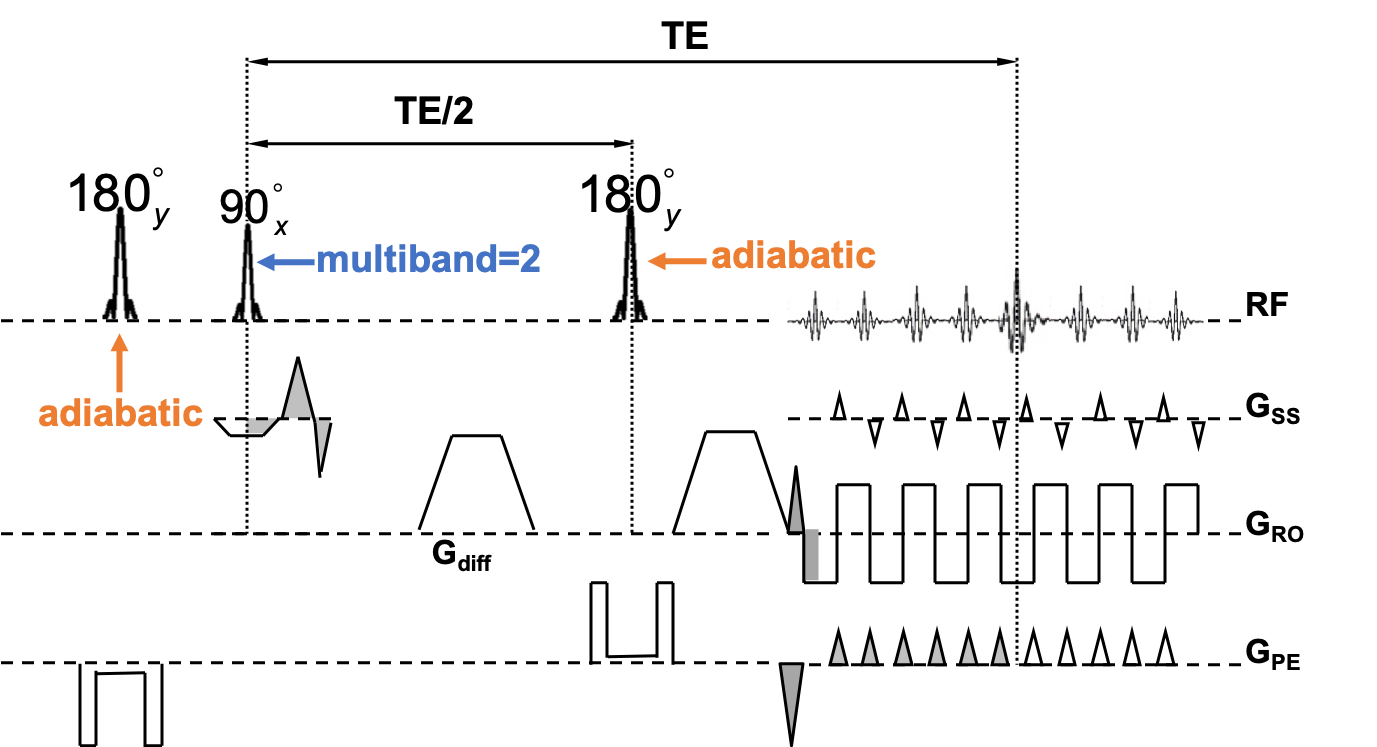
Acquisitions: Siemens 3T MRI scanners were used for both sites. The following quantitative protocols were harmonized between sites (Fig. 1) –T2-weighted imaging: 0.9 mm isotropic resolution, TR/TE=1000/121 ms; phase sensitive inversion recovery (PSIR 1): 0.8 mm × 0.8 mm × 3 mm resolution, TR/TI/TE=930/400/3.22 ms; and axial cardiac-gated diffusion MRI (dMRI): 0.9 mm × 0.9 mm × 5 mm resolution, 12 slices, multiband = 2 2, TR/TI/TE=300/20.8/70.4 ms, anterior-posterior (AP) phase encoding direction, multi-b values (linearly spaced, up to 1000 s/mm2) and multi-b vectors 3 (Fig. 2).
Image processing: spinal cord segmentation, vertebrae labeling, cross-sectional area (CSA) calculation, and automated white matter tract identification (automated region of interest, ROI) were derived from Spinal Cord Toolbox (SCT 4). PSIR gray matter (GM) and white matter (WM) were manually segmented. dMRI volumes were aligned using slice-wise x and y translations3. After excluding dMRI slice/volume containing image artifacts, diffusion tensor imaging (DTI) maps (including axial diffusivity (AD), radial diffusivity (RD), mean diffusivity (MD), and fractional anisotropy (FA)) and diffusion basis spectrum imaging (DBSI 5) maps (including fiber AD/RD/FA and fiber/hindered/restricted/water fraction) were calculated (Fig. 1B). Manual dMRI ROIs including corticospinal tract (CST) and posterior column (PC) were manually drawn using a geometric-based approach on mean b0 and high b-value images, and DTI FA maps 3 (Fig. 1C). Automated dMRI WM tract ROIs were also generated using maximum a posteriori 6 approach.
Statistics: After testing (paired t-test) of no difference between left and right tracts, the left and right tract dMRI measurements were averaged for further analyses. dMRI measurements from manual ROI and automated ROI were compared with paired t-test. We assessed intra-site short-term (n=13), intra-site long-term (n=9, three of the subjects were scanned at both sites), and inter-site short-term (n=6) coefficient of variation (COV) of the different measurements (i.e., CSA at each vertebral level, WM area, GM area, and dMRI measurements).
Results
DTI AD and FA of all
subjects from manual ROIs were significantly higher (p < 10-5)
than those from automated ROIs, suggesting systematic bias of more partial
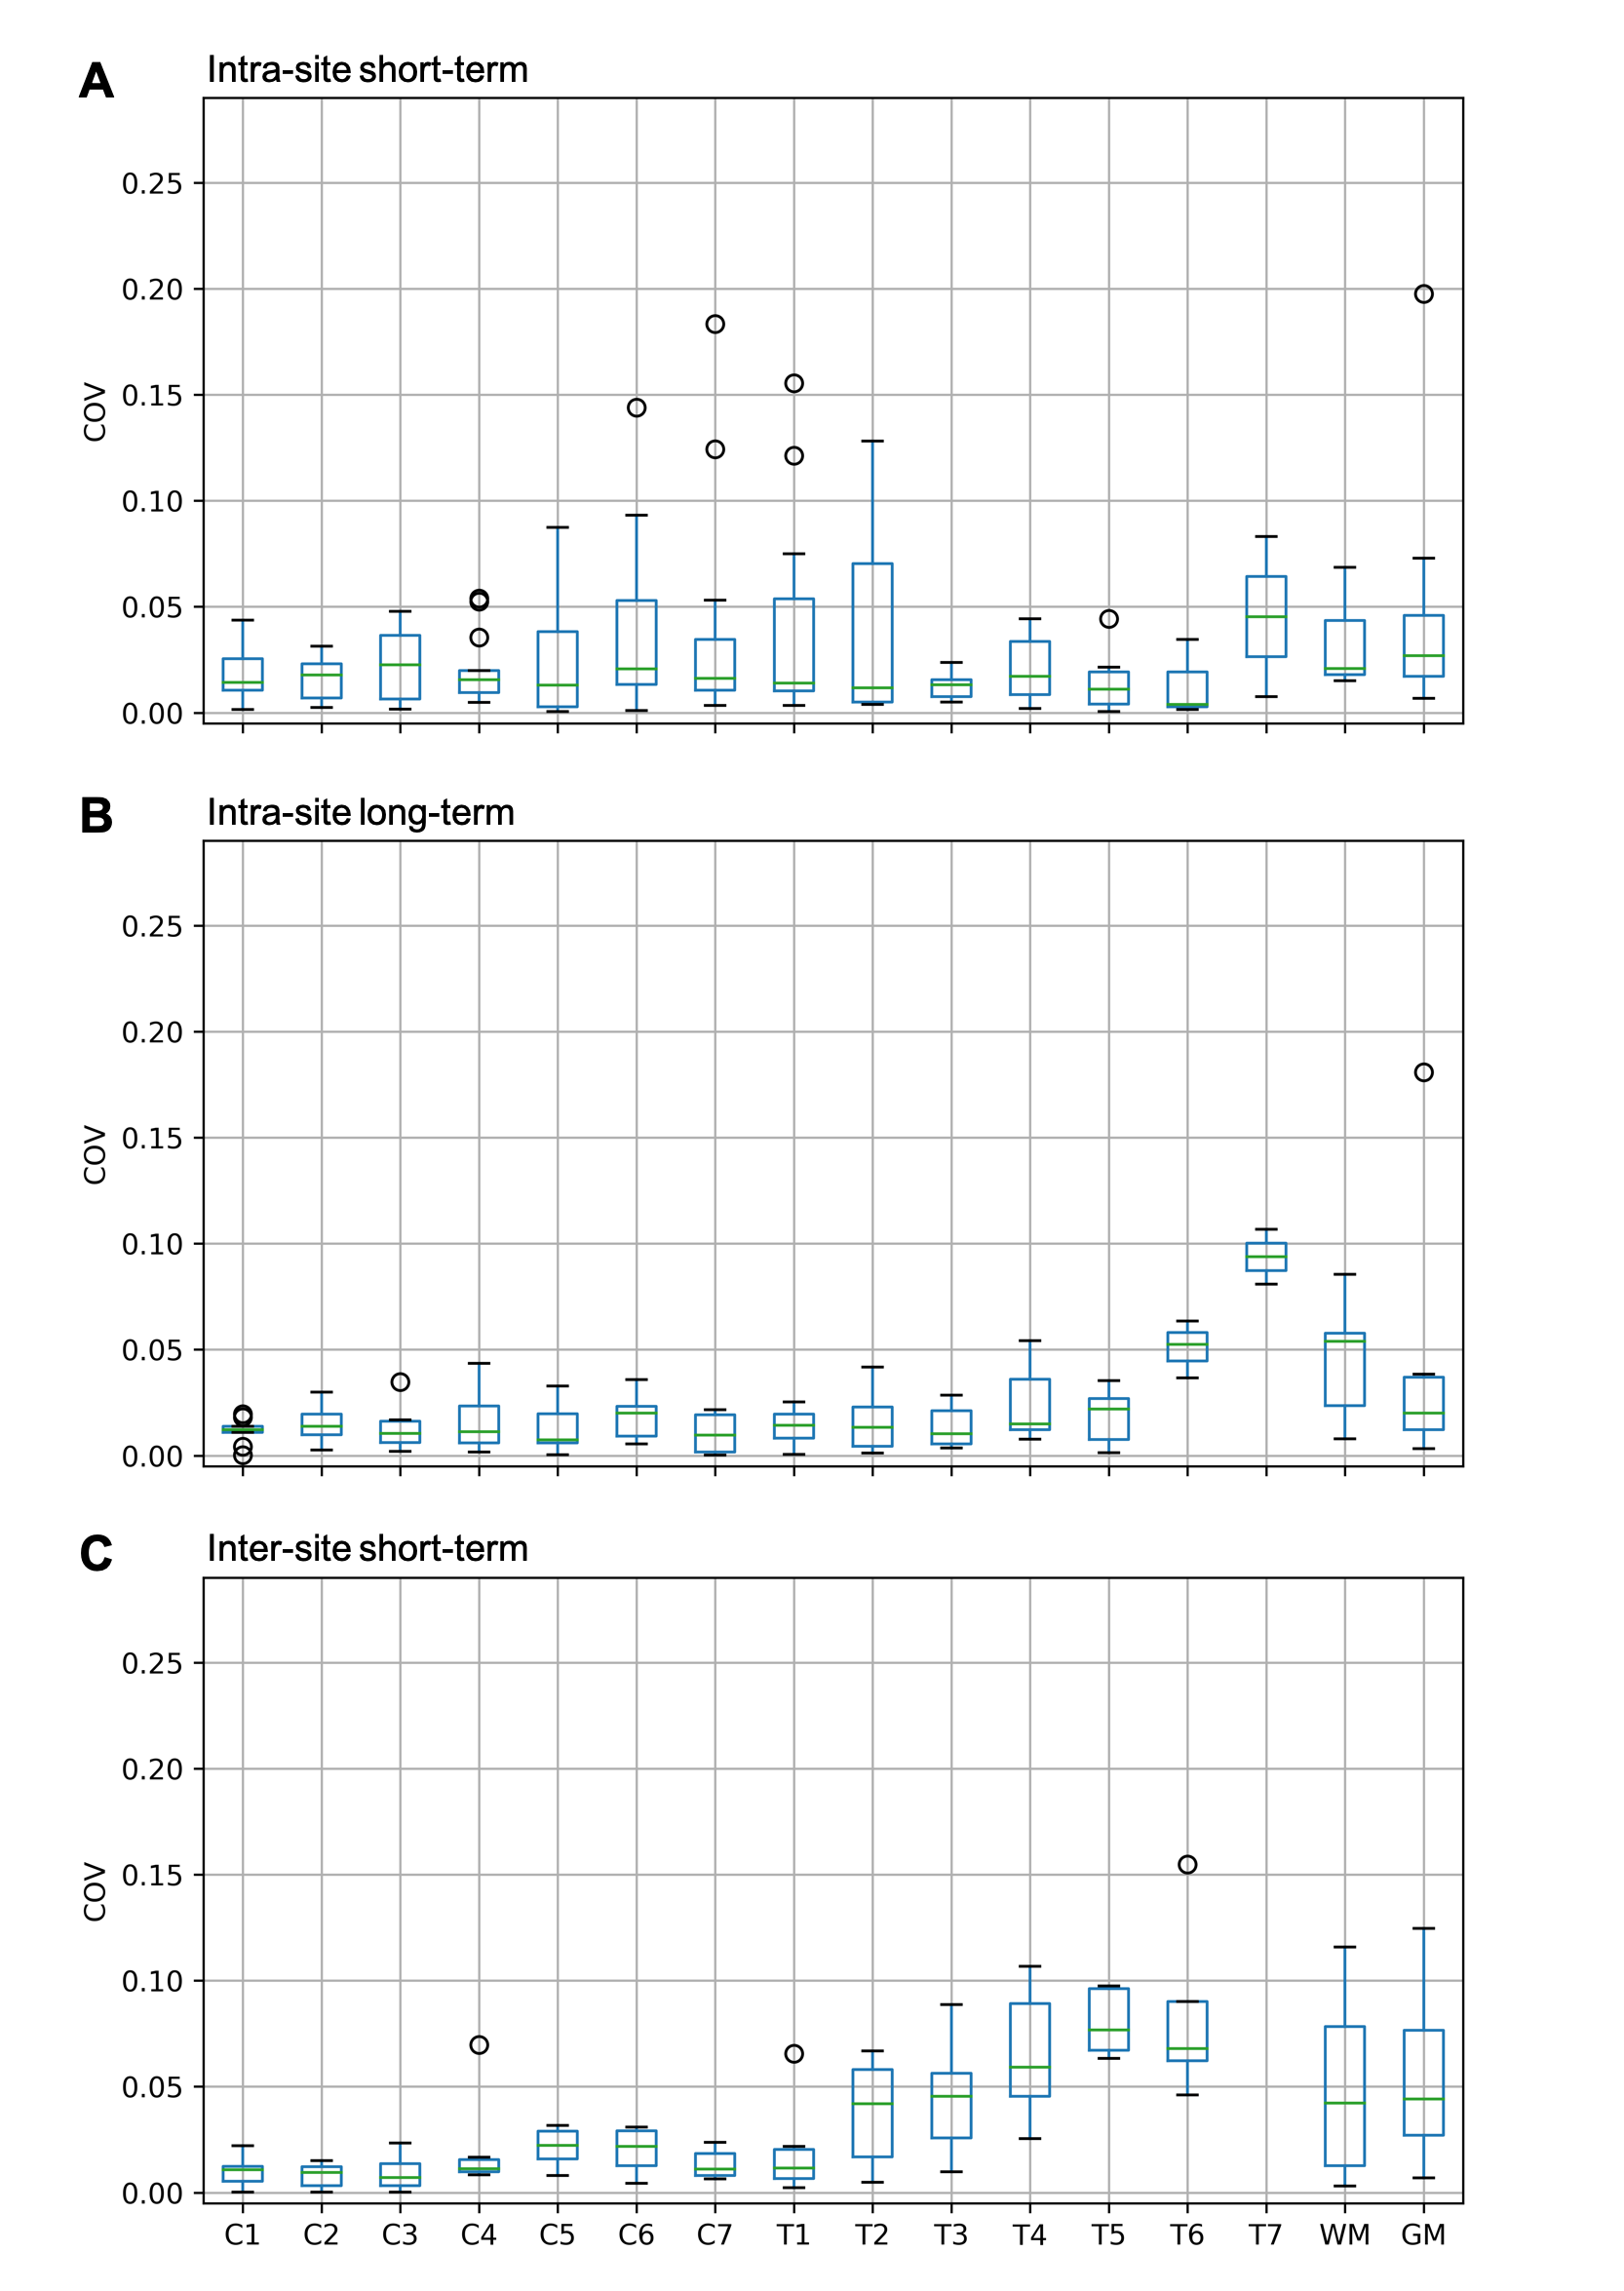
volume effects in the latter. The intra-site short- and long-term as well as
inter-site short-term COVs of CSA and WM/GM area were less than 0.15 except for
one outlier (Fig. 3). The intra-site
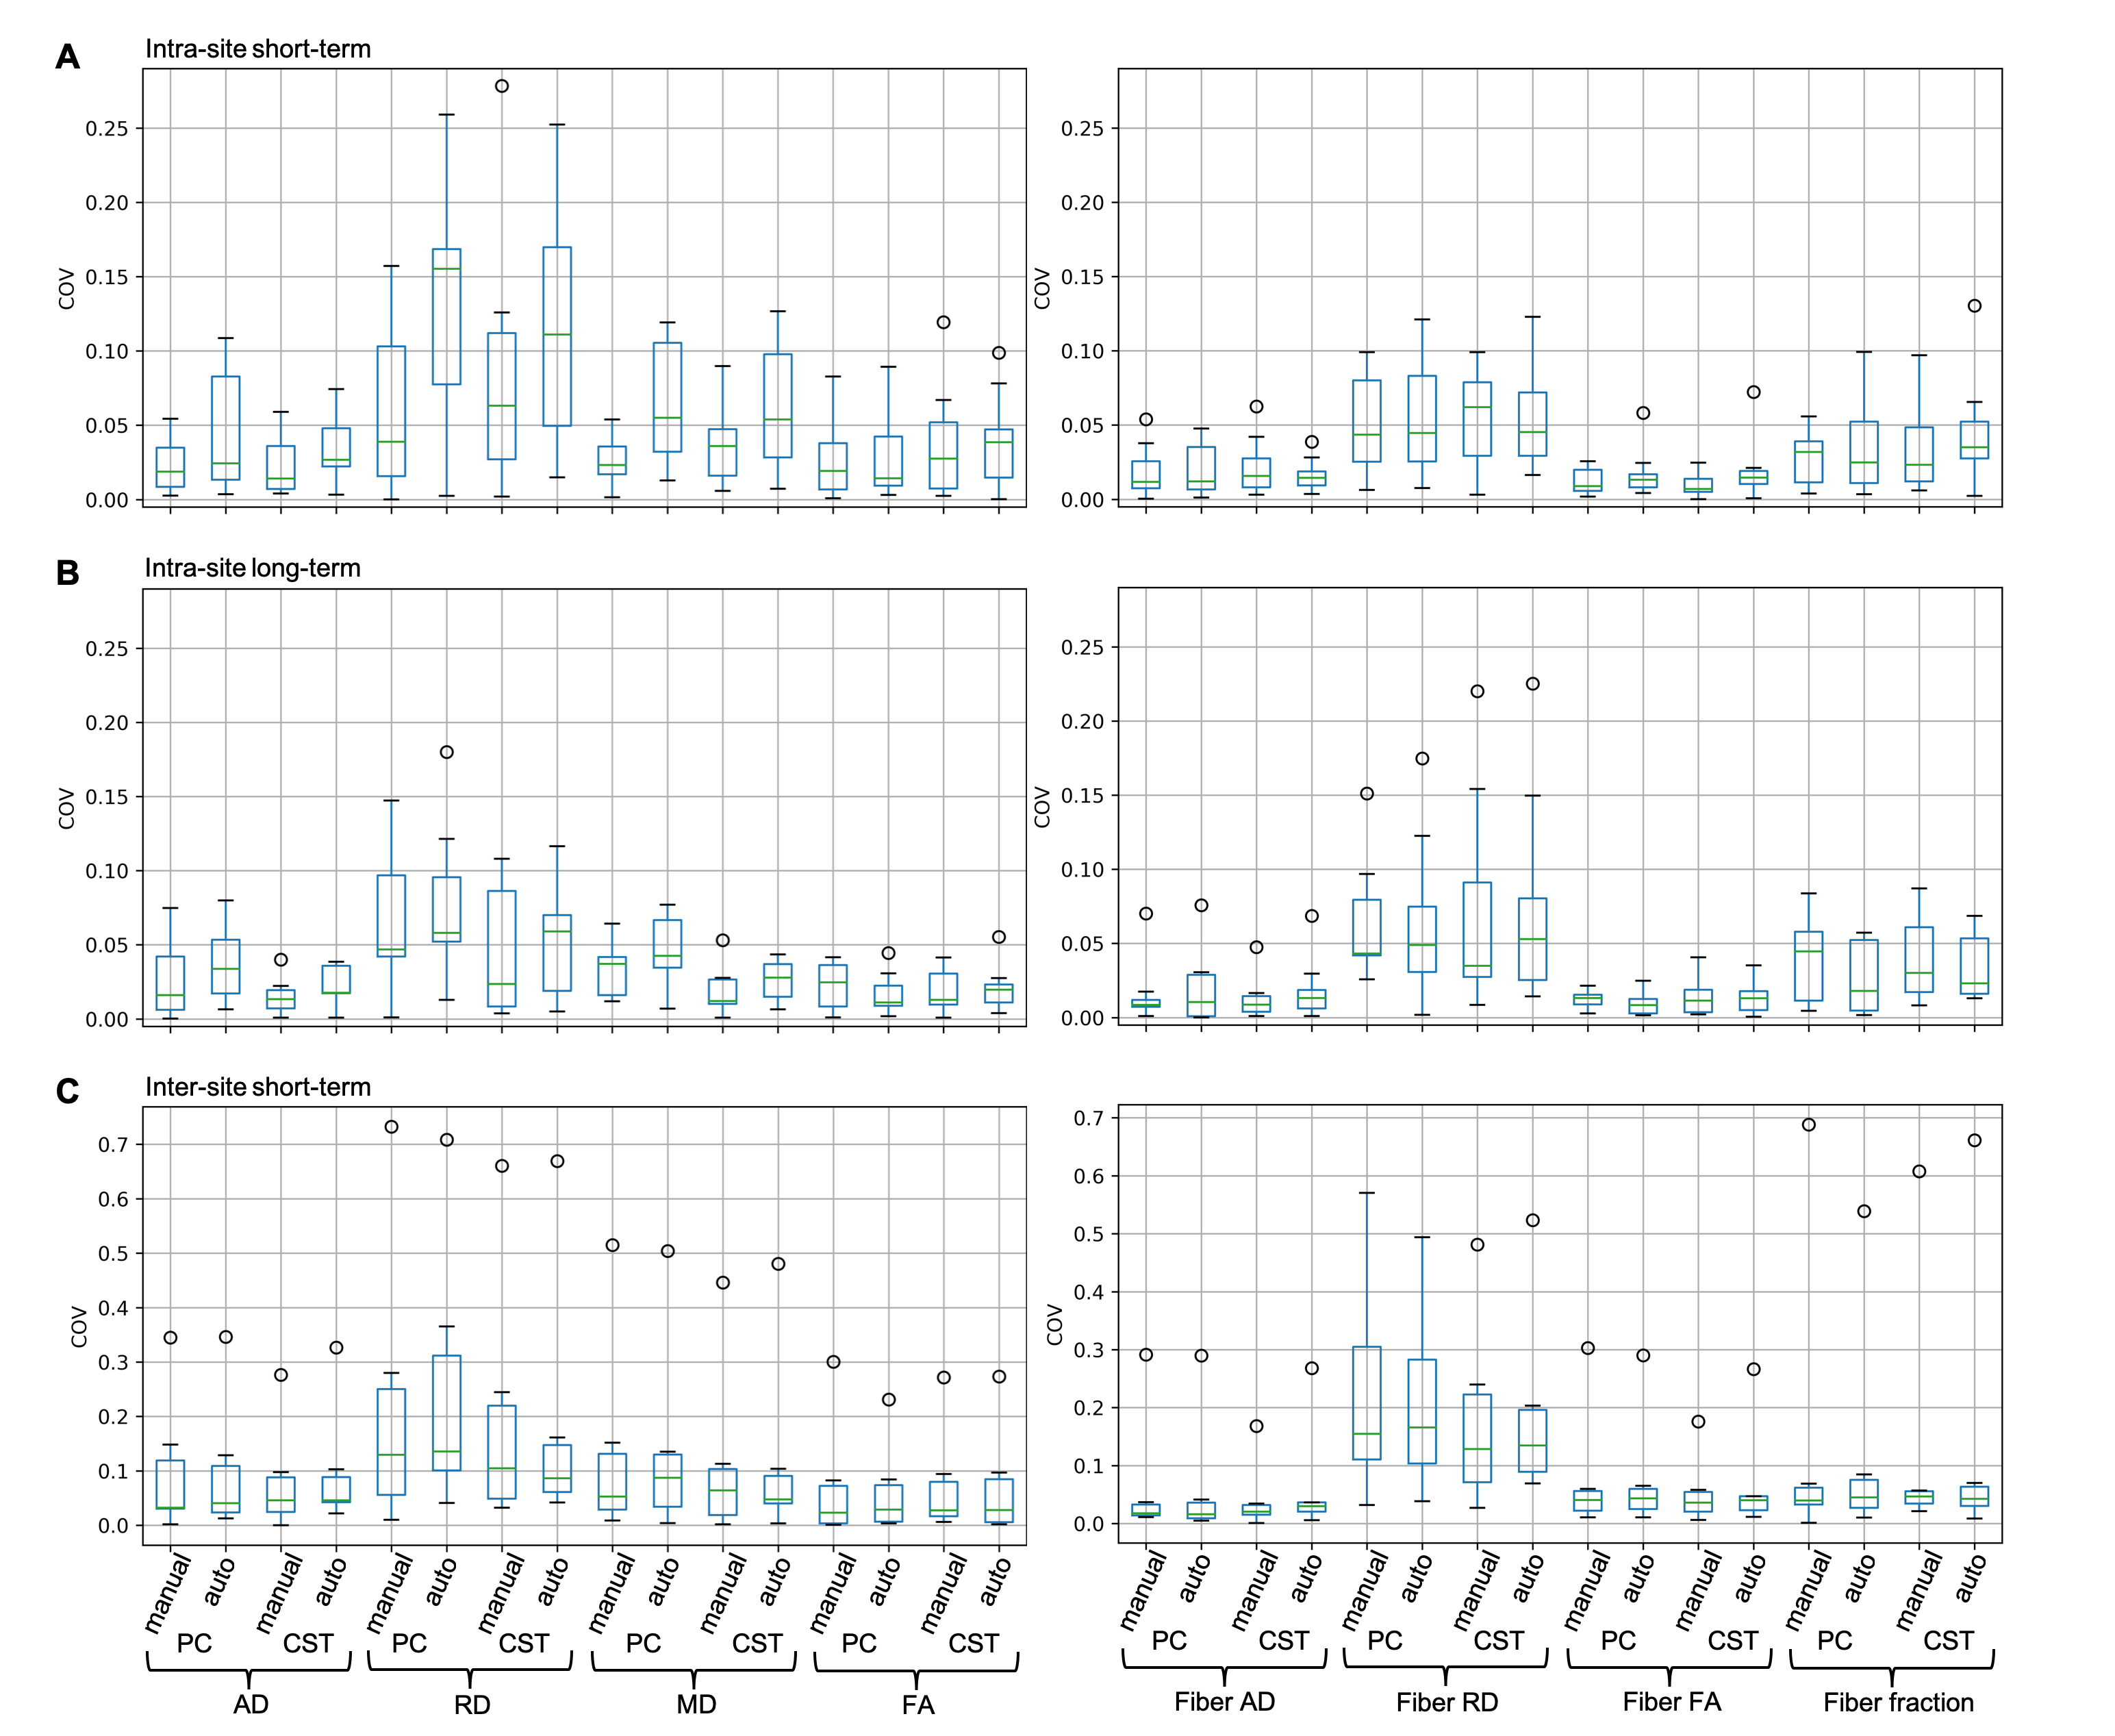
short- and long-term COVs of dMRI measurements were less than 0.25, while
inter-site short-term COVs of them show site-specific bias, hence is less
reproducible than intra-site (Fig. 4).
Intra-site short-term COVs of RD in PC and MD in both CST and PC from manual
ROI were significantly smaller (p < 0.05) than those from automated ROI (Fig. 4A). There was no statistically
significant difference in intra-site long-term or inter-site short-term COVs
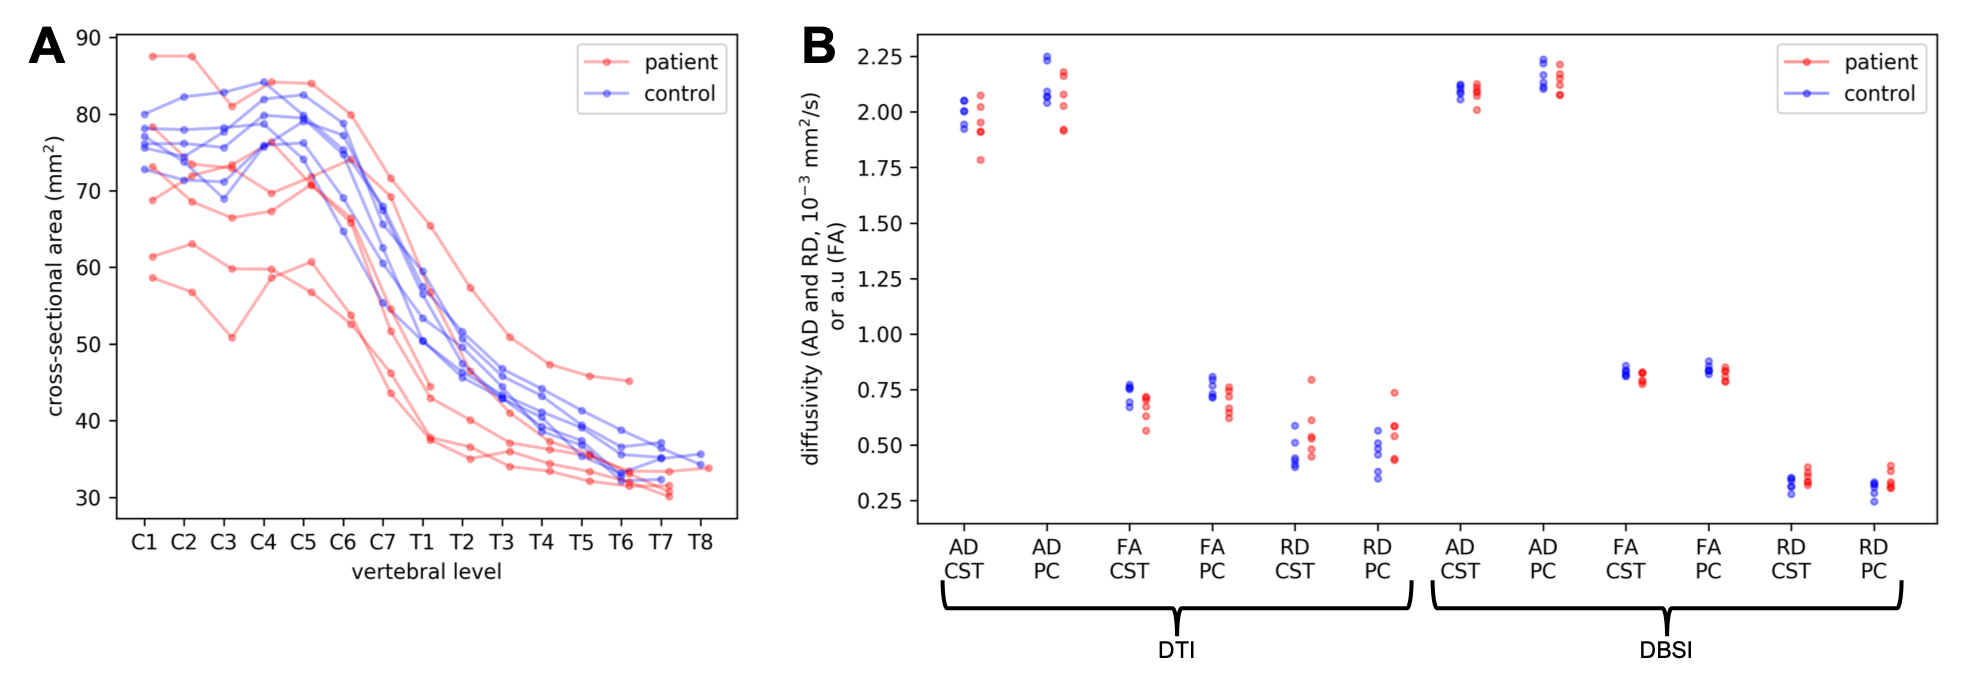
between manual and automated ROIs. The healthy control and progressive MS
patient groups showed expected trend of group differences in the MRI
measurements (Fig. 5), but we did
not calculate statistical significance due to the small number of subjects (6
in each group).Discussion
Our high intra-site reliability strongly supports the feasibility of quantitative C-spine MRI for single-site longitudinal studies. Multi-site longitudinal study is also promising with careful acquisition harmonization (single vendor preferred 7), quality assurance, and phantom and/or traveling subject calibration (data under analysis). Both unprocessed and processed data with extensive QA and quantitative analysis will be publicly shared 8.Conclusion
This two-site reproducibility study of quantitative cervical spinal cord MRI provides important pilot data for power calculation and best-practice guidance in single-site or multiple-site longitudinal clinical trials for multiple sclerosis.Acknowledgements
NMSS FG-1606-24492 (J-WK), RSNA RSCH1328 (JX), International Progressive MS Alliance (IPMSA) infrastructure award PA0097.
References
1. Papinutto, N. et al. 2D phase-sensitive inversion recovery imaging to measure in vivo spinal cord gray and white matter areas in clinically feasible acquisition times. J. Magn. Reson. Imaging 42, 698–708 (2015).
2. Xu, J., Seifert, A. C. & Kim, J.-W. Slice-Accelerated Inner-Volume Cervical Spinal Cord Diffusion MRI. Proc. of the 27th Annual Meeting of ISMRM, Montreal, QC, Canada, (2019) submitted.
3. Xu, J. et al. Improved in vivo diffusion tensor imaging of human cervical spinal cord. NeuroImage 67, 64–76 (2013).
4. De Leener, B. et al. SCT: Spinal Cord Toolbox, an open-source software for processing spinal cord MRI data. NeuroImage 145, 24–43 (2017).
5. Wang, Y. et al. Quantification of increased cellularity during inflammatory demyelination. Brain 134, 3587–3598 (2011).
6. Lévy, S. et al. White matter atlas of the human spinal cord with estimation of partial volume effect. NeuroImage 119, 262–271 (2015).
7. Samson, R. S. et al. ZOOM or Non-ZOOM? Assessing Spinal Cord Diffusion Tensor Imaging Protocols for Multi-Centre Studies. PLOS ONE 11, e0155557 (2016).
8. Kim, J.-W. et al. Mount Sinai - Washington University Quantitative Cervical Spinal Cord MRI Reproducibility Study Data. Proc. of the 27th Annual Meeting of ISMRM, Montreal, QC, Canada, (2019) submitted.
Figures