0522
An exploratory study to evaluate the potentiality of advanced multi-parametric MRI for longitudinal follow-ups of patients with Neuromyelitis optica spectrum disorder1Aix-Marseille Université, CNRS, CRMBM, Marseille, France, 2AP-HM, Hôpital Universitaire Timone, CEMEREM, Marseille, France, 3Department of Neurology, CHU Timone, AP-HM, Marseille, France, 4Department of Neurology, CHU Lyon, Hôpital Pierre Wertheimer, Lyon, France
Synopsis
The temporal pattern of spinal cord (SC) tissue changes in Neuromyelitis optica spectrum disorder, a rare neuro-inflammatory condition, was evaluated for the first time using a multi-parametric MR protocol covering the whole cervical SC (high-resolution T2*-weighted anatomical imaging, diffusion tensor imaging (DTI), 3D-MP2RAGE T1-mapping, conventional and inhomogeneous Magnetization Transfer (MT/ihMT) imaging). Results showed substantial pathological variations of all MR metrics at baseline in agreement with the presence of a multi-level inflammatory lesion and a temporal pattern suggesting progressive recovery to control values, with T1 values being the most sensitive to temporal changes and showing residual tissue destructuration following the myelitis.
Introduction
Neuromyelitis optica spectrum disorder (NMOSD) is a demyelinating inflammatory disorder driven by an auto-antibody targeting the astrocytic water channel, aquaporin-4 (AQP4). NMOSD is mainly affecting the spinal cord (SC) and optic nerves, resulting in functional deficits often greater than that in multiple sclerosis1. Over the past decade, several cross-sectional studies have applied both conventional (T1-weighted and T2-weighted)2,3 and non conventional MRI techniques, particularly DTI and MT4–8 to investigate SC tissue changes in NMOSD patients. Nonetheless, to our knowledge, no longitudinal studies using such advanced MRI techniques have been reported. Our aim in this exploratory study was thus to evaluate the potentiality of a multi-parametric MR protocol at 3T based on axial 2D multi-slice multi-angle DTI9, MT/ihMT10,11, and high-resolution T2*-weighted anatomical images, as well as a SC-optimized 3D MP2RAGE10,12 sequence, to investigate the temporal evolution of SC microstructural tissue changes occurring in NMOSD.Methods
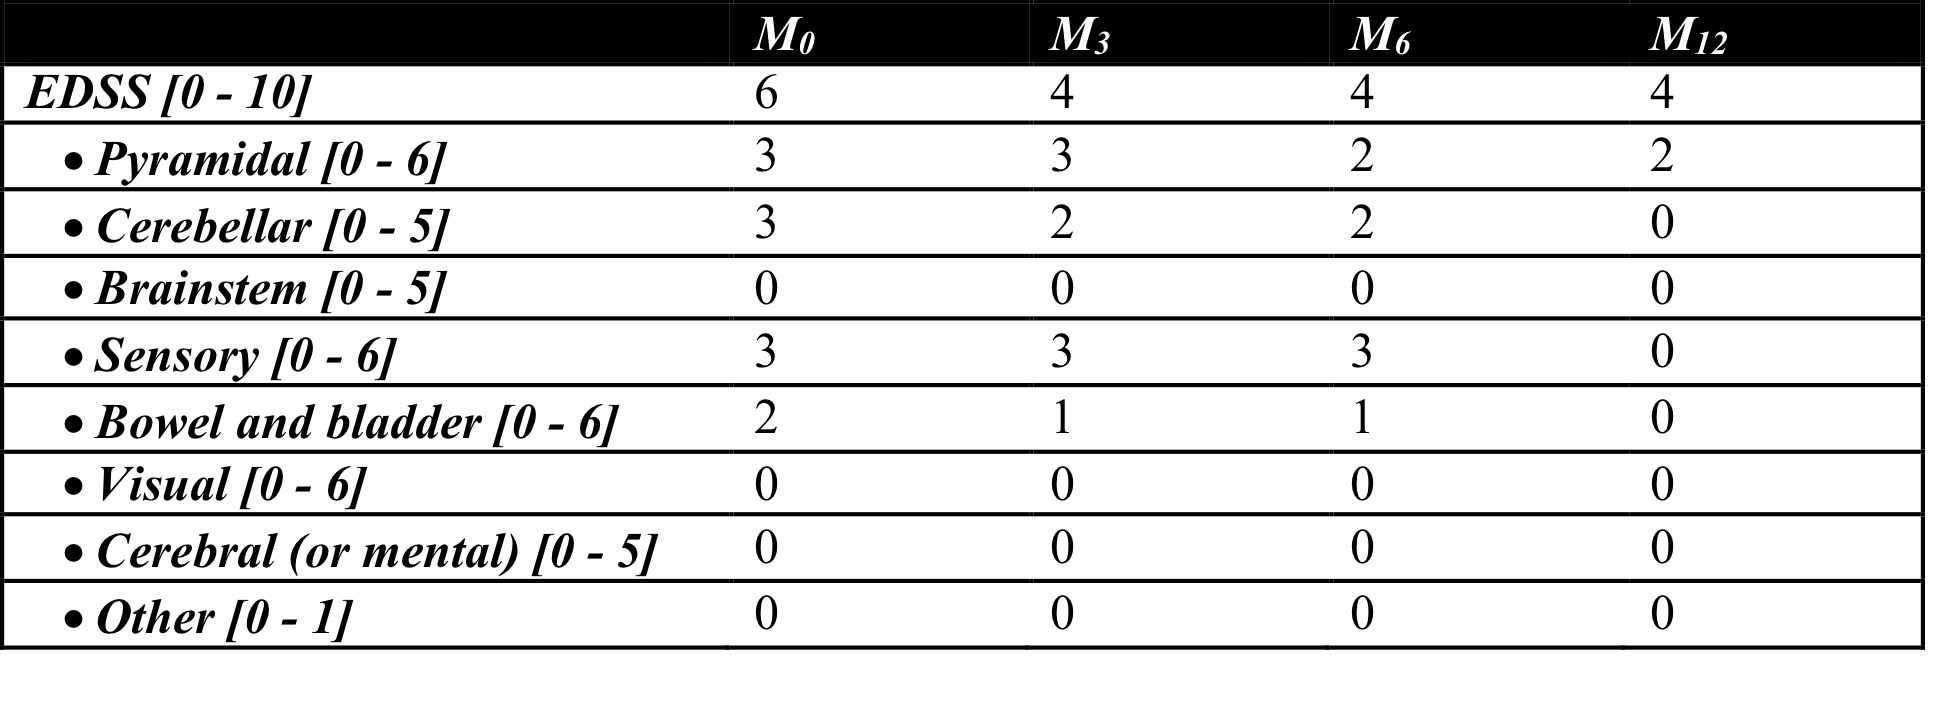
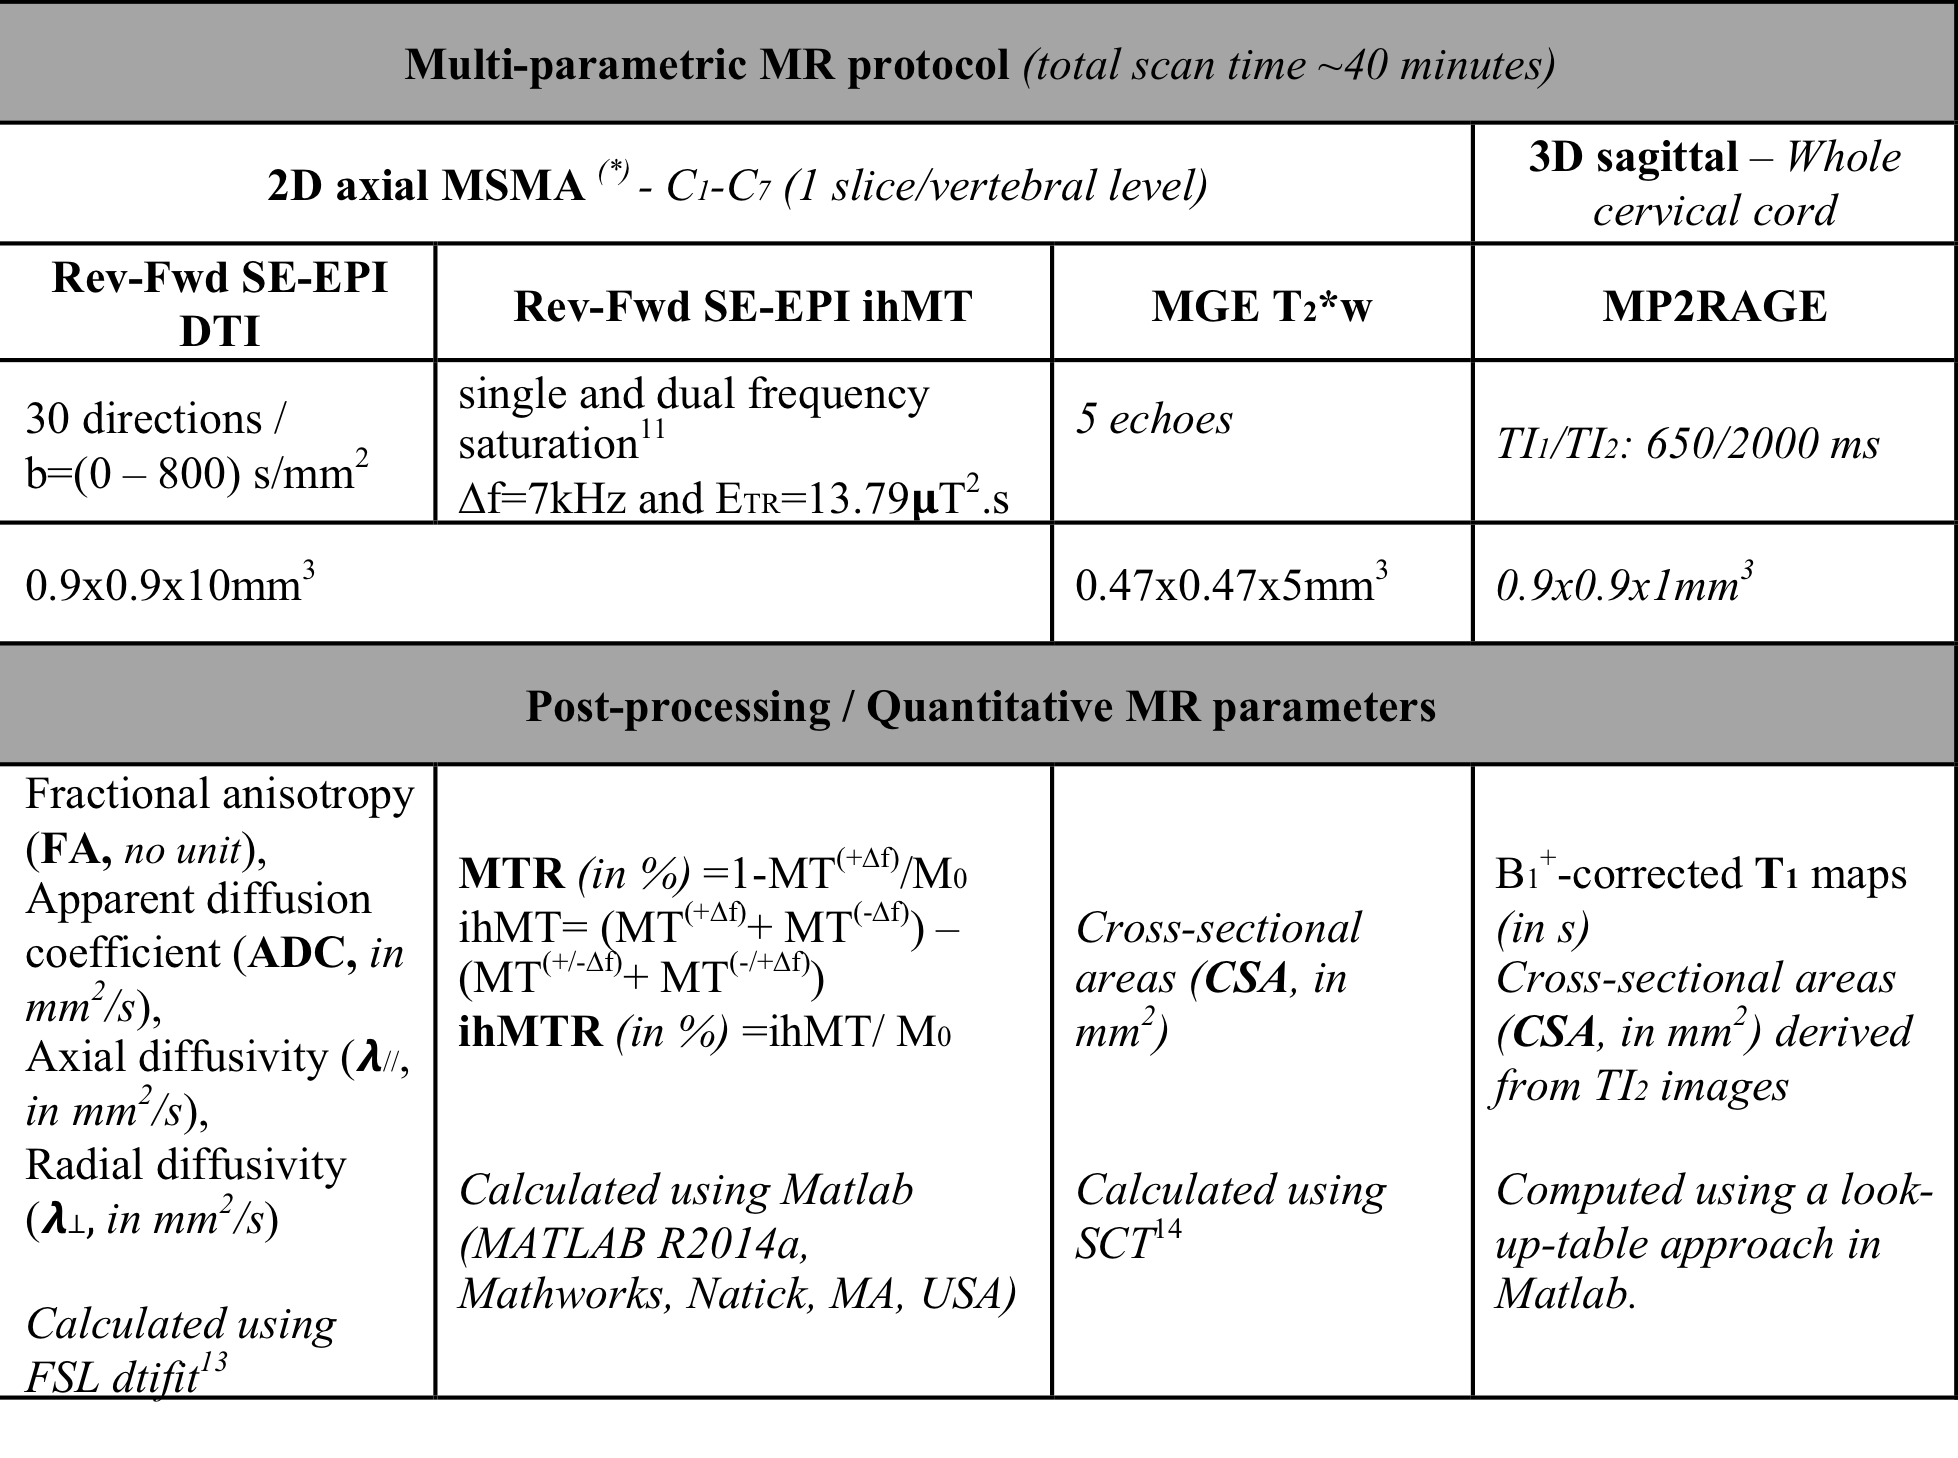
A 74-year-old male patient diagnosed with NMOSD and tested positive for AQP4-lgG underwent the 3T MR protocol at the time of admission (M0) and after three (M3), six (M6) and twelve (M12) months. At each timepoint, the Expanded Disability Status Scale (EDSS) including 8 functional system sub-scores (pyramidal, cerebellar, brainstem, sensory, bowel and bladder, visual, cerebral (or mental), and other) were evaluated (cf. Table 1). Meanwhile, the patient underwent plasmapheresis, oral steroids and rituximab. Five healthy control (HC) subjects (2M/3F, age: 60.2±2.9 [57 - 64] years old) were additionally scanned for reference. The main sequence parameters for the different acquisitions are presented in Table 2, together with the derived MR metrics. Mean MR parameters were evaluated at each cervical level considering the whole SC as a region-of-interest. Z-scores relative to HC were computed for each MR metric at each cervical level and each timepoint.Results
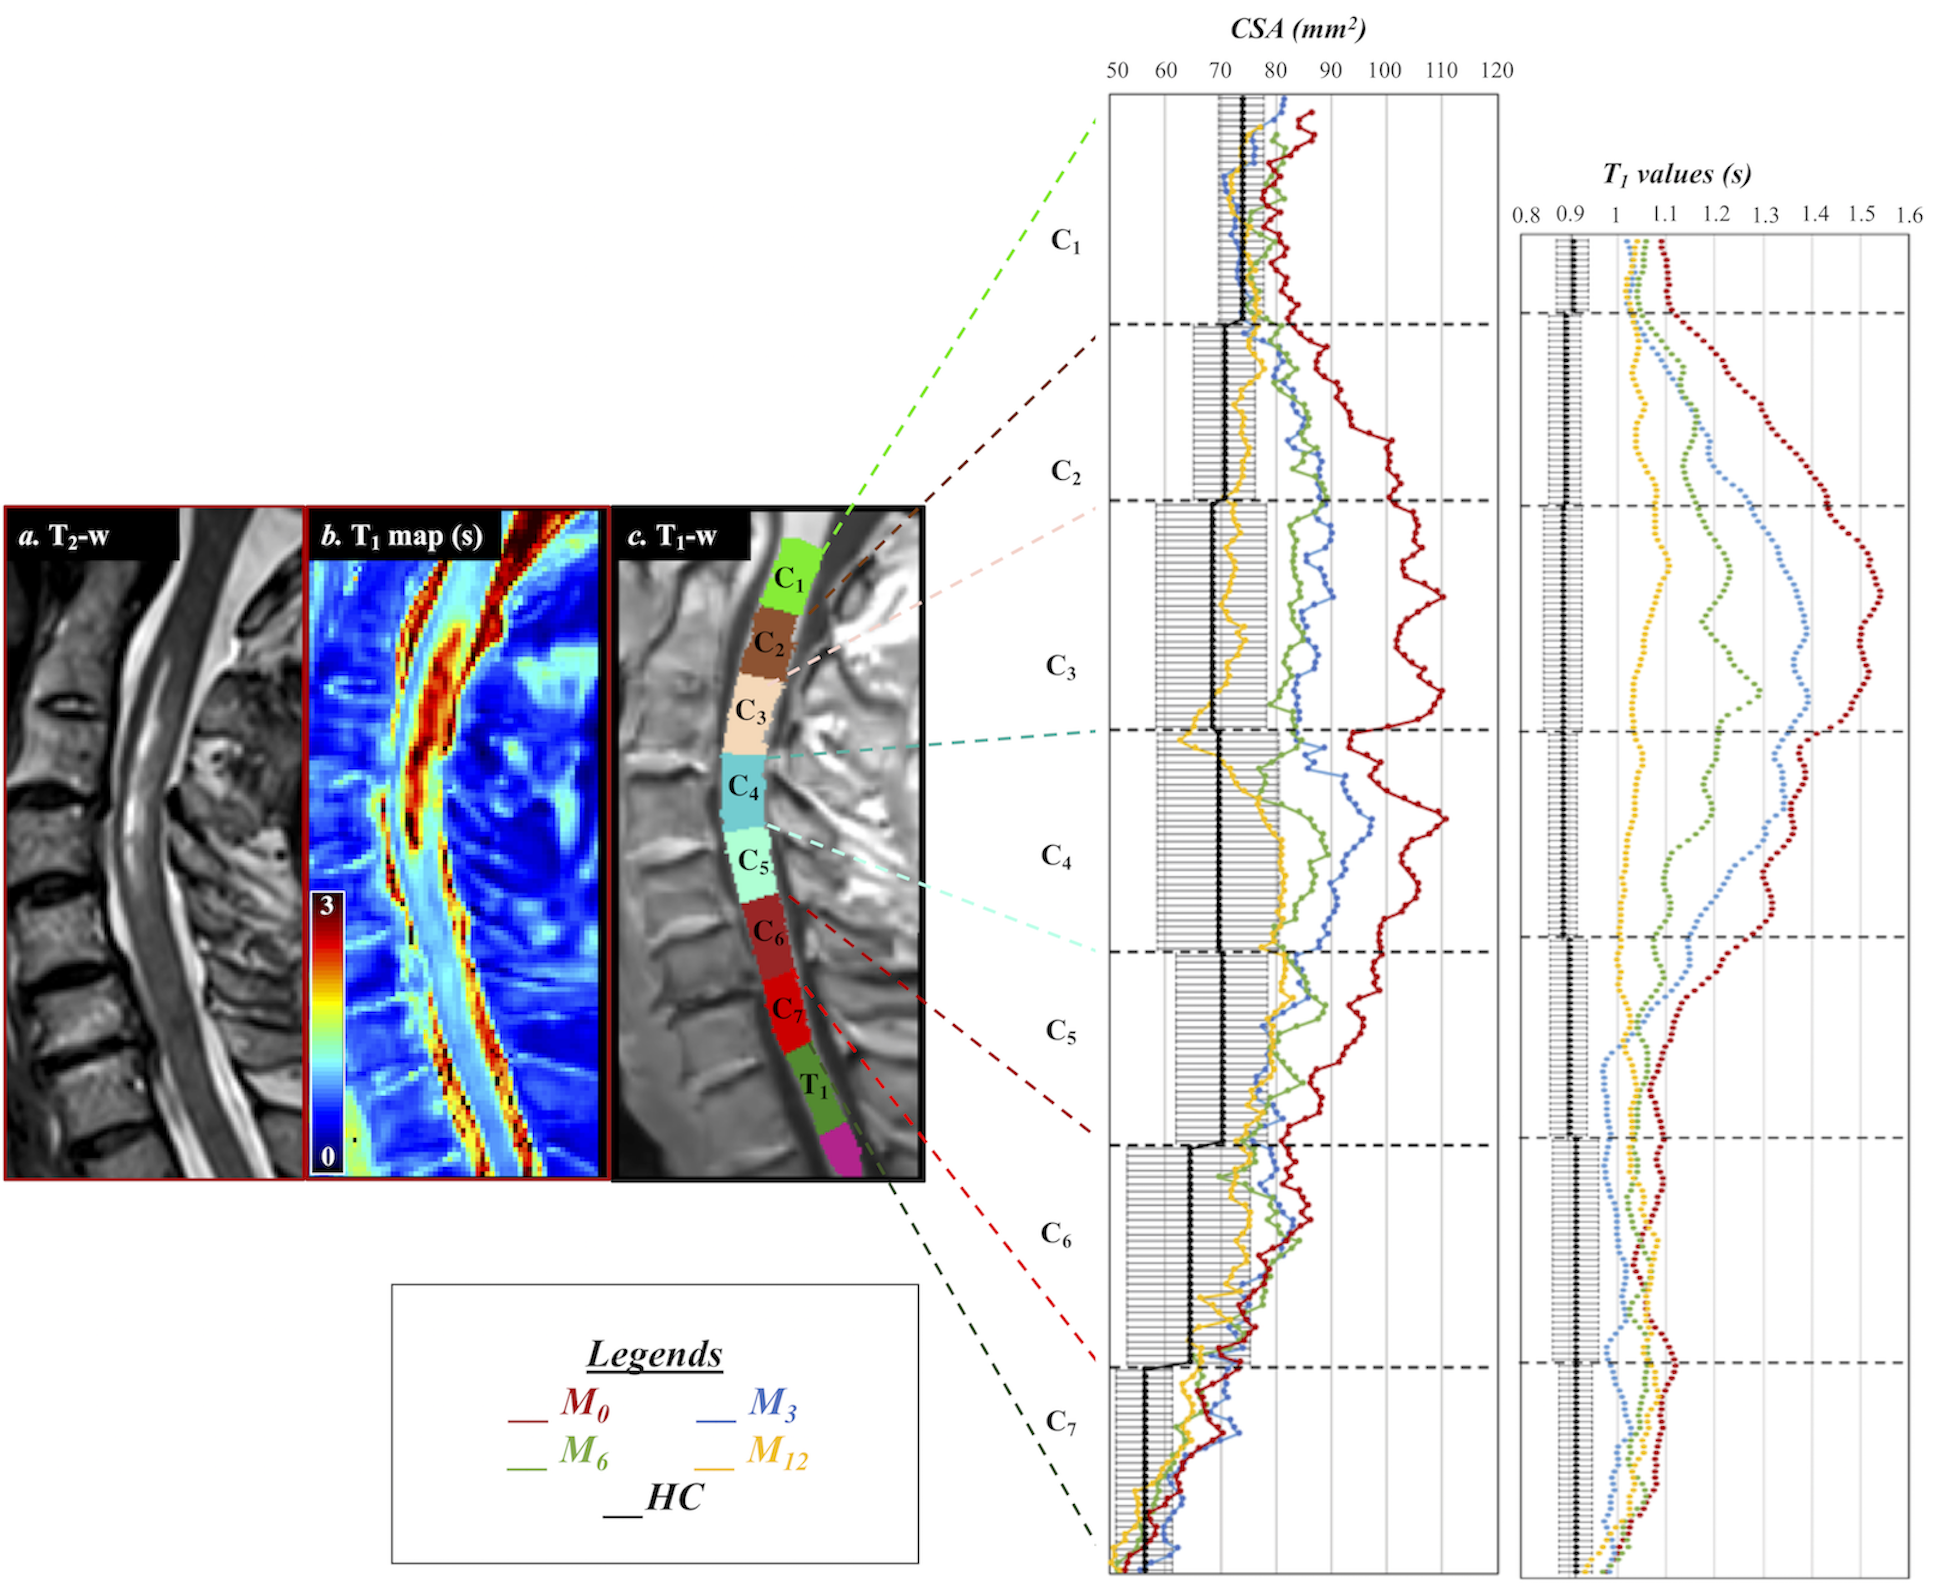
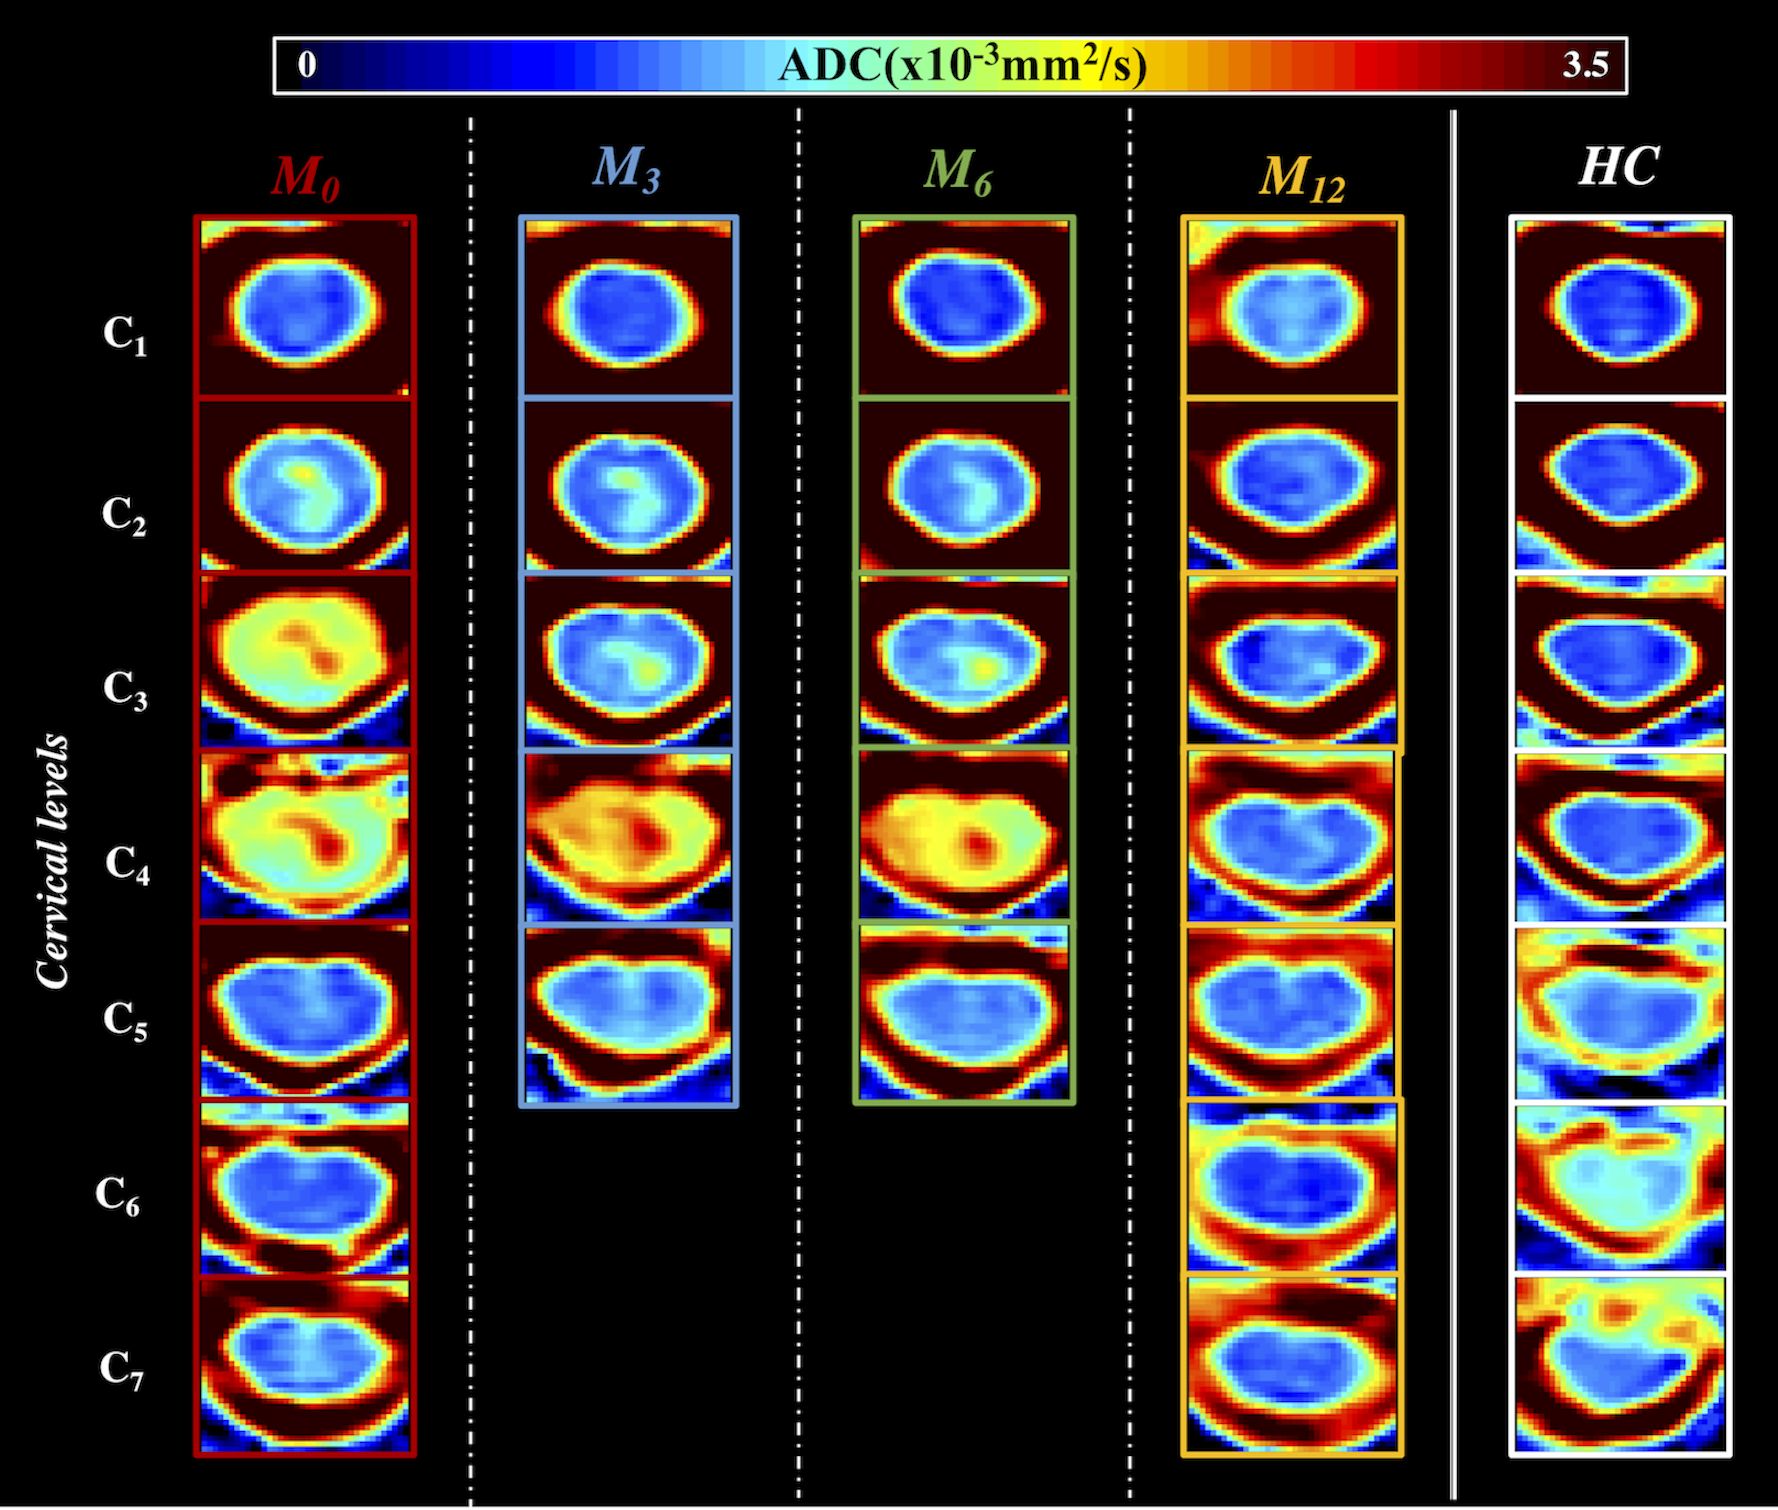
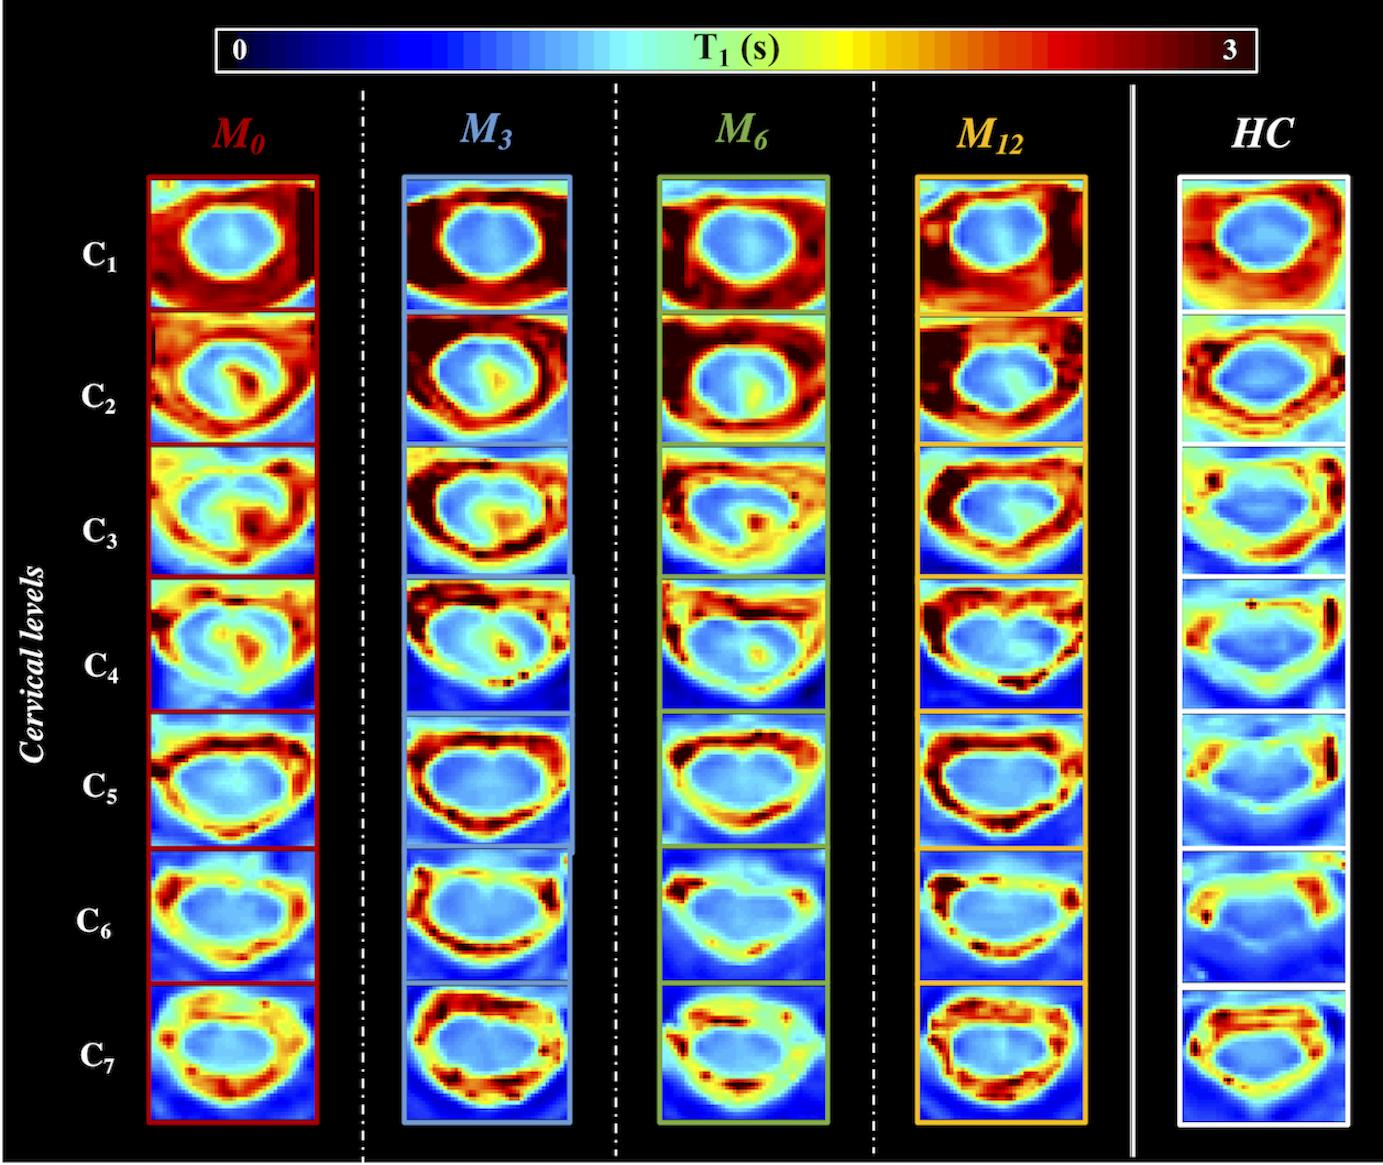
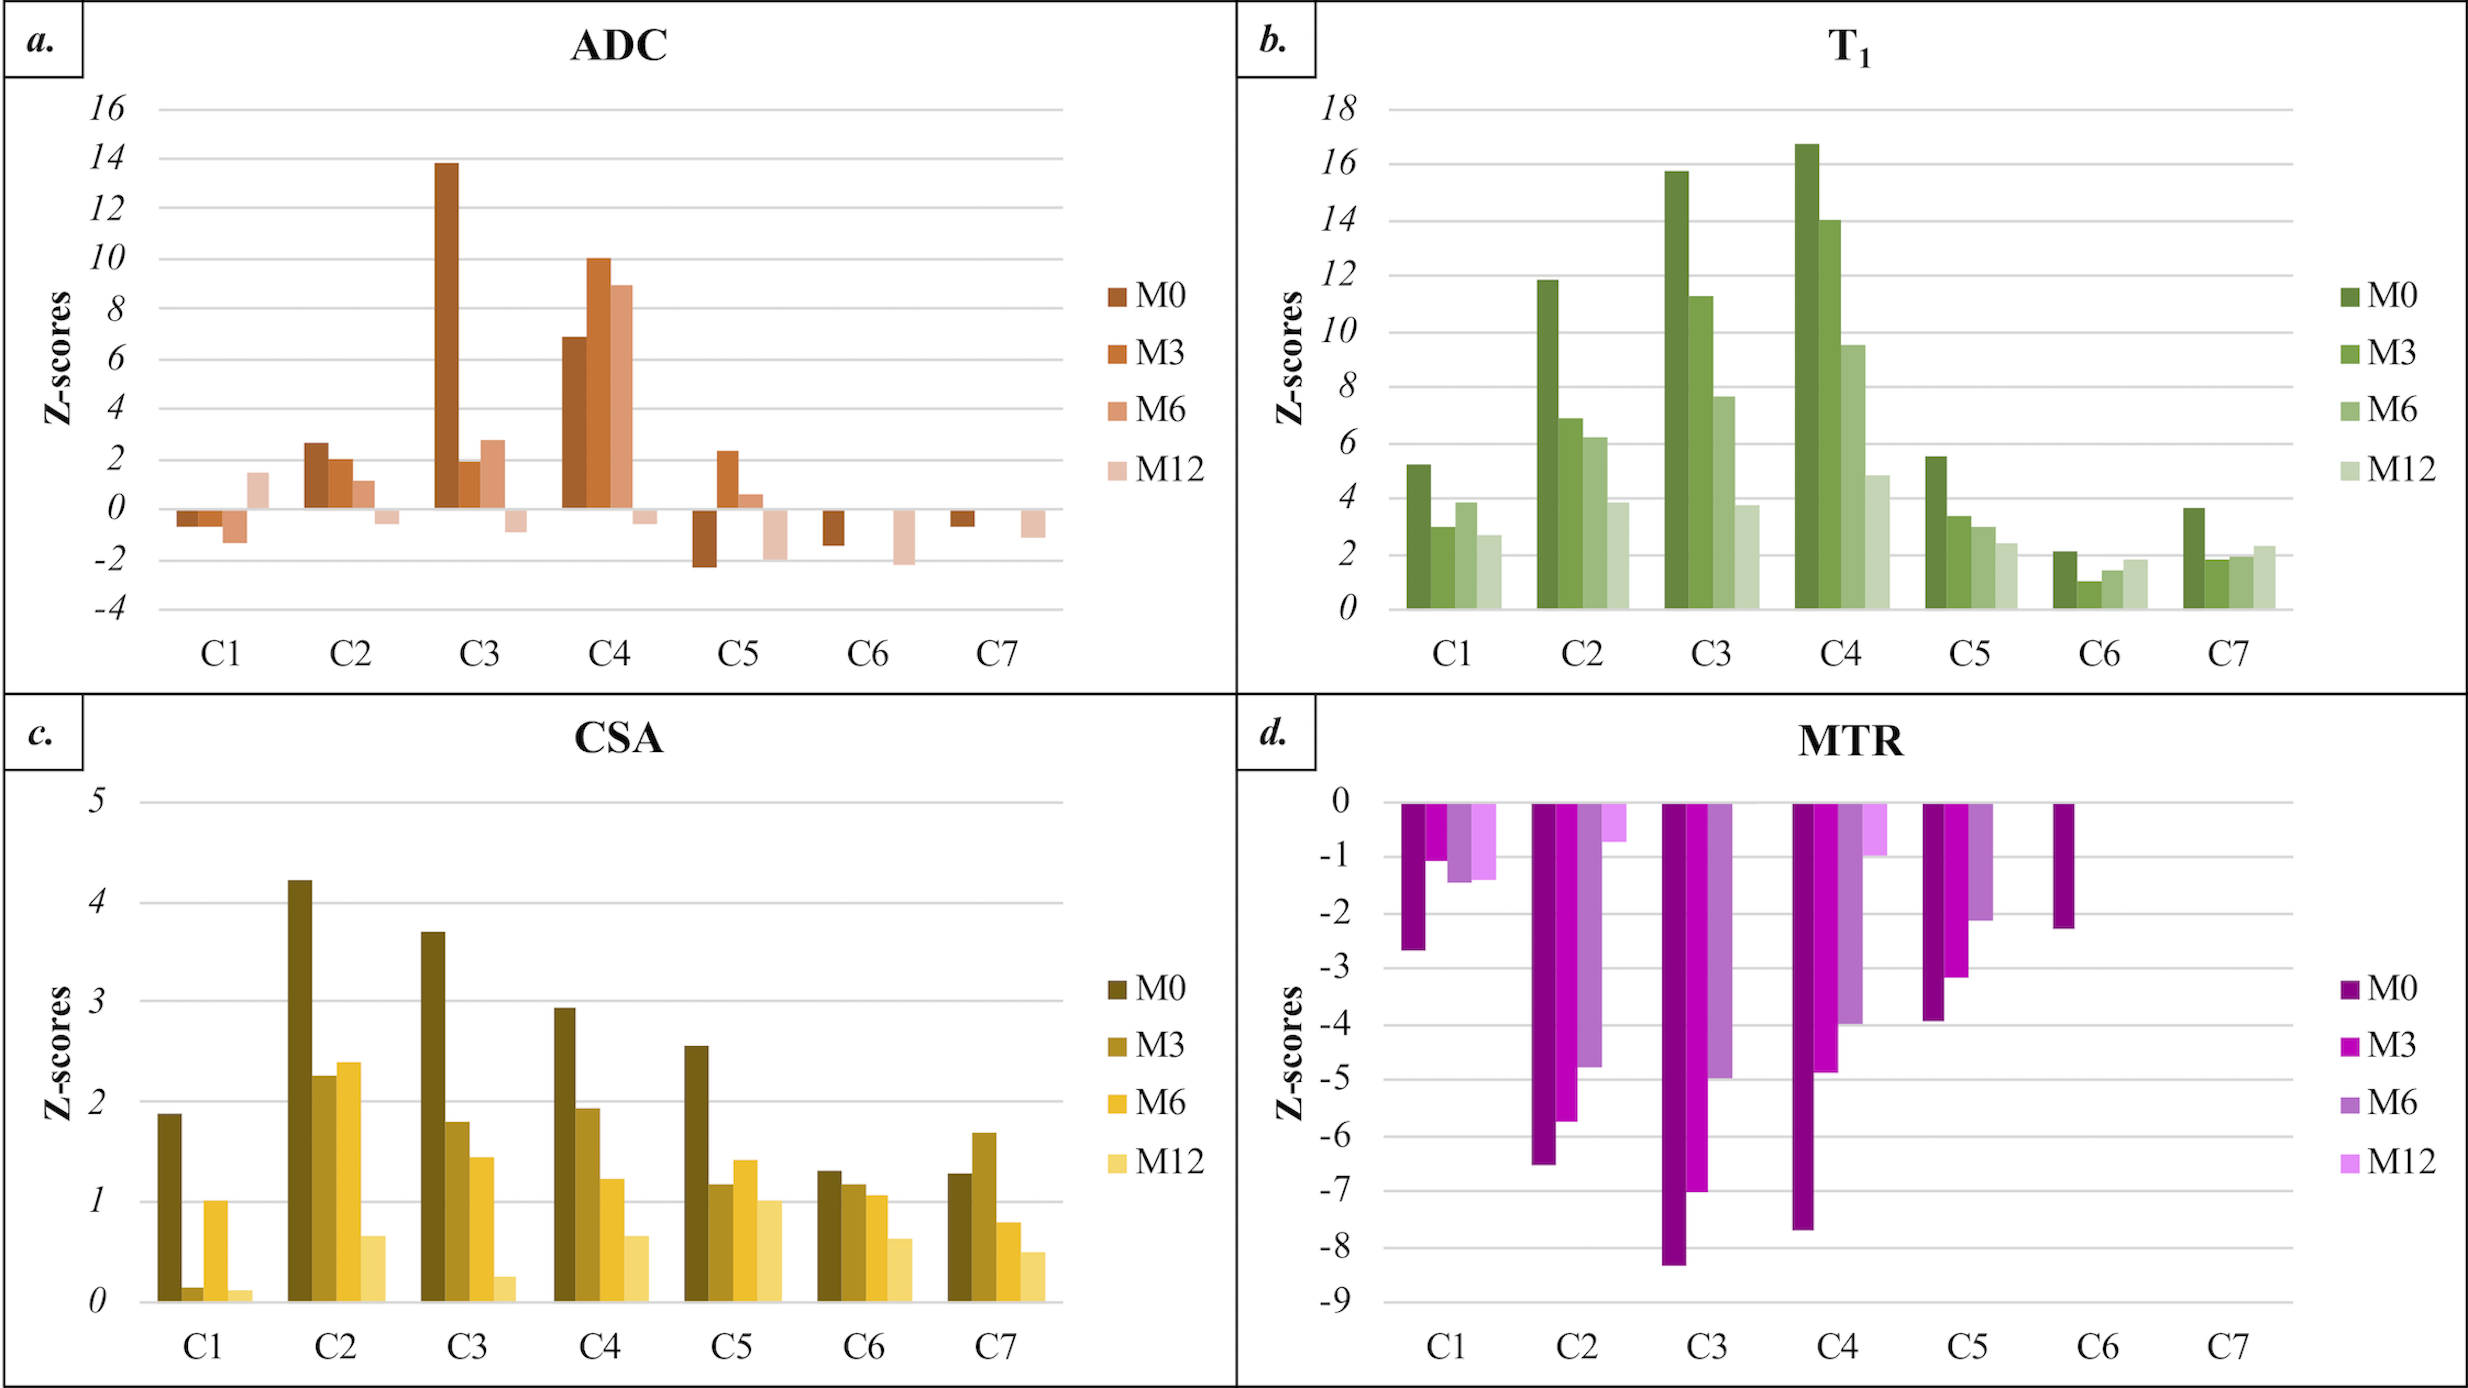
An inflammatory hyperintense T2-w and gadolinium-enhanced SC lesion extending from mid-C1 to mid-C5 was observed in the patient at baseline (M0). It progressively dissolved, remaining gadolinium-enhanced at M3 and M6 but not at M12. Tiny T2-w abnormal fragments remained at C3 and C4 at M12. Figure 1 illustrates the sagittal T2-w and T1 maps at M0 allowing clear depiction of the longitudinal extensive transverse myelitis. Slice-by-slice plots of SC cross-sectional areas (CSA) and T1 values reflecting the cord swelling and the resulting SC microstructural tissue changes with time are presented as well. Illustration of the multi-parametric MR metrics, in particular ADC and T1 maps from the patient’s SC (C1 to C7 levels) at all timepoints are shown in Figure 2 and Figure 3, respectively, together with reference HC images. Finally, Figure 4 shows the temporal and spatial evolution of ADC, T1, CSA and MT z-scores within the patient’s SC. CSA, ADC and T1 values within the patient’s SC were found highly increased, and MTR decreased, particularly at the location of the myelitis. Over the next timepoints (M3, M6 and M12), CSA, MTR and T1 progressively recovered towards normal values, whereas ADC exhibited a slight increase at C4 and C5 at M3 before decreasing towards HC values from M6. At M12, ADC and MT were found in the range of HC values, whereas T1 and CSA remained higher, particularly at C2-C4 and C4-C7, respectively.Discussion / Conclusion
Altogether, all MR metrics showed important pathological variations but T1 and ADC were the metrics of interest for this AQP4-IgG-positive NMO. Indeed, in the presence of the myelitis, MTR and ihMTR were substantially influenced by edema and inflammation, and therefore could not be exclusively used as a myelin marker throughout the follow-ups. Nonetheless, at M12, the values were in the range of HCs’ suggesting myelin preservation, while T1 values still demonstrate tissue suffering. MTR, T1 et CSA exhibited similar spatio-temporal variation dynamics reflecting the cord swelling induced by the myelitis. Afterwards, all of them showed recovering trends as the myelitis progressively vanishes. ADC, on the other hand showed different but interesting spatio-temporal trends, which will be further explored on a larger cohort. Amongst all the explored MR metrics, T1 was the most sensitive to microstructural tissue changes over times. M12 exhibited substantial residual T1 increase relative to HC values between C2-C4, which is possibly linked to the improved but still pathological EDSS score and remaining pyramidal function deficits. To summarize, this exploratory study showed the clinical relevance of a multi-parametric MRI protocol providing different but complementary insights into the spatial and temporal pattern of SC tissue impairments in NMOSD patients, hence paving the way for the next coming multi-centric longitudinal studies.Acknowledgements
No acknowledgement found.References
1. Wingerchuk DM, Hogancamp WF, O’brien PC, Weinshenker BG. The clinical course of neuromyelitis optica (Devic’s syndrome). Neurology. 1999;53(5):1107-1107.
2. Lu Z, Qiu W, Zou Y, et al. Characteristic linear lesions and longitudinally extensive spinal cord lesions in Chinese patients with neuromyelitis optica. J Neurol Sci. 2010;293(1):92-96.
3. Kim J-E, Kim S-M, Ahn S-W, et al. Brain abnormalities in neuromyelitis optica. J Neurol Sci. 2011;302(1):43-48.
4. Benedetti B, Valsasina P, Judica E, et al. Grading cervical cord damage in neuromyelitis optica and MS by diffusion tensor MRI. Neurology. 2006;67(1):161-163.
5. Qian W, Chan Q, Mak H, et al. Quantitative assessment of the cervical spinal cord damage in neuromyelitis optica using diffusion tensor imaging at 3 Tesla. J Magn Reson Imaging. 2011;33(6):1312-1320.
6. Kremer S, Renard F, Achard S, et al. Use of advanced magnetic resonance imaging techniques in neuromyelitis optica spectrum disorder. JAMA Neurol. 2015;72(7):815-822.
7. Klawiter EC, Xu J, Naismith RT, et al. Increased radial diffusivity in spinal cord lesions in neuromyelitis optica compared with multiple sclerosis. Mult Scler J. 2012;18(9):1259-1268.
8. Rocca M, Agosta F, Mezzapesa D, et al. Magnetization transfer and diffusion tensor MRI show gray matter damage in neuromyelitis optica. Neurology. 2004;62(3):476-478.
9. Massire A, Rasoanandrianina H, Taso M, et al. Feasibility of single-shot multi-level multi-angle diffusion tensor imaging of the human cervical spinal cord at 7T. Magn Reson Med. 2018;80(3):947-957.
10. Rasoanandrianina H, Duhamel G, Feiweier T, et al. Regional and structural integrity of the whole cervical spinal cord using 3D-T1 MP2RAGE and multi-slice multi angle DTI and ihMT sequences at 3T: preliminary investigations on age-related changes. In: Proceedings of the 25th Annual Meeting of the ISMRM. Hawai’i, USA; 2017.
11. Girard OM, Callot V, Prevost VH, et al. Magnetization transfer from inhomogeneously broadened lines (ihMT): improved imaging strategy for spinal cord applications. Magn Reson Med. 2017;77(2):581-591.
12. Massire A, Taso M, Besson P, Guye M, Ranjeva JP, Callot V. High-resolution multi-parametric quantitative magnetic resonance imaging of the human cervical spinal cord at 7T. Neuroimage. 2016;143:58-69.
13. Jenkinson M, Beckmann CF, Behrens TEJ, Woolrich MW, Smith SM. FSL. NeuroImage. 2012;62(2):782-790.
14. De Leener B, Lévy S, Dupont SM, et al. SCT: Spinal Cord Toolbox, an open-source software for processing spinal cord MRI data. NeuroImage. 2017;145:24-43.
Figures