0520
High-resolution multiparametric quantitative MRI of the cervical spinal cord at 7T: preliminary results at the early stage of multiple sclerosisAurélien Massire1,2,3, Sarah Demortière1,2,4, Pierre Lehmann1,2,5, Henitsoa Rasoanandrianina1,2,3, Maxime Guye1,2, Bertrand Audoin1,2,4, Jean Pelletier1,2,4, and Virginie Callot1,2,3
1Aix-Marseille Univ, CNRS, CRMBM, Marseille, France, 2APHM, Hôpital Universitaire Timone, CEMEREM, Marseille, France, 3iLab-Spine - Laboratoire international - Imagerie et Biomécanique du rachis, Marseille, France, 4APHM, Hôpital Universitaire Timone, Service de Neurologie, Marseille, France, 5APHM, Hôpital Universitaire Timone, Service de Neuroradiologie, Marseille, France
Synopsis
In this exploratory study, a high-resolution multiparametric quantitative MRI protocol including T1 mapping and diffusion tensor imaging was used to explore the cervical spinal cord of multiple sclerosis patients at 7T, in comparison to healthy controls. These patients were also explored at 3T to investigate the potential benefits of 7T MRI in terms of lesion detection and delineation. The obtained preliminary results showed an improved qualitative anatomical depiction when compared to clinical fields and for the first time an in vivo multiparametric quantitative characterization of the pathological cervical spinal cord in multiple sclerosis at ultra-high field.
Introduction
By enabling increased spatial resolution and contrast, ultra-high field (UHF) MRI offers new opportunities to investigate multiple sclerosis (MS) in the brain1. Because of several technical challenges, only a handful of studies have started exploring the benefits of UHF for cervical spinal cord (SC) imaging on healthy volunteers, using anatomical2-4 and quantitative imaging4-5. Clinical applications of 7T SC MRI are still in their early stages2, with studies reporting enhanced MS lesion detection using anatomical imaging in the cervical6 and thoracic7 SC, when compared to optimized protocols at 3T. High-resolution multiparametric quantitative MRI (mp-qMRI) is only emerging at UHF8-9, yet could provide new insights on the pathological SC in MS10. In this study, a high-resolution mp-qMRI protocol, including T1 mapping and Diffusion Tensor Imaging (DTI), was employed at 7T to characterize the cervical SC in a cohort of MS patients at the early stage of the disease and to further investigate pathological features and structural damage.Methods
Experiments were performed on a 7T whole-body research system (Siemens Healthineers) equipped with an eight-channel transceiver coil array (Rapid Biomedical). Seven MS patients at the early stage of the disease (6women/1man, age: 30±7yo, EDSS scores: 1.5±1 [0-3], median disease durations <3yo) and seven healthy controls (5w/2m, age: 24±5yo) were enrolled. The protocol included high-resolution anatomical imaging using T2*-weighted MEDIC sequence, T1 mapping relying on two 3D transverse MP2RAGE acquisitions8 and DTI with a reduced-FOV diffusion-weighted single-shot spin-echo EPI sequence9. Acquisition parameters are provided in Figure_1. All patients were also examined at 3T using conventional MRI. MS lesions were first identified at 3T and then at 7T based on T2*-weighted images and T1 maps (consensus between a neurologist and a neuroradiologist). Mp-qMRI post-processing4,8-9 was done using MATLAB (The Mathworks), PropSeg11, the Spinal Cord Toolbox12 and FSL13 (FMRIB). 3D T1 maps were resliced and registered to DTI maps at each cervical level. C1-to-C7 T1 maps were manually segmented in four regions of interest (ROI): normal appearing (NA) GM and WM, GM and WM lesions. GM/WM cross sectional areas (CSA) were measured on T1 maps. Statistical analyses were performed using all-pairs Wilcoxon (CSA) and multiple comparison Steel-Dwass (mp-qMRI) non-parametric tests on JMP9 (SAS). Evolutions of T1 with distance from meninges were also investigated.Results
Figure_2 presents the main findings in terms of lesion detection and delineation from the 7T/3T qualitative radiological investigation. Lesions were mostly found in lateral (65%) and posterior WM (26%), comparable to the litterature14. Examples of DTI maps, resliced T1 maps and manually segmented ROI at every cervical level are shown on Figure_3. Overall, 1/3 of the DTI data had to be discarded because of artifacts, mostly at lower levels. Mp-qMRI and statistical analyses results, reported in Figure_4, showed increased T1, decreased λ//, λ┴ and MD in MS lesions located within the WM. Interestingly, only increased T1 was reported for GM lesions. As for NA tissue, no statistically significant differences relative to healthy controls were found. Figure_5 reports mean CSA measured on the two cohorts, with lower CSA found for patients; and mean T1 values plotted versus the distance from the outer cerebrospinal fluid or the central canal, with different T1 evolutions for lateral and posterior NAWM tissue in MS patients.Discussion
The images obtained at 7T had very high in-plane resolution, enabling improved MS lesions delineation and exquisite anatomical details visualization, including central canal, anterior fissure and posterior septum, which were in majority larger in patients compared to healthy controls (see Figure 2). Figure_5 also suggests these enlargements as a possible cause for increased T1 values in proximate lateral and posterior NAWM. Although not specific, the T1/DTI results indicate MS-related microstructural impairments (axonal loss, demyelination) along with related WM atrophy, as previously reported by the litterature15. It is worth noting that DTI differences were less sensitive than T1 changes16 for MS lesions due to several confounding factors, especially for GM. In terms of spatial coverage, the C1-to-C7 10-mm slices used for analyses sampled 75% of the cervical SC on average. Full exploitation of the 3D MP2RAGE volumes will be subject to future work to obtain an exhaustive characterization of the whole cervical SC. Additional patients and matched healthy controls will be included to confirm these results. Future work is also aimed towards improving the robustness of 7T mp-qMRI (sources of artifacts included movements, partial volume effect and poor B0 shimming) and fully demonstrating its advantages as compared to mp-qMRI at clinical lower fields.Conclusion
Overall, these preliminary results showed the great potentials of high-resolution mp-qMRI for MS investigations at UHF. By using T1 mapping especially, specific anatomical features and microstructural characterization were enhanced (atrophy with enlargement of the median fissure, dilatation of central canal and septum).Acknowledgements
This work was supported by the following funding sources: ARSEP Foundation “Fondation pour l’Aide à la Recherche sur la Sclérose En Plaques”, Investissements d’Avenir 7T-AMI-ANR-11-EQPX-0001, and CNRS (Centre National de la Recherche Scientifique).References
1Inglese et al., Expert Review of Neurotherapeutics 2018. 2Barry et al., NeuroImage 2017. 3Sigmund et al., NMR in Biomed 2012. 4Massire et al., NeuroImage 2016. 5Kogan et al., NeuroImage 2013. 6Dula et al., Multiple Sclerosis 2016. 7Lefeuvre et al., ISMRM 2016. 8Massire et al., ISMRM 2018. 9Massire et al., Magn Reson Med 2018. 10Dula et al., NMR Biomed 2016, 11De Leener et al., NeuroImage 2016. 12De Leener et al., NeuroImage 2014. 13Jenkinson et al., NeuroImage 2012. 14Kearney et al., Neurology 2016. 15Kearney et al., Mult Scler 2014. 16Mottershead et al., J Neurol 2003.Figures
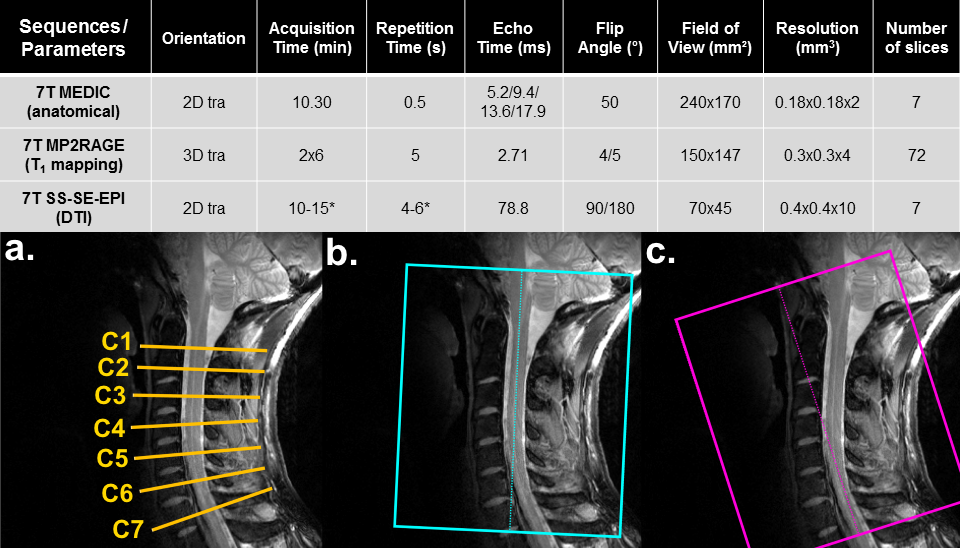
Figure 1: Sequence parameters used at 7T in
this study. a: DTI slices were
positioned at each cervical level perpendicular to the cord. Additional
specific parameters were: diffusion direction: 30, repetitions: 4, parallel
imaging acceleration factor: 2. MP2RAGE volumes were tilted to minimize partial
volume effect contamination due to the SC curvature (b: first volume aligned to upper cord, c: second volume aligned to lower cord). Additional specific
parameters were: inversion times: 0.7/2.4s and parallel imaging acceleration
factor: 2. B1+ mapping was used to correct for biased T1
estimation4.
NB: *Pulse oximeter triggering.
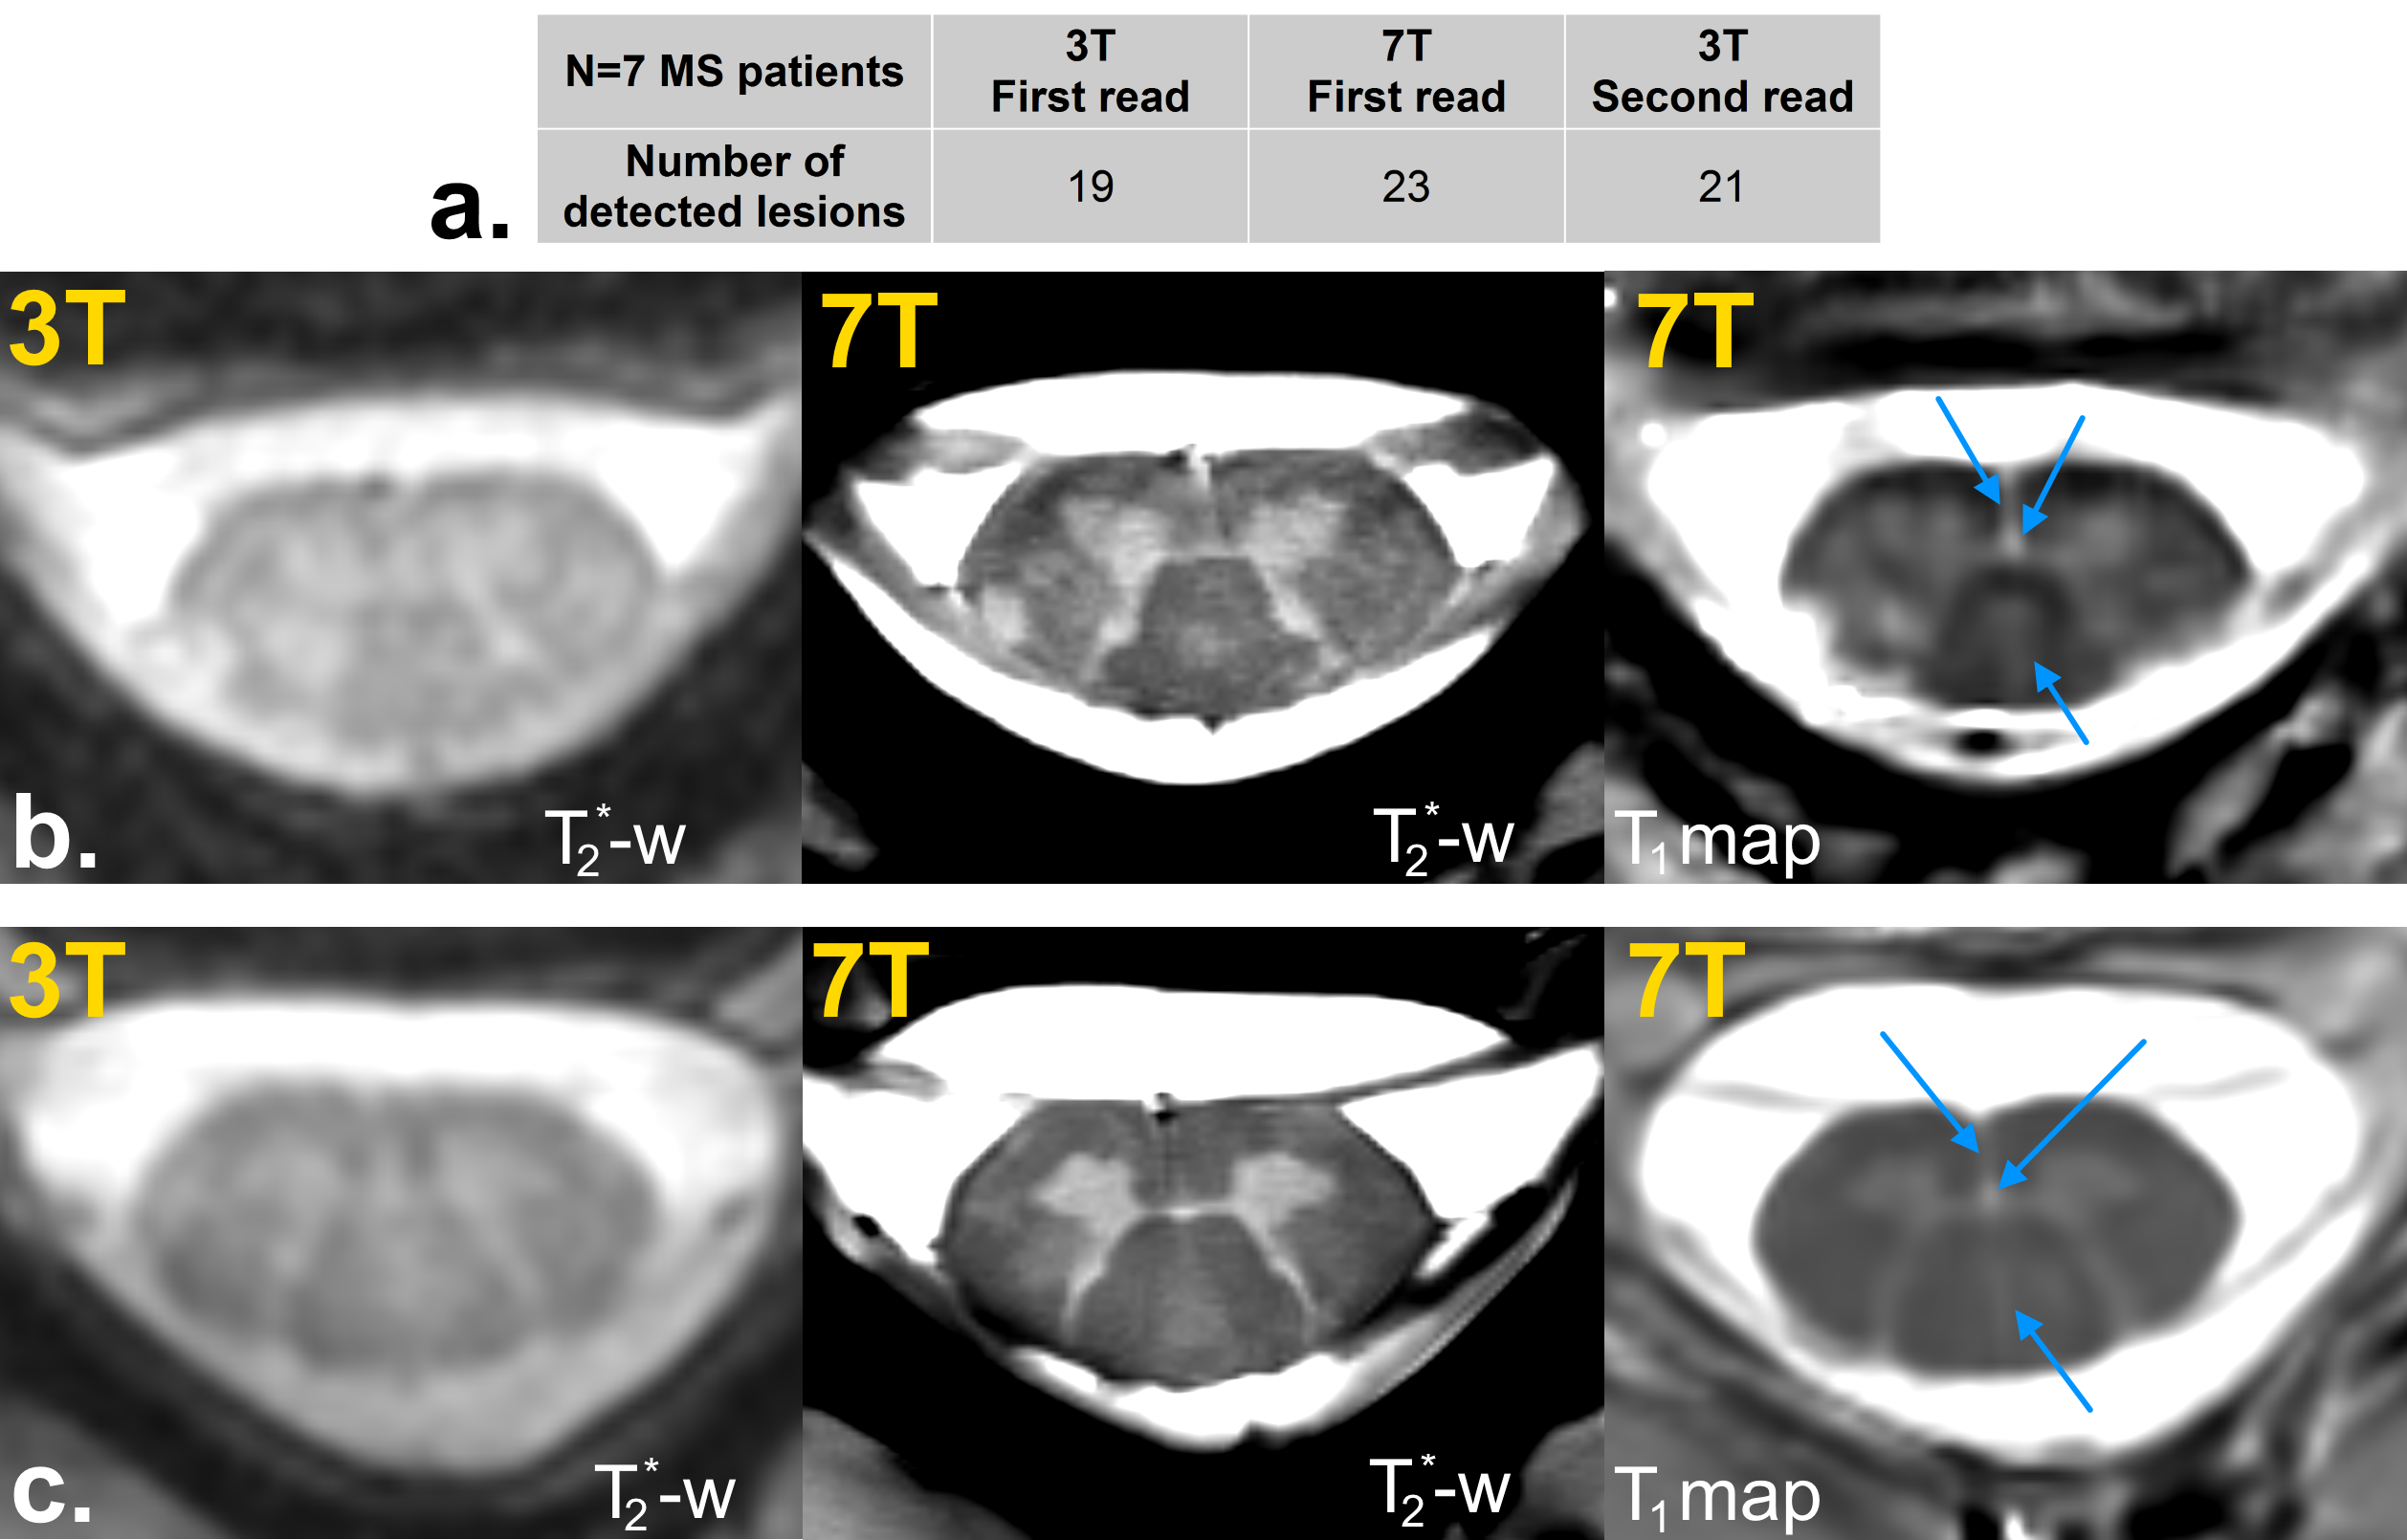
Figure 2: a: Radiological study
results leading to 17% of missed lesions at 3T as compared to 7T evaluation
during the 1st read (4/23 lesions). When looking back at 3T
images after 7T, 9% remain unseen at 3T (2/23). Overall,
lesion delineation was judged largely improved by both experts thanks to better
resolution and contrast. b: Case of
a lesion seen at both fields, but with a better delineation at 7T. c: Case of a lesion which was not identified
at 3T at first glance but only after 7T reading. Note that central canal,
anterior fissure and posterior septum
are very well depicted (blue arrows).
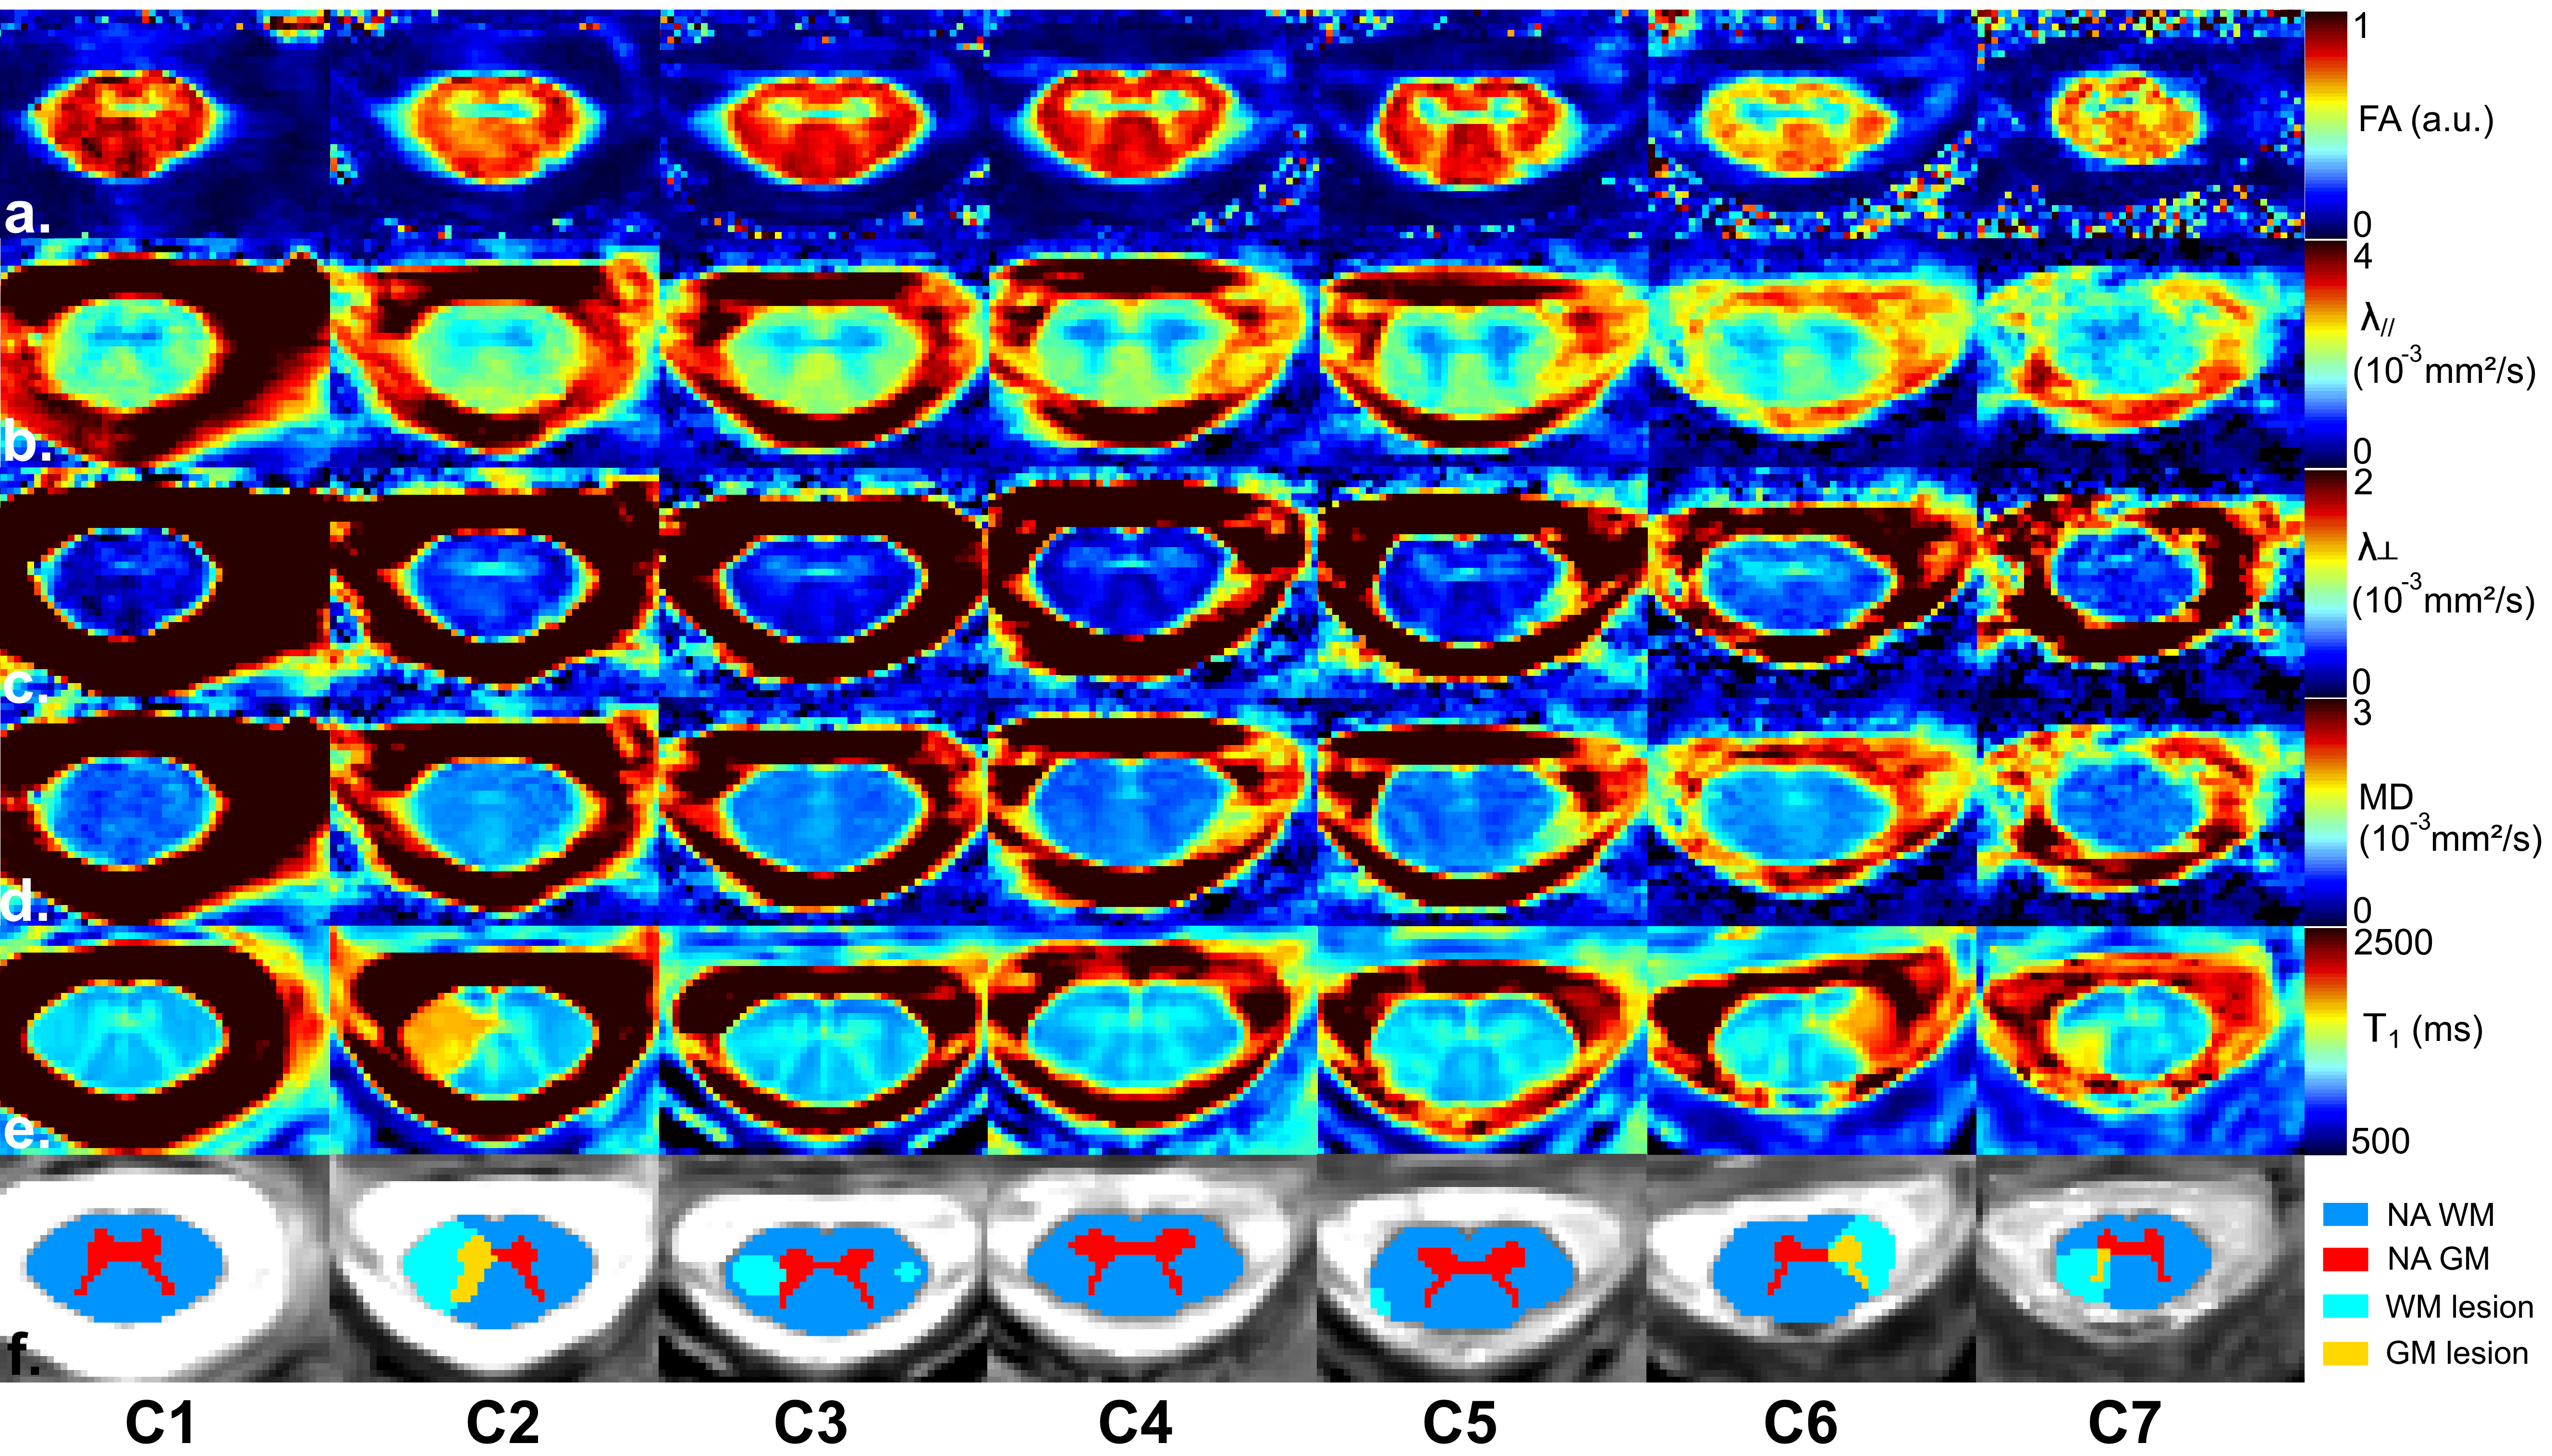
Figure 3: Mp-qMRI on a MS patient (male,
39yo, EDSS: 2). Diffusion Tensor
Imaging maps (a: FA, b: λ//, c: λ┴, d: MD) obtained after post-processing
(image distortion correction, data denoising), e: T1 maps resliced at each cervical level and resampled
to DTI spatial resolution and f: corresponding
manually segmented ROI on T1 maps (NAGM: red - NAWM: blue - GM MS lesions:
yellow - WM MS lesions: light blue). Note that DTI maps are slightly artifacted
at C7 level.
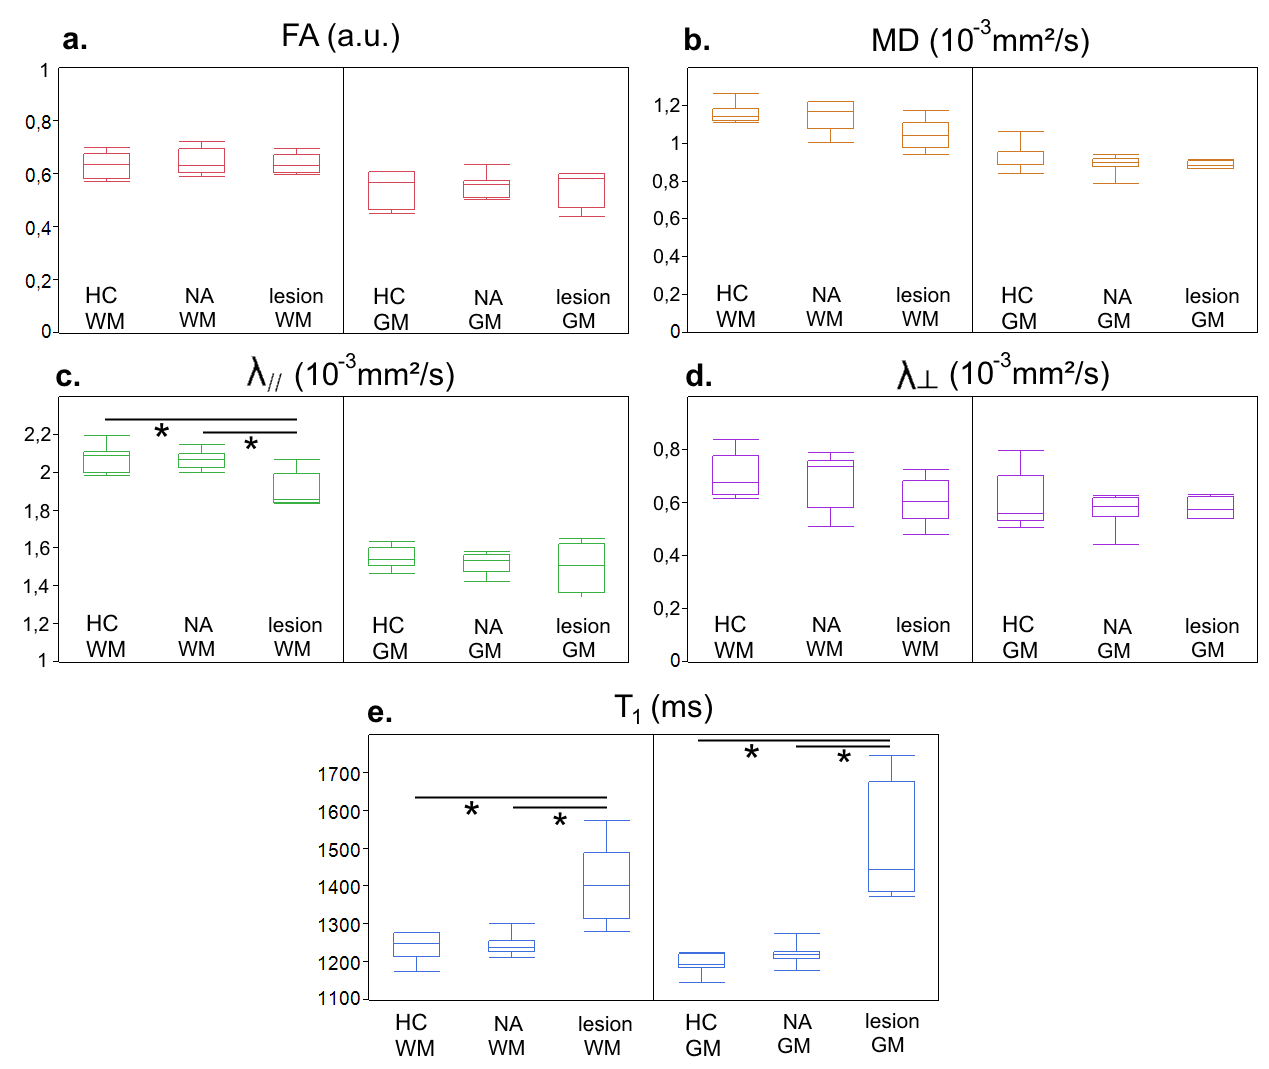
Figure 4: Quantitative mp-qMRI results (boxplots:
median, quartile, minimum and maximum) at 7T (a: FA, b: MD, c: λ//, d: λ┴, e: T1) in 4 ROI (left:
healthy control (HC) WM, NAWM and WM MS lesions, right: HC GM, NAGM and GM MS
lesions) between healthy controls and patients, with statistical analysis
results (p-values <0.05 considered significant).
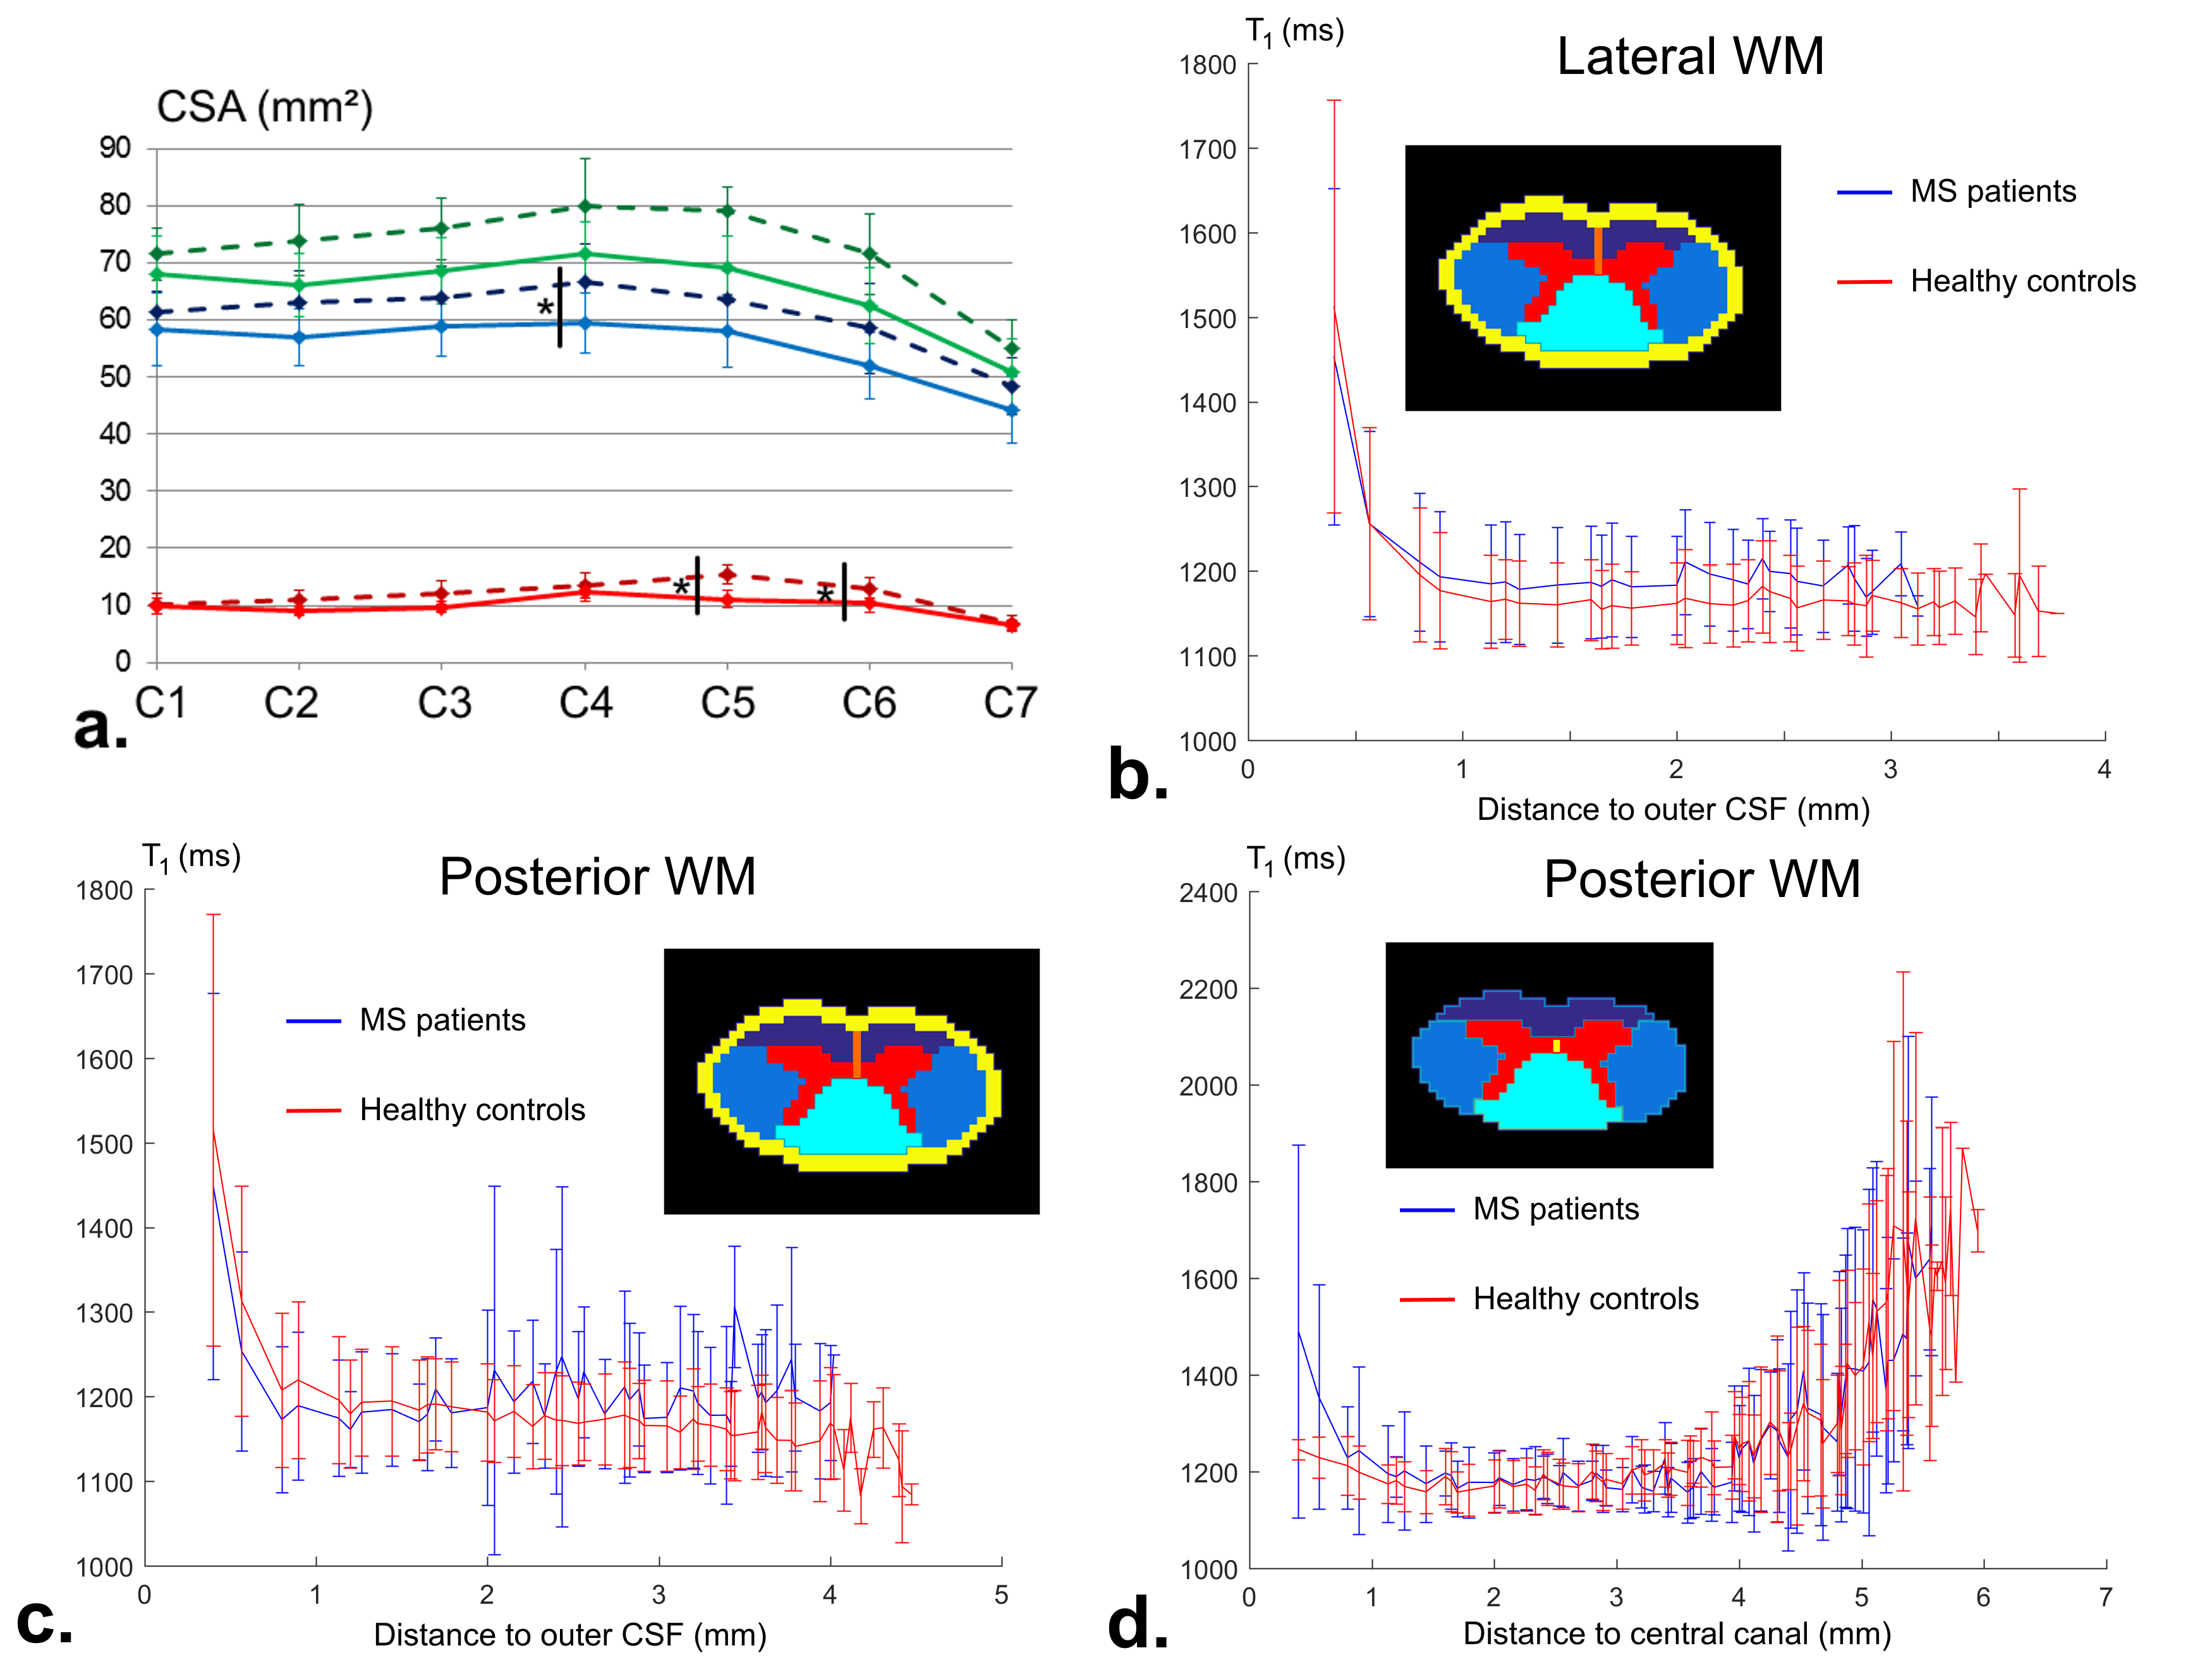
Figure 5: a: C1-to-C7 cross sectional areas measurements (red-GM, blue-WM, green-SC)
for MS patients (solid lines) and healthy controls (dotted lines). Mean ±SD T1
values (blue-patients, red-HC) plotted for lateral (b) and posterior NAWM (c-d)
versus the distance to outer cerebrospinal fluid (b-c, yellow ring) and central canal (d, yellow dot), considering all levels. A positive offset distal
from the CSF was observed for patients in lateral NAWM, while for posterior NAWM
the enlargement of both central canal and septum
for patients are likely to explain the increased T1 values seen
distally from outer CSF and proximally from central canal (no statistical
analyses conducted yet).