0518
Accelerated Spectral Fitting Using Convolutional Neural Networks1Radiation Oncology, Emory University, Atlanta, GA, United States, 2Radiology and Imaging Sciences, University of Miami, Miami, FL, United States, 3Biomedical Informatics, Emory University, Atlanta, GA, United States, 4Radiology and Imaging Sciences, Emory University, Atlanta, GA, United States
Synopsis
3D whole-brain spectroscopic MRI can measure quantitative metabolite concentrations without any contrast agents and is useful in identifying occult glioblastoma beyond that seen on standard MRI. However, a key hurdle in its widespread adoption is spectral fitting, which can take up to an hour for scan consisting of ~10,000 voxels. In this work, we develop a deep learning architecture for rapid spectral fitting within the context of an a priori spectral model. We demonstrate that this architecture can perform whole-brain spectral fitting in <30 seconds, pushing spectroscopic MRI towards on-board scanner processing to fit in the rapid clinical workflow.
Introduction
Proton spectroscopic magnetic resonance imaging is an imaging modality capable of generating high-resolution 3D maps of cerebral metabolites concentrations in vivo (1-3). Maps of individual metabolite distributions are created by quantifying the metabolite resonance peaks, a process known as spectral fitting. Several parametric analysis methods for spectral fitting algorithms have been developed (4-10), all of which rely on iterative optimization procedures to find the model parameters that best match the data. However, these methods do not scale well to volumetric spectroscopic imaging, which can contain on the order of 10,000 spectra in a whole-brain scan. A concept in machine learning that correlates well to curve fitting is the idea of the encoder-decoder, or autoencoder. Autoencoders are a type of unsupervised learning neural network that seek to find a compressed encoding of input data such that the input data can be accurately reconstructed from this parsimonious encoding (11, 12). To leverage the feature-learning capabilities of autoencoders while staying within the context of known spectral models, a novel spectral fitting algorithm was developed that utilized a convolutional neural network encoder with a model-based decoding of the spectrum. We evaluated this method for fitting in whole-brain spectroscopic MRI of the brain.Methods
Echo planar spectroscopic imaging (EPSI) scans were performed on four normal subjects and six subjects with glioblastoma at Emory University. Spatial reconstruction of the data, B0 correction, co-registration with anatomic MRI, and lipid and water suppression were performed in the MIDAS (13, 14) software package. A total of 102,005 spectra were obtained and separated into three data subsets: 85,661 for training; 8,192 for validation; and 8,192 for testing. For assessing generalizability, additional data from subjects with glioblastoma from Emory University, the University of Miami, and the Johns Hopkins University, were evaluated.
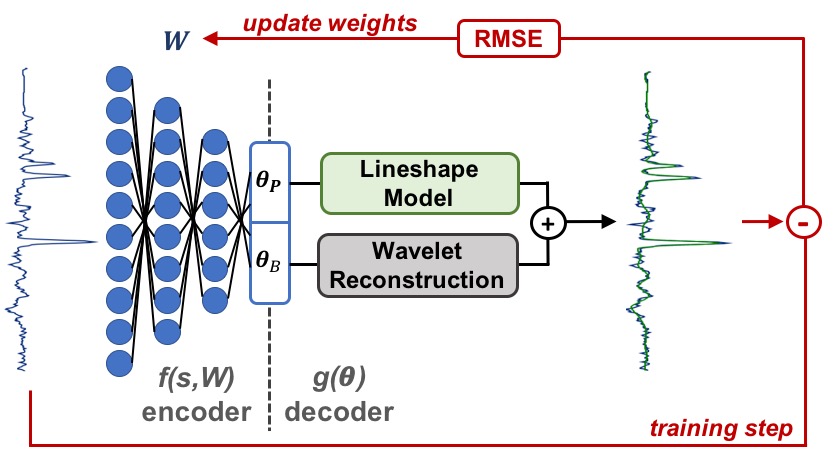
A new neural network architecture, named a convolutional encoder – model decoder (CEMD) was developed (Figure 1). CEMD takes as input the real component of a spectrum and passes it through a convolutional neural network (CNN) to encode the signal into a latent space with 42 parameters. These 42 parameters are then explicitly used as coefficients for a Lorentzian-Gaussian peak model and for a wavelet-shrinkage baseline model, as previously described (5, 6). Using this model, the singlets for Choline (Cho), Creatine (Cr), and N-acetylaspartate (NAA) are parameterized to compute the relative concentration of each metabolite. The root mean squared error between the fitted and input spectrum is used as the cost function to train the weights of the CNN encoder. A software pipeline to perform CEMD fitting on whole-brain images and to generate volumetric metabolite and ratios maps was developed using Python.
Results
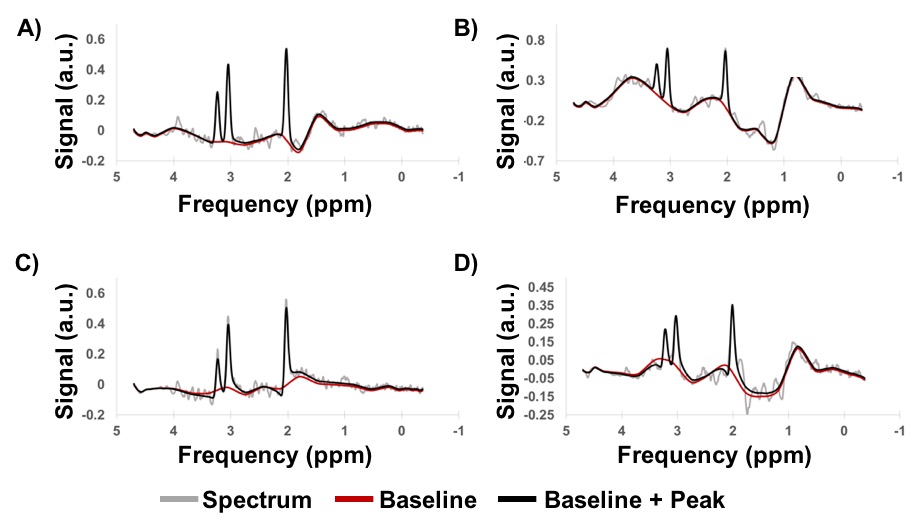
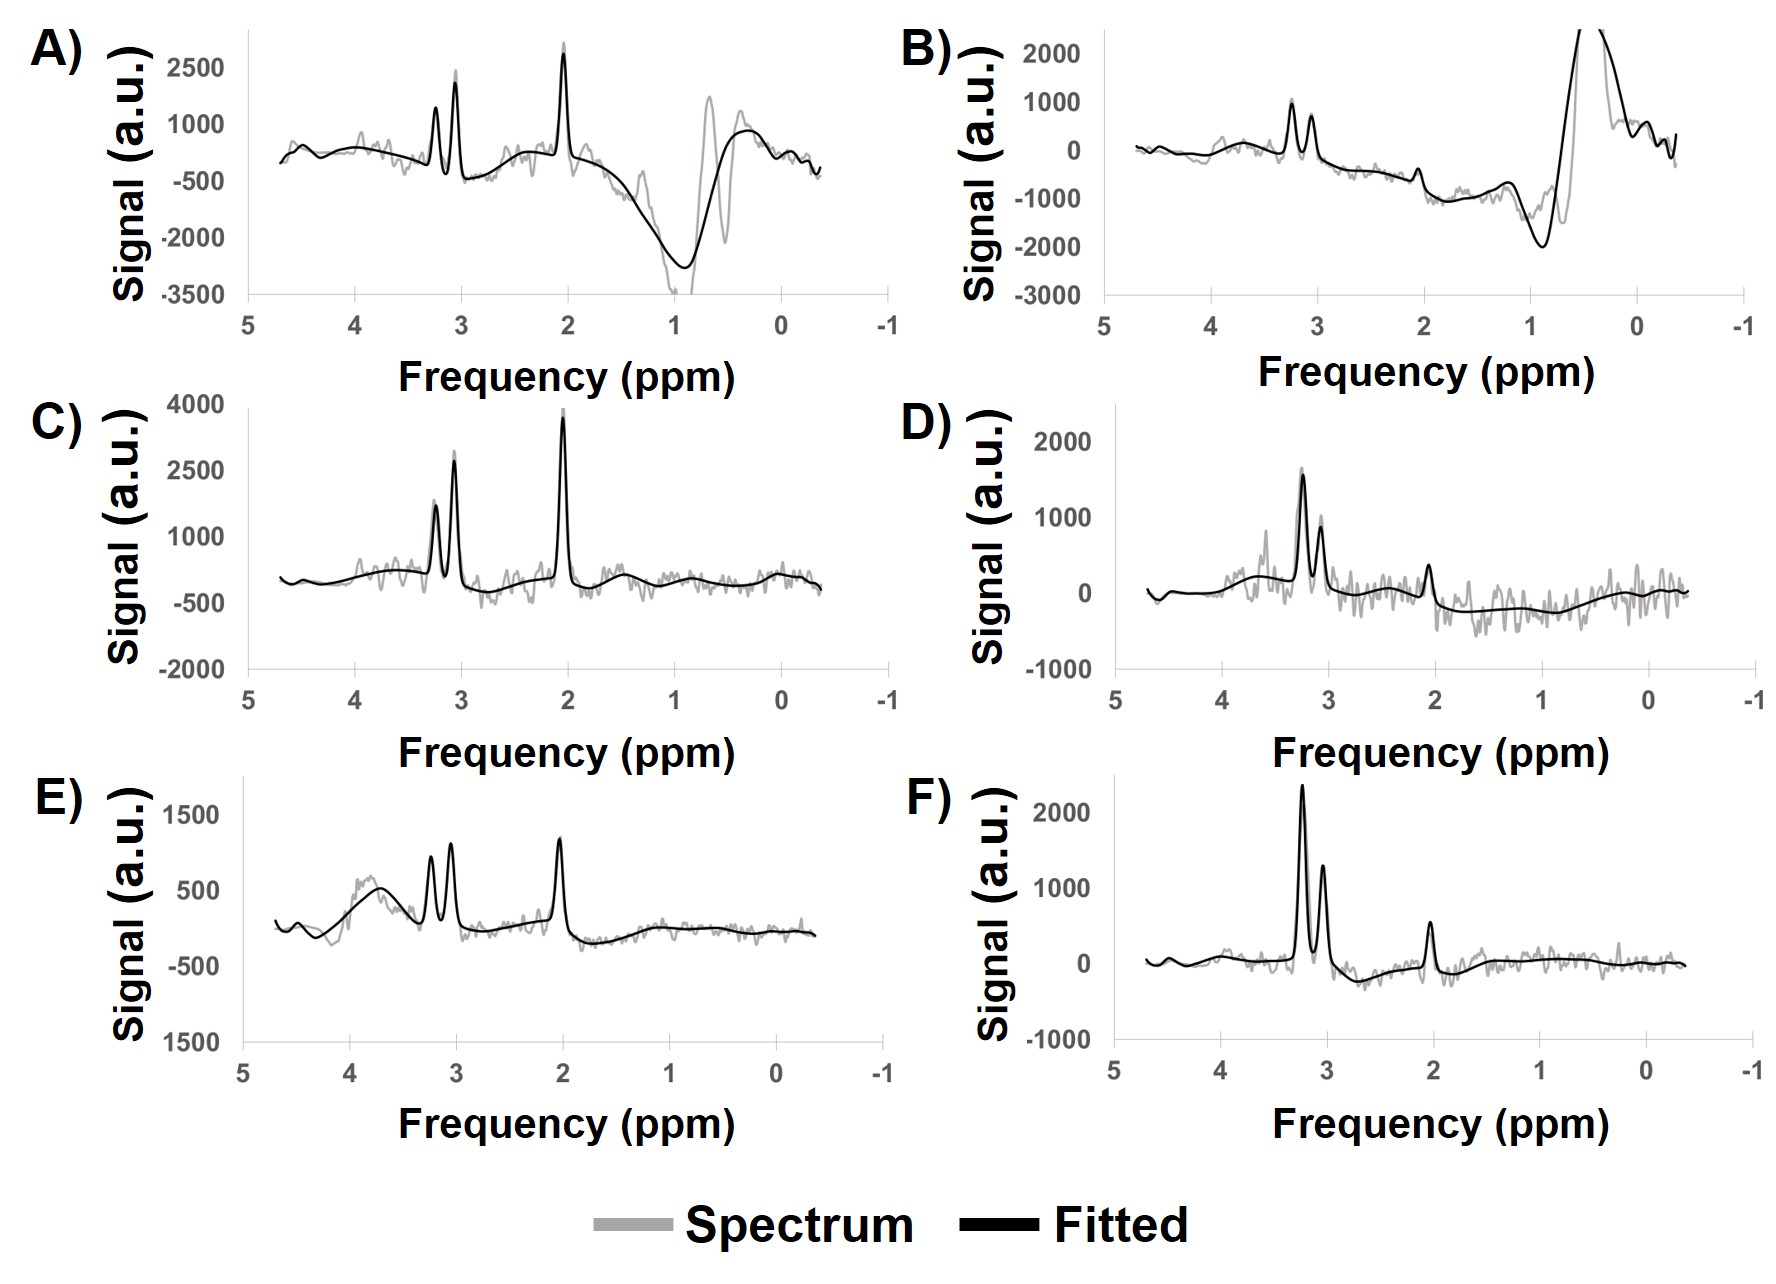
The testing set achieved a mean RMSE of fit of 5.0% normalized to the amplitude of the largest peak in each spectrum in the testing set, with a standard deviation of 0.6%. Sample spectra from the testing set are shown in Figure 2, with the baseline (red) and peak + baseline (black) fit overlaid on the input spectra (gray). Sample spectra from three subjects with glioblastoma, not included in the training, testing, or validation sets, are shown in Figure 3. In patients with glioblastoma, voxels within the region of active tumor exhibit an increase in Cho and a concomitant decrease in NAA (3). The CEMD-fitted spectra (black) are overlaid on the input spectra (gray). Subject one (Figure 3A,B) was scanned at Emory University; subject two (Figure 3C,D) was scanned at the University of Miami; and subject three (Figure 3E,D) was scanned at the Johns Hopkins University.
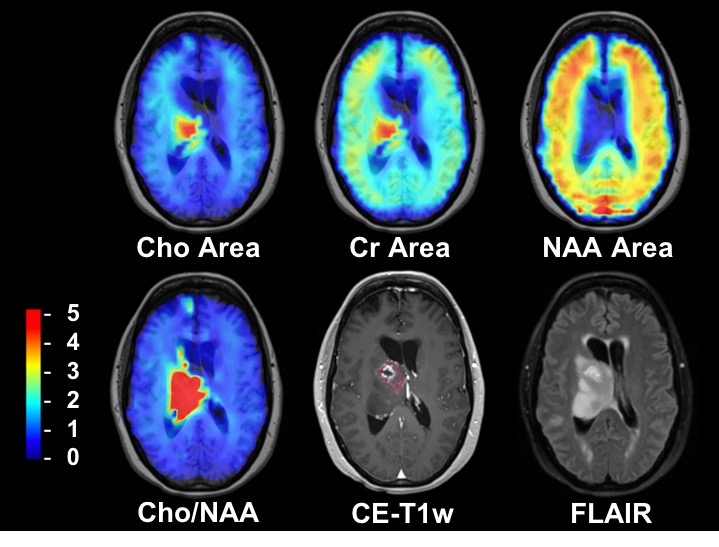
The mean execution time for whole-brain spectral fitting was 20.6 seconds using the CEMD. Results of the CEMD analysis for studies of a subject with glioblastoma, not included in the training set, are shown in Figure 4, which shows the individual metabolite maps, the Cho/NAA ratio map, and corresponding contrast-enhanced T1-weighted (CE-T1w) and fluid-attenuated inversion recovery (FLAIR) MRI volumes.
Conclusion
In this work, a machine learning approach to spectral fitting is described that can perform sub-minute calculation of relative metabolite concentrations on whole-brain data. A convolutional encoder-model decoder technique has been implemented that explicitly incorporates a standard parametric spectral model with the power of unsupervised feature-learning to produce fast spectral fittings that are constrained by the standard model. With this new autoencoder-based neural network, the largest computational bottleneck in processing spectroscopy can be overcome, bringing improved performance that will support the implementation of volumetric spectroscopy in clinical use.Acknowledgements
This work was supported by the following grants from the National Institutes of Health: U01 EB028145, R01 CA172210, and F30 CA206291.References
1. Law M, Cha S, Knopp EA, Johnson G, Arnett J, Litt AW. High-grade gliomas and solitary metastases: differentiation by using perfusion and proton spectroscopic MR imaging. Radiology. 2002;222(3):715-21.
2. Soares DP, Law M. Magnetic resonance spectroscopy of the brain: review of metabolites and clinical applications. Clin Radiol. 2009;64(1):12-21.
3. Cordova JS, Shu H-KG, Liang Z, Gurbani SS, Cooper LAD, Holder CA, et al. Whole-brain spectroscopic MRI biomarkers identify infiltrating margins in glioblastoma patients. Neuro Oncol. 2016;18(8):1180-9.
4. Provencher SW. Automatic quantitation of localized in vivo1H spectra with LCModel. NMR Biomed. 2001;14(4):260-4.
5. Young K, Soher BJ, Maudsley AA. Automated spectral analysis II: application of wavelet shrinkage for characterization of non-parameterized signals. Magn Reson Med. 1998;40(6):816-21.
6. Soher BJ, Young K, Govindaraju V, Maudsley AA. Automated spectral analysis III: application to in vivo proton MR spectroscopy and spectroscopic imaging. Magn Reson Med. 1998;40(6):822-31.
7. Stefan D, Di Cesare F, Andrasescu A, Popa E, Lazariev A, Vescovo E, et al. Quantitation of magnetic resonance spectroscopy signals: the jMRUI software package. Measurement Science and Technology. 2009;20(10):104035.
8. Wilson M, Reynolds G, Kauppinen RA, Arvanitis TN, Peet AC. A constrained least-squares approach to the automated quantitation of in vivo 1H magnetic resonance spectroscopy data. Magnetic Resonance in Medicine. 2010;65(1):1-12.
9. Lam F, Liang ZP. A subspace approach to high‐resolution spectroscopic imaging. Magnetic resonance in medicine. 2014;71(4):1349-57.
10. Reynolds G, Wilson M, Peet A, Arvanitis TN. An algorithm for the automated quantitation of metabolites in in vitro NMR signals. Magnetic Resonance in Medicine. 2006;56(6):1211-9.
11. Liou C-Y, Huang J-C, Yang W-C. Modeling word perception using the Elman network. Neurocomputing. 2008;71(16):3150-7.
12. Hinton GE, Salakhutdinov RR. Reducing the dimensionality of data with neural networks. Science. 2006;313(5786):504-7.
13. Maudsley AA, Domenig C, Govind V, Darkazanli A, Studholme C, Arheart K, et al. Mapping of brain metabolite distributions by volumetric proton MR spectroscopic imaging (MRSI). Magn Reson Med. 2009;61(3):548-59.
14. Sabati M, Sheriff S, Gu M, Wei J, Zhu H, Barker PB, et al. Multivendor implementation and comparison of volumetric whole-brain echo-planar MR spectroscopic imaging. Magn Reson Med. 2015;74(5):1209-20.
Figures