0516
Estimation of Brain Tissue Composition and Voxel Location in MR Spectroscopy Using Neural Networks1Radiology, Brigham and Women's Hospital, Boston, MA, United States, 2Electrical and Computer Engineering, Boston University, Boston, MA, United States
Synopsis
This work presents a machine learning method to estimate the tissue partial volumes of gray matter (GM), white matter (WM) and cerebrospinal fluid (CSF), in a given MR spectroscopy voxel, providing an alternative to the standard time‑intensive MRI segmentation pipeline. The tissue composition was determined
Introduction
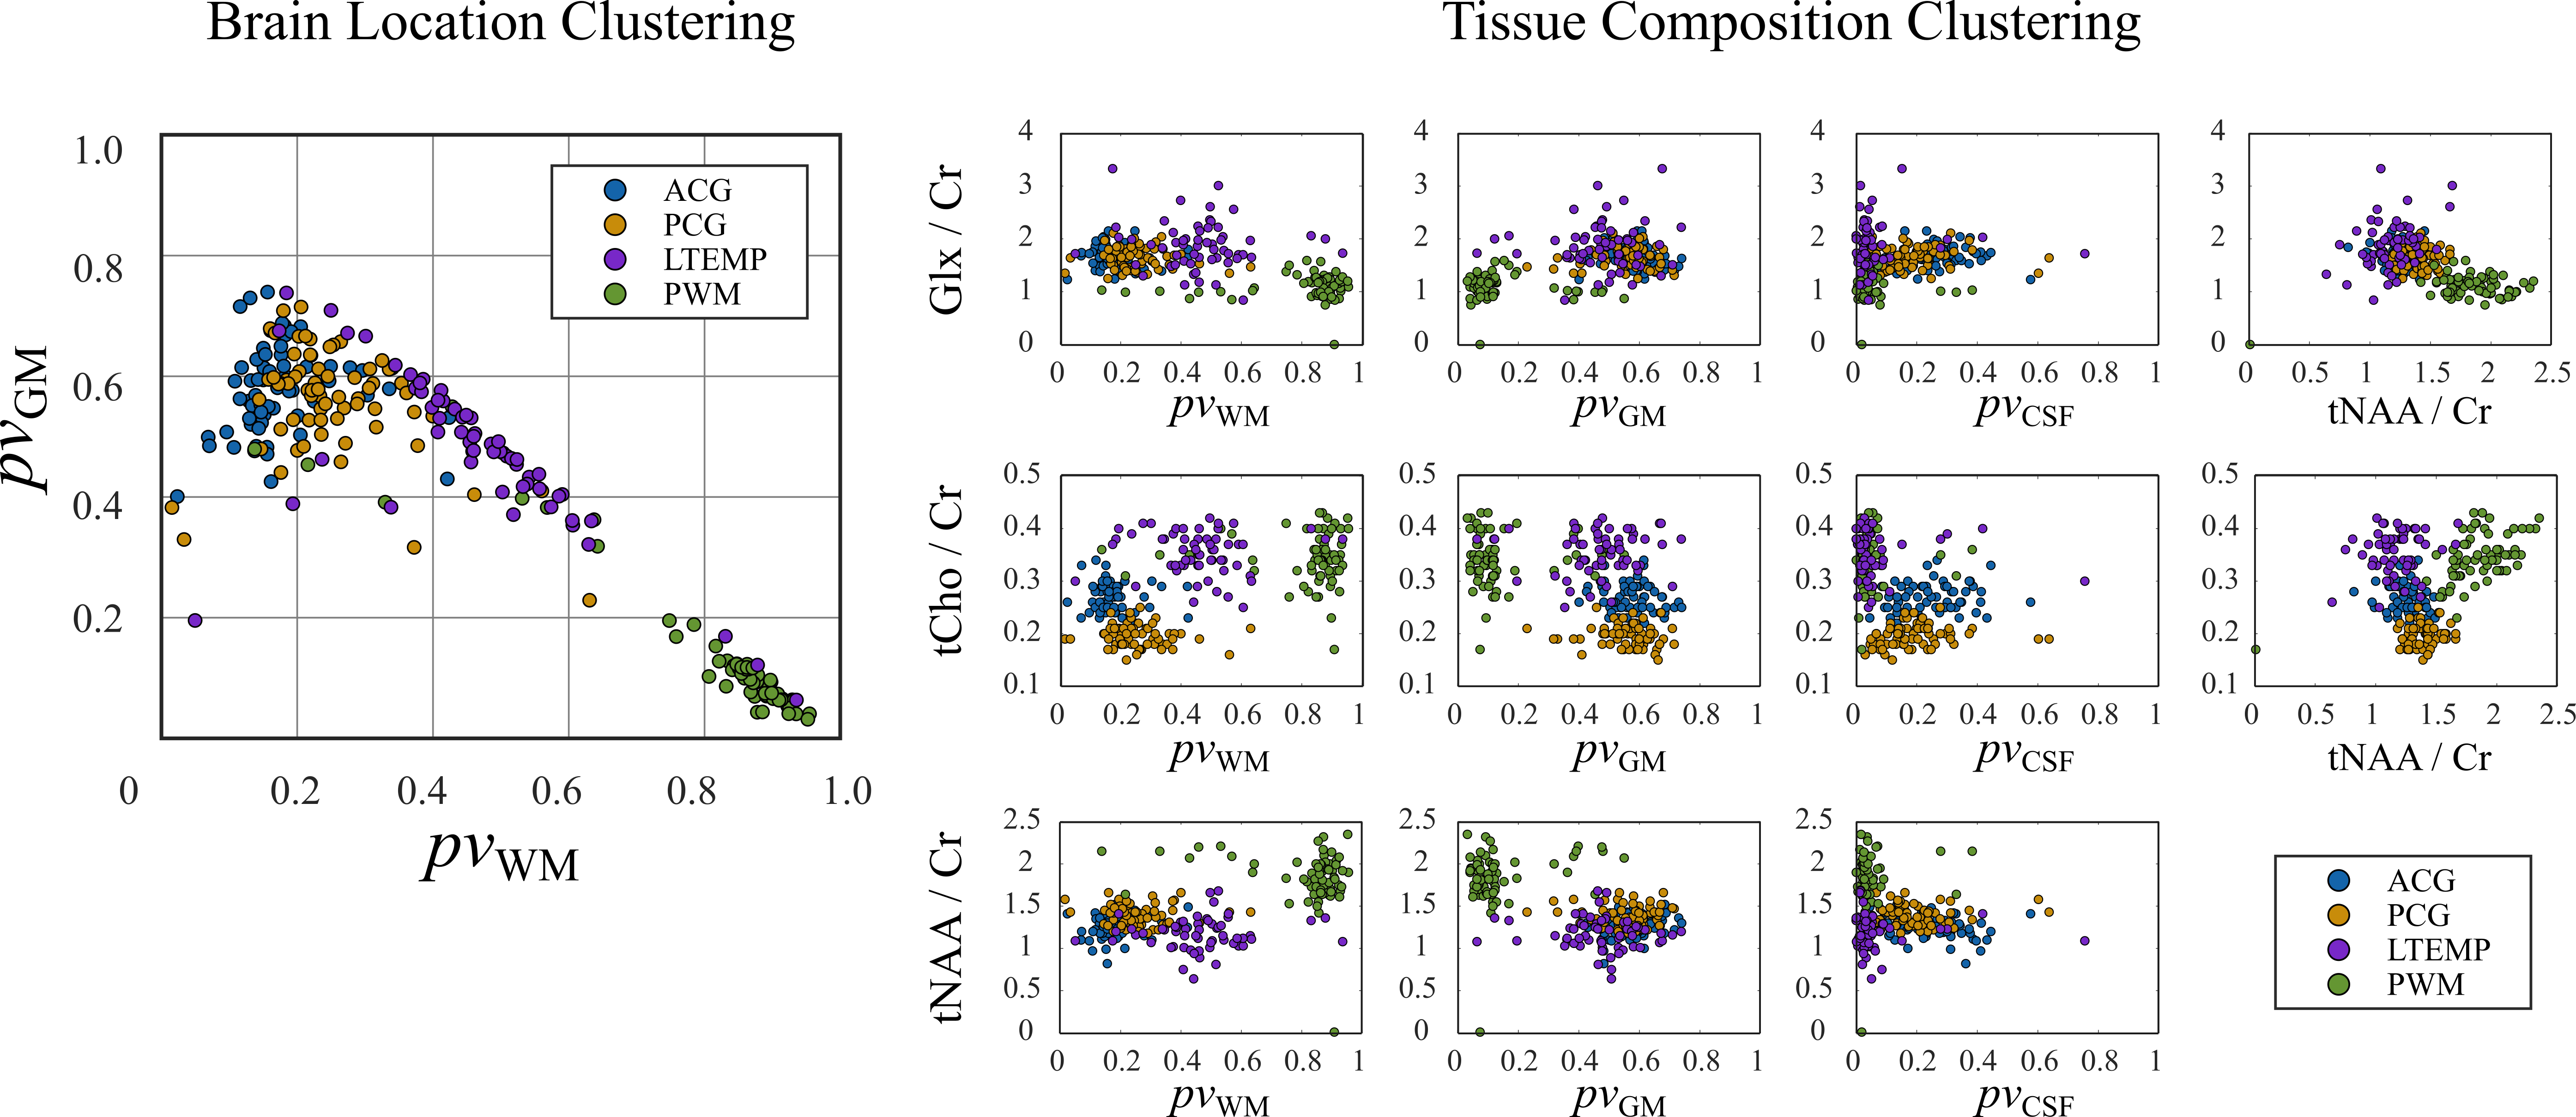
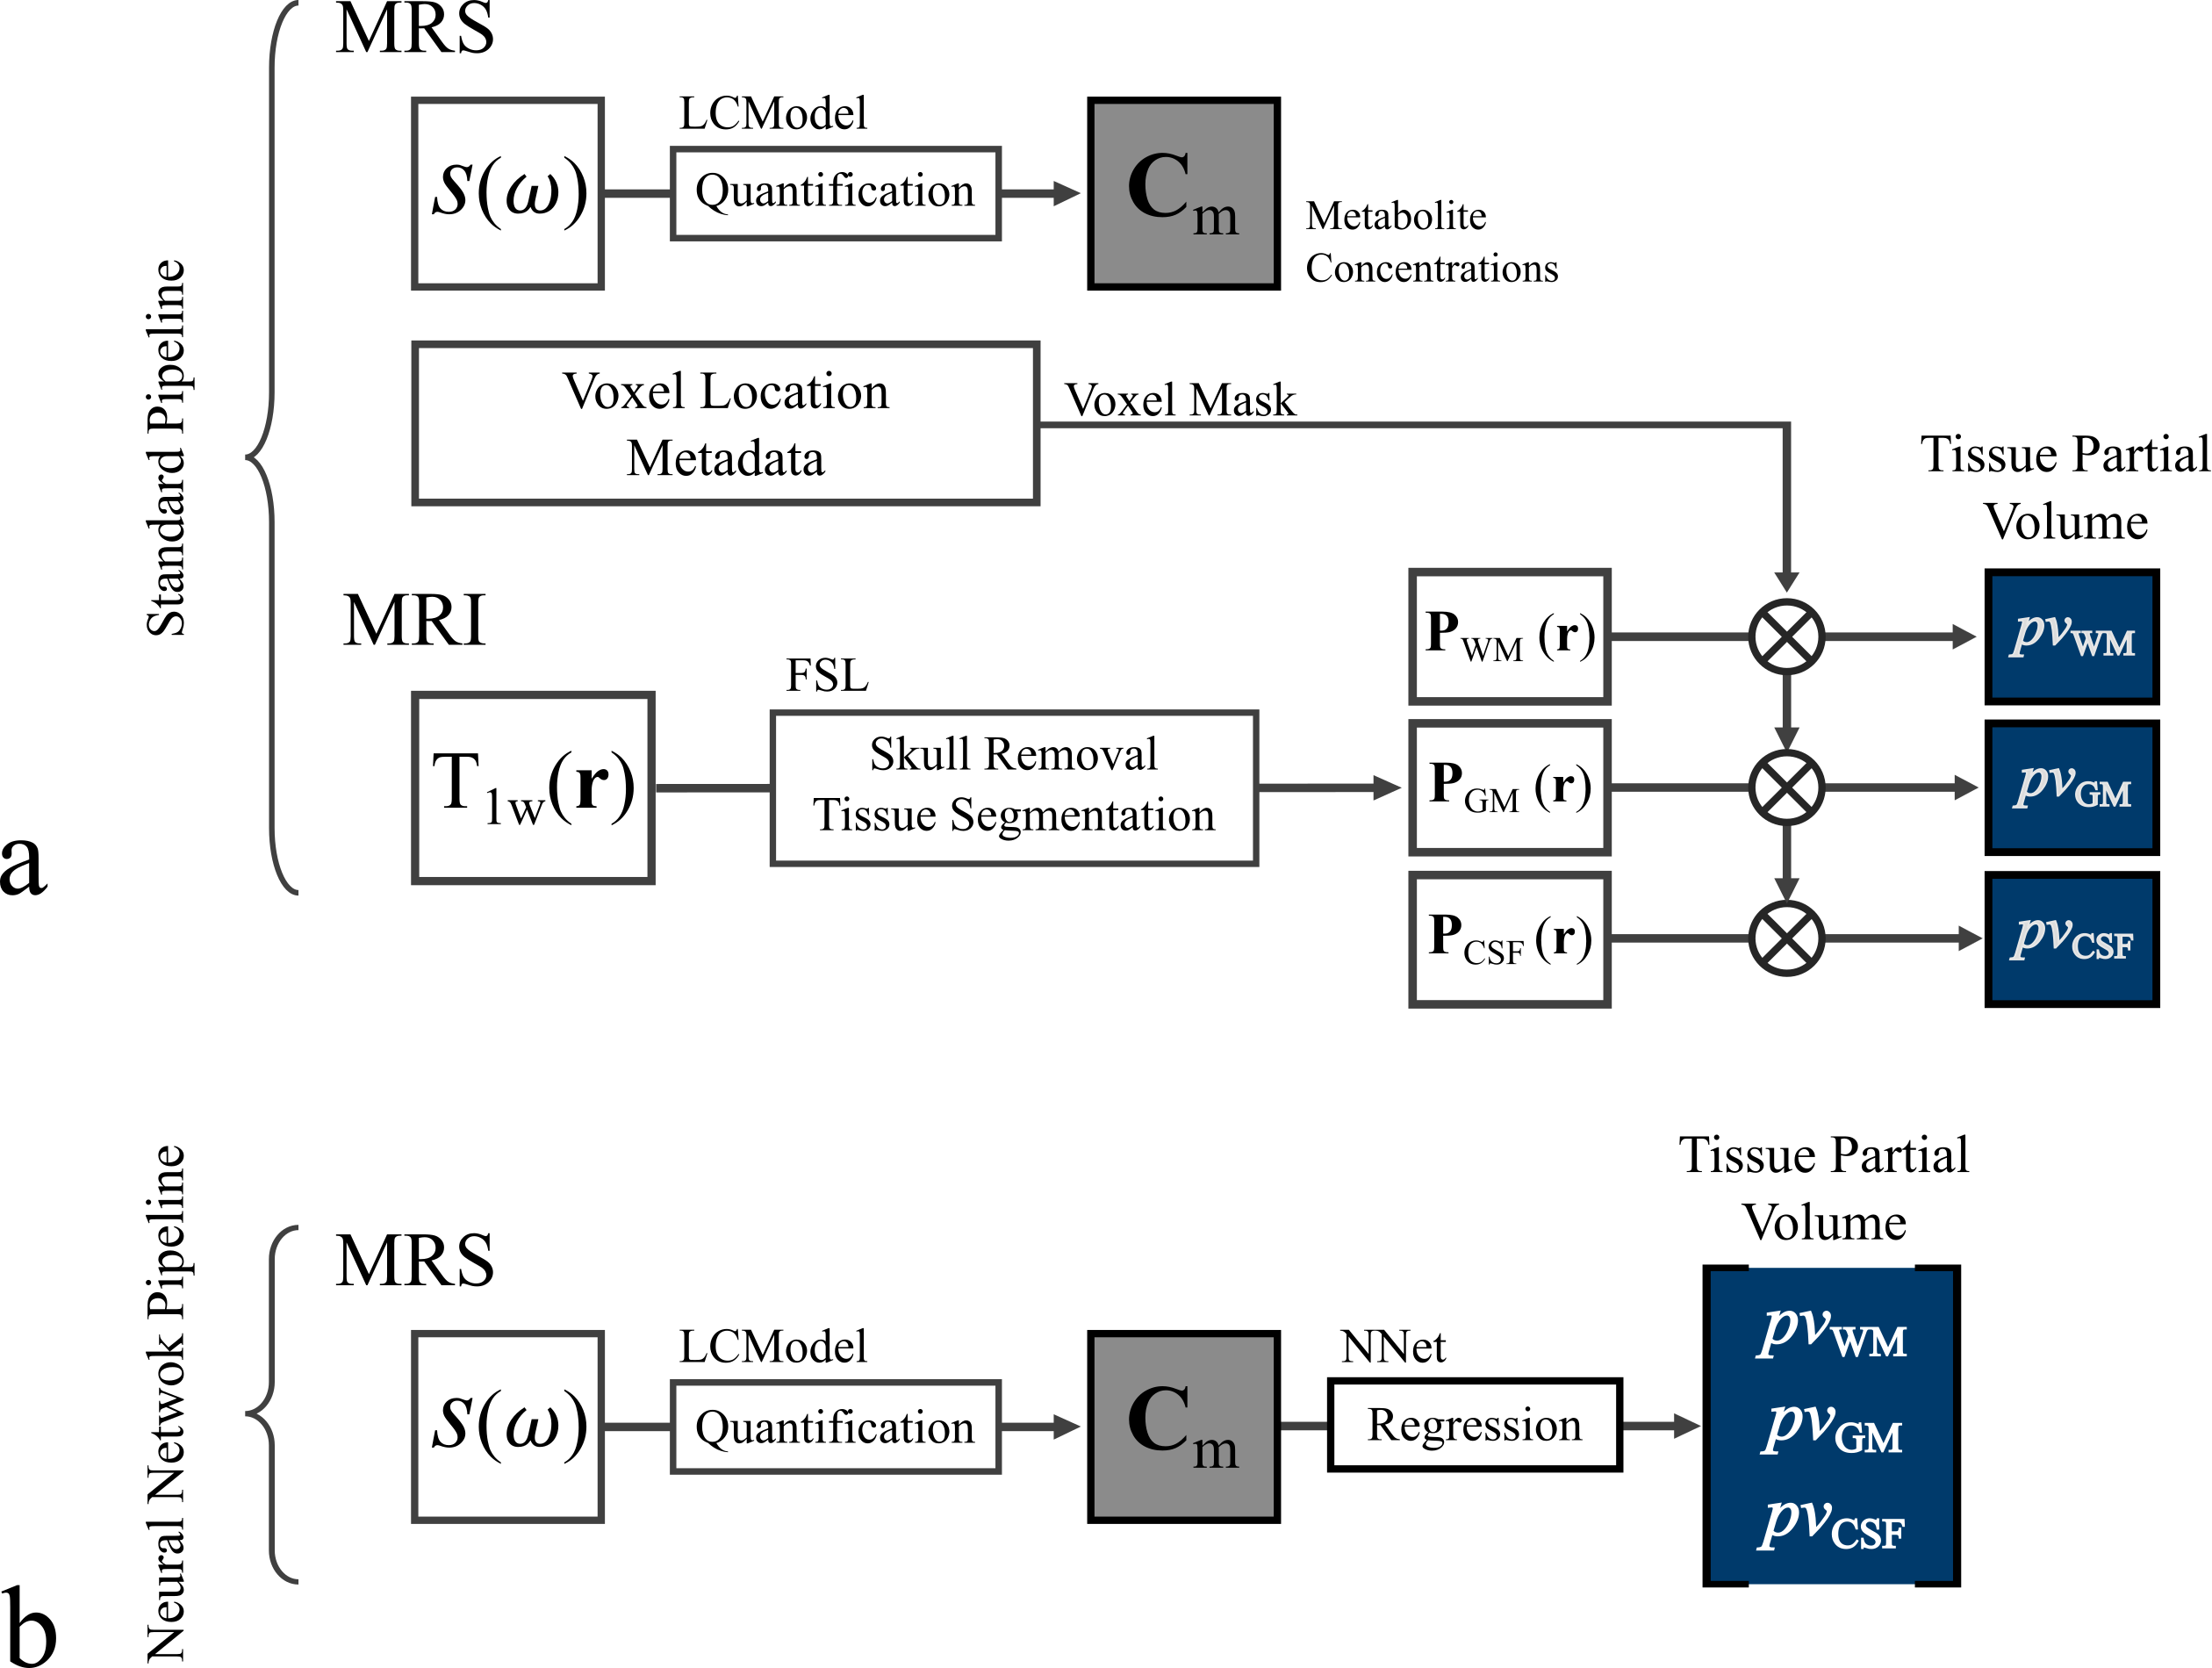
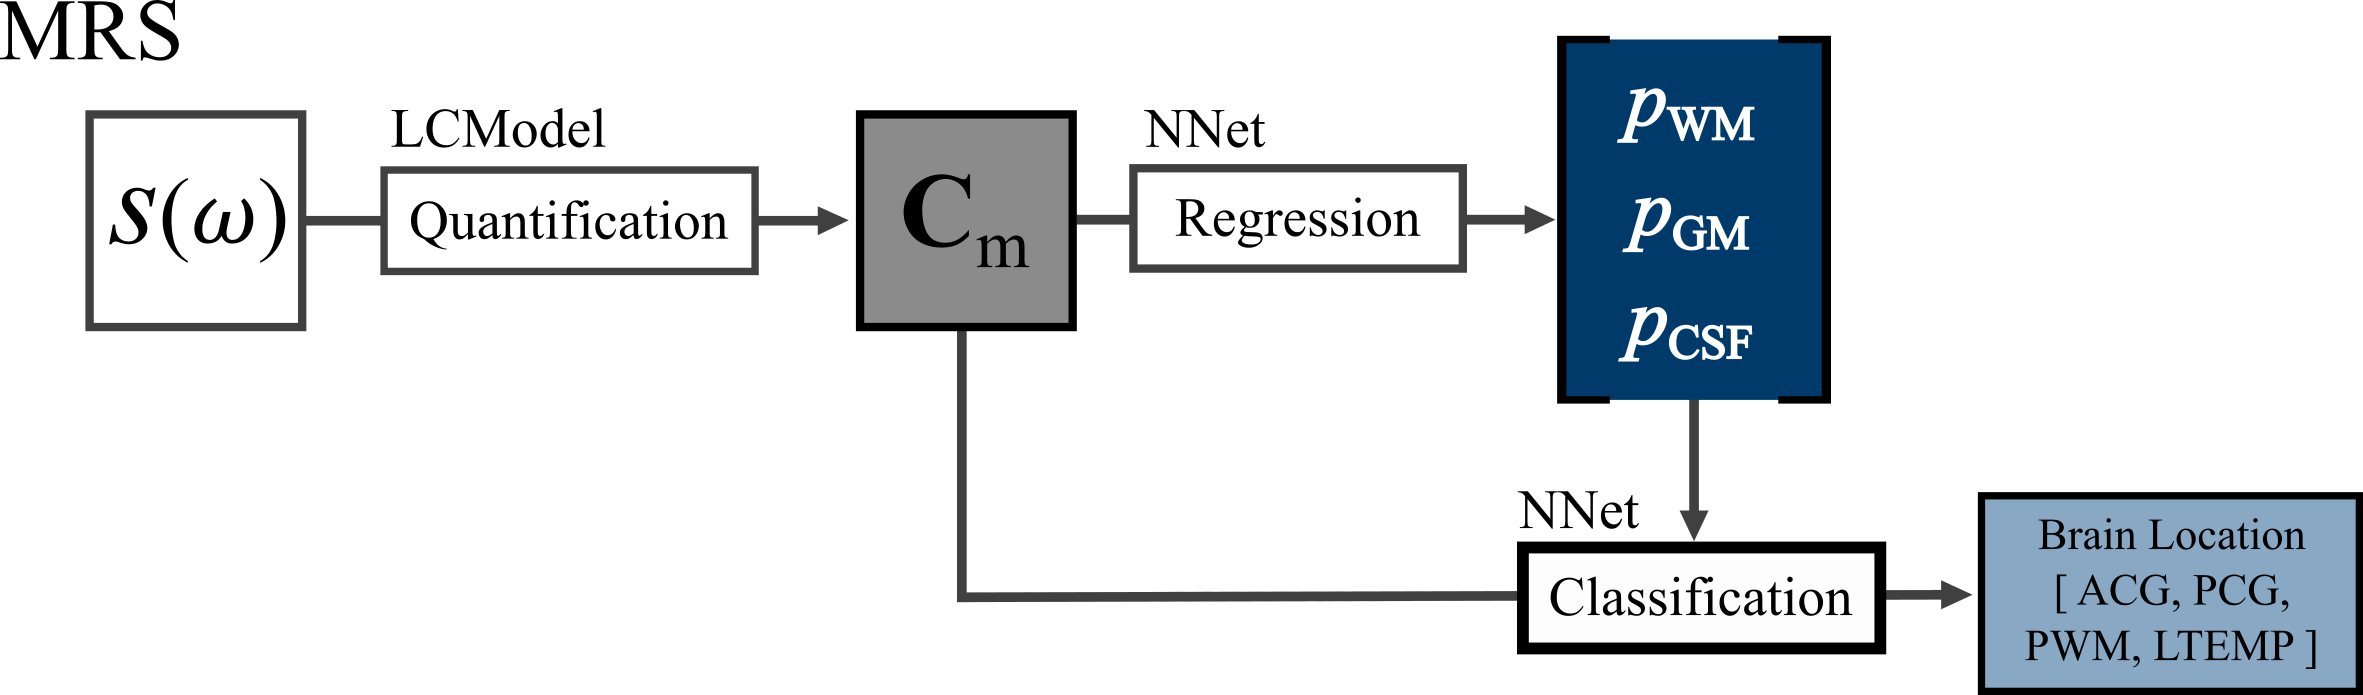
Proton MR Spectroscopy (MRS) of the brain allows the measurement of the metabolic composition of tissue. In clinical MRS, a relatively large tissue volume is excited to achieve the required sensitivity (typically 6mL-10mL). This leads to tissue heterogeneity within the voxel, and consequently, the measured signal contains contributions from the different tissue types in the brain, namely, gray matter (GM), white matter (WM), and cerebrospinal fluid (CSF). To obtain a reliable metabolite quantification and perform an accurate diagnosis, information about tissue composition and brain location is desired to correct for anatomical differences, partial volume effects, and voxel placement variability1,2. Yet, the procedure to obtain this tissue information (described in Fig-2a) is time consuming and difficult to incorporate in a clinical context as it relies on the acquisition of a T1-weighted (T1w) MR volume, specialized segmentation software (e.g. FSL5), and raw data containing the position and orientation of the MRS volume. Common brain locations used in clinical MRS are the posterior cingulate gyrus (PCG), parietal white matter (PWM), anterior cingulate gyrus (ACG), and left temporal lobe (LTEMP)6. This work describes a machine learning methodology to estimate the partial volume of tissues that contribute to the MRS signal using the concentration values obtained from the spectral quantification. Moreover, a classification method is introduced to determine the brain location of the acquired signal using the metabolic and tissue heterogeneity information.Methods
The partial volumes of GM, WM, and CSF ($$$pv_{GM}$$$, $$$pv_{WM}$$$ and $$$pv_{CSF}$$$) were determined from the quantified metabolite concentrations (Cm) of a given spectrum using a regression model based on the fact that different tissue types have characteristic metabolic compositions (Fig-1). In a similar way, the brain region corresponding to a given spectrum could be determined by classification models assuming that different brain regions have a specific metabolic signature and anatomical structure. Fig-2a shows the standard procedure to determine the tissue partial volumes from T1w volumes and the MRS voxel location using segmentation algorithms. Fig-2b shows the proposed pipeline that estimates the tissue partial volumes from the quantified metabolite concentrations.
Data collection: This study presents a meta-analysis of 745 spectra from 272 subjects measured at 4 different brain locations (PCG=198, PWM=200, ACG=180, LTEMP=167). The scans were performed at 3T (Trio, Verio, and Skyra; Siemens, Erlangen, Germany) using PRESS localization and the following parameters: TR/TE=2000/30ms, voxel size=20x20x20mm3, number of averages=128. The voxel location and orientation were extracted from the header file of the acquisitions. T1w volumes of all the subjects were collected using MPRAGE at 1mm isotropic resolution.
Data preprocessing: MRS and MRI datasets were processed following the pipeline in Fig-2a. The MRS datasets were reconstructed with a python pipeline using OpenMRSLab3 and quantified with LCModel4. Metabolite ratios were used to account for scanner and subject variabilities. T1w DICOM images were converted to NIFTI format and processed with FSL5.
Tissue composition regression: The neural network regression model was trained in Matlab (MathWorks) using creatine ratios of 18 metabolites and 9 macromolecular and lipid components as features. 70% of the datasets for were used for training, 15% for testing, and 15% for validation. The network consisted of 20 hidden layers and 10-fold cross-validation was implemented to obtain the average performance of the network.
Brain location classification: The neural network classification model was trained in Matlab (MathWorks) using creatine ratios and the partial volumes of GM, WM and CSF. 80% of the spectra were used for training 10% for testing and 10% for validation. The network was implemented with 100 hidden layers and a 10-fold cross-validation.
Results and Discussion
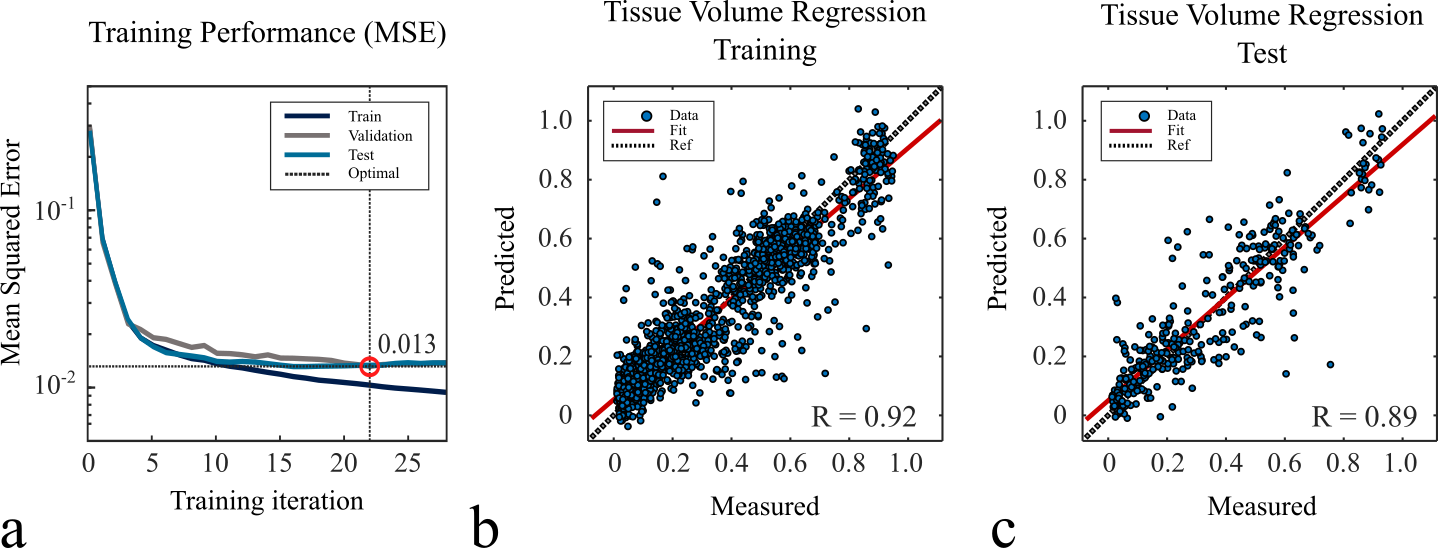
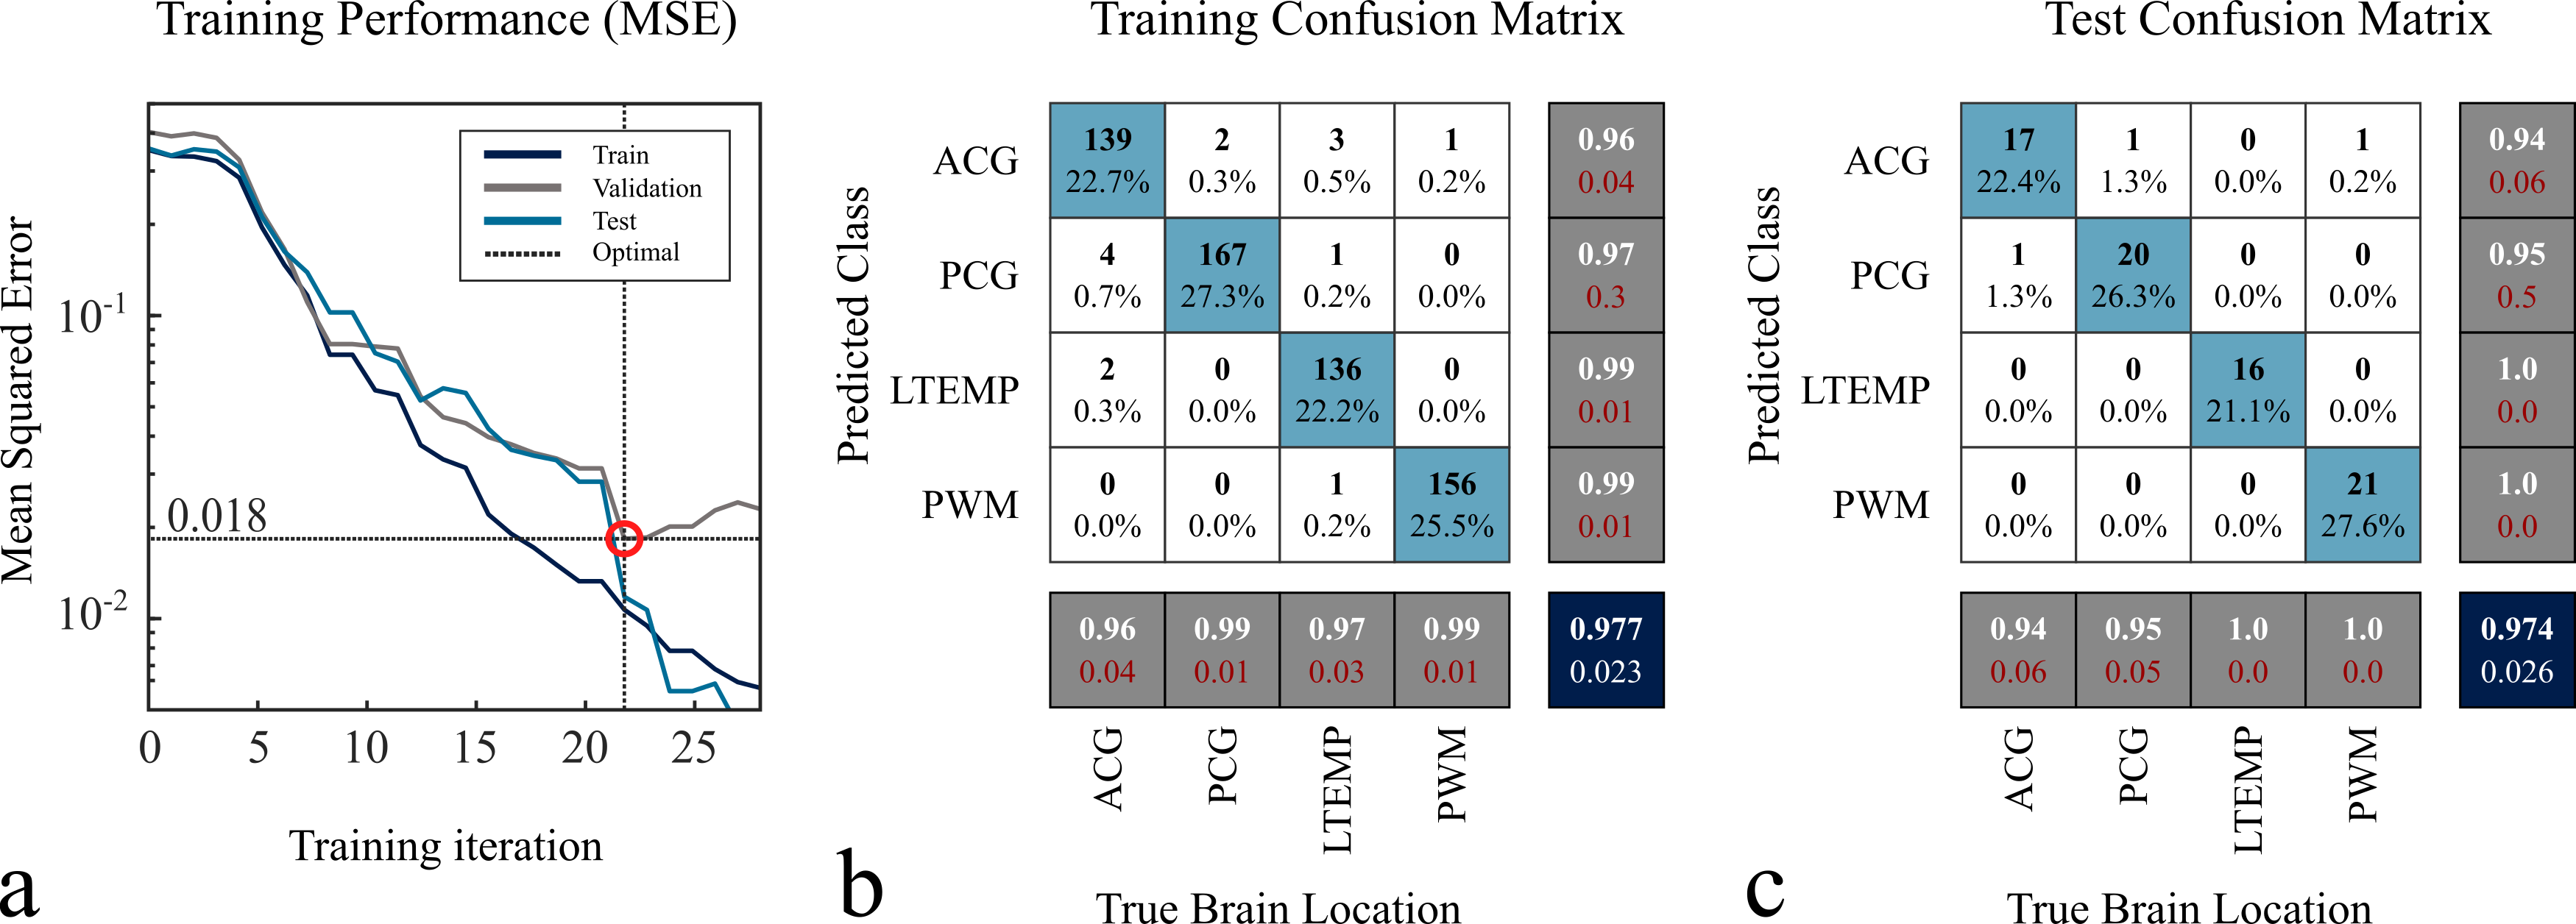
The training performance of the regression model for tissue volume estimation is shown in Fig-3. The optimal learning performance was obtained with an MSE=0.013, equivalent to the order of magnitude of the segmentation partial volume error. A correlation coefficient of R=0.89 was achieved between the known and the predicted tissue compositions in the test set (15%). Fig‑5 presents the results of the brain region classification. High classification accuracy (>0.94) for all regions was achieved. Metabolite ratios of total N-acetyl aspartate (tNAA), total choline (tCho), and glutamate+glutamine (Glx) to creatine (Cr) were strongly weighted by the regression model.Conclusion
This work presented a machine learning approach for the estimation of tissue partial volumes and brain location of MRS acquisitions. The proposed method represents an alternative to tissue segmentation algorithms, which are computationally expensive, require more input datasets and are prone to errors. Moreover, it allows for correction of tissue volumes in a compact pipeline facilitating its integration in a clinical context.Acknowledgements
No acknowledgement found.References
[1] Malucelli E, et al. Pitfalls and advantages of different strategies for the absolute quantification of N‐acetyl aspartate, creatine and choline in white and grey matter by 1H‐MRS. NMR in Biomedicine (2009).
[2] Zhang et al. Regional and tissue-specific differences in brain glutamate concentration measured by in vivo single voxel MRS. Journal of Neuroscience Methods, 239:94-99 (2015).
[3] Rowland B, et al. An open-source software repository for magnetic resonance spectroscopy data analysis tools. International Society for Magnetic Resonance in Medicine MR Spectroscopy Workshop (2016).
[4] Provencher, S. W. Automatic quantitation of localized in vivo 1H spectra with LCModel. NMR in Biomedicine 14, 260–264 (2001).
[5] M. Jenkinson et al. FSL. NeuroImage, 62:782-90 (2012).
[6] Lin AP et al. Guidelines for acquiring and reporting clinical neurospectroscopy. Semin Neurol. 32(4):432-53 (2012).
Figures