0514
Longitudinal Relaxation Times of Metabolites in vivo at 9.4 T1MRZ, Max Planck Institute for Biological Cybernetics, Tuebingen, Germany, 2IMPRS for Cognitive and Systems Neuroscience, Eberhard-Karls University of Tübingen, Tuebingen, Germany
Synopsis
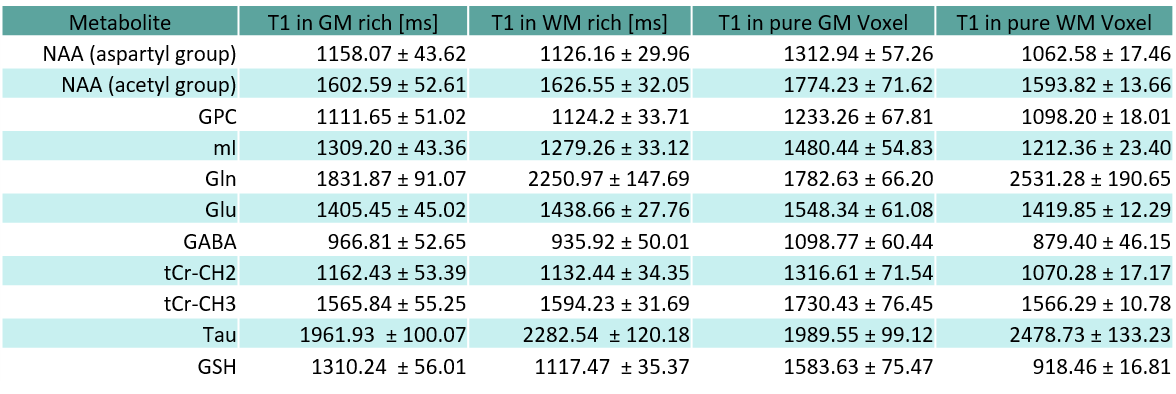
Longitudinal relaxation times for 11 human brain metabolites are reported for GM and WM rich voxels at 9.4T. These values are reported to potentiate the ability to perform absolute quantification at 9.4T in humans with reference to water. A bi-exponential model was used to fit the signal curve from using an inversion recovery metabolite cycling STEAM sequence. Results are further extrapolated to report the T1-relaxation from a theoretically pure WM and GM voxel by means of a linear assumption of the relaxation time and tissue contribution of a voxel.
Introduction
Characterization of the spin-lattice relaxation of metabolites at 9.4T has yet to be done for a majority of the in vivo metabolites of interest in humans1. These longitudinal times are required to do absolute quantification in reference to water; thus, relaxation times of 11 metabolites were measured in vivo at 9.4T using an inversion recovery metabolite cycling STEAM(IR-MC-STEAM) technique2.Methods
11 healthy volunteers (mean age = 26.9 ± 2.8 with 8 male and 3 female participants) were recruited to participate in this study with ERB approval and written consent from each volunteer. In order to determine the tissue content of grey matter(GM) rich and white matter(WM) rich voxels, a MP2RAGE sequence was used3 with an 8Tx/16Rx volume coil4, and segmented into GM, WM, and cerebral spinal fluid(CSF) tissue probability maps using SPM125 with tissue fractions within the voxel calculated by an in-house method.
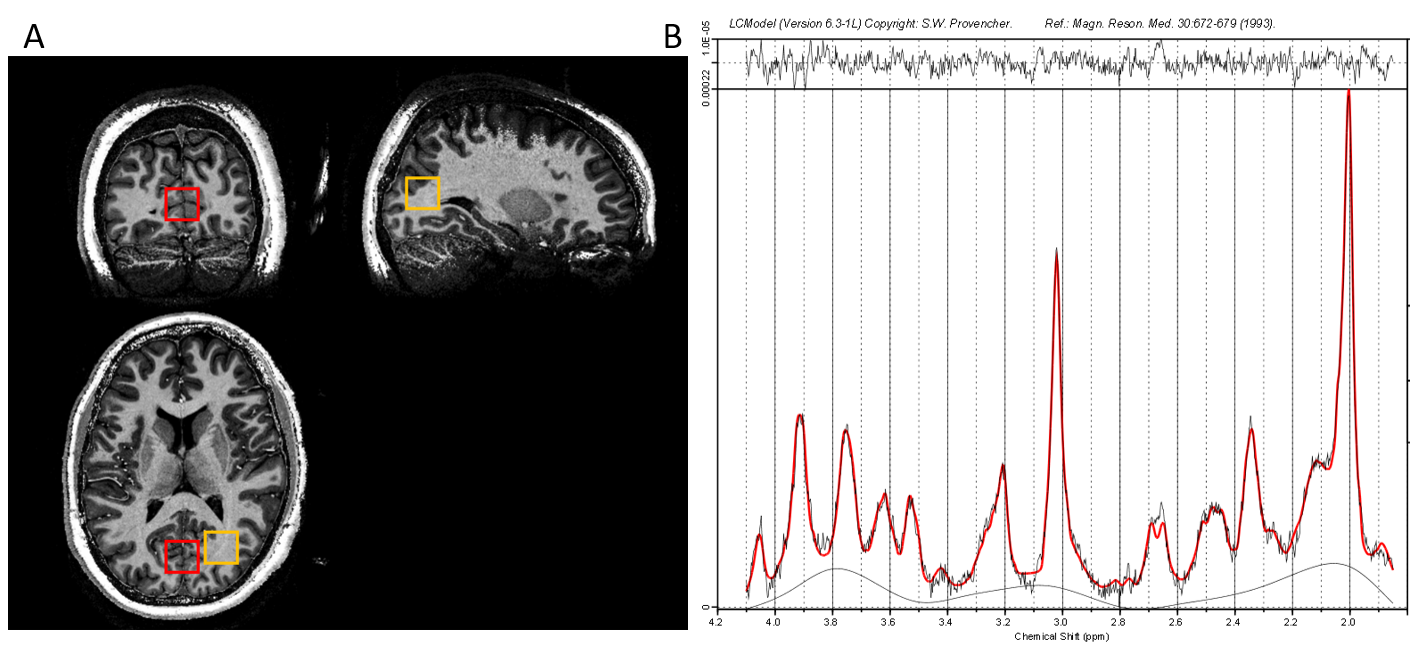
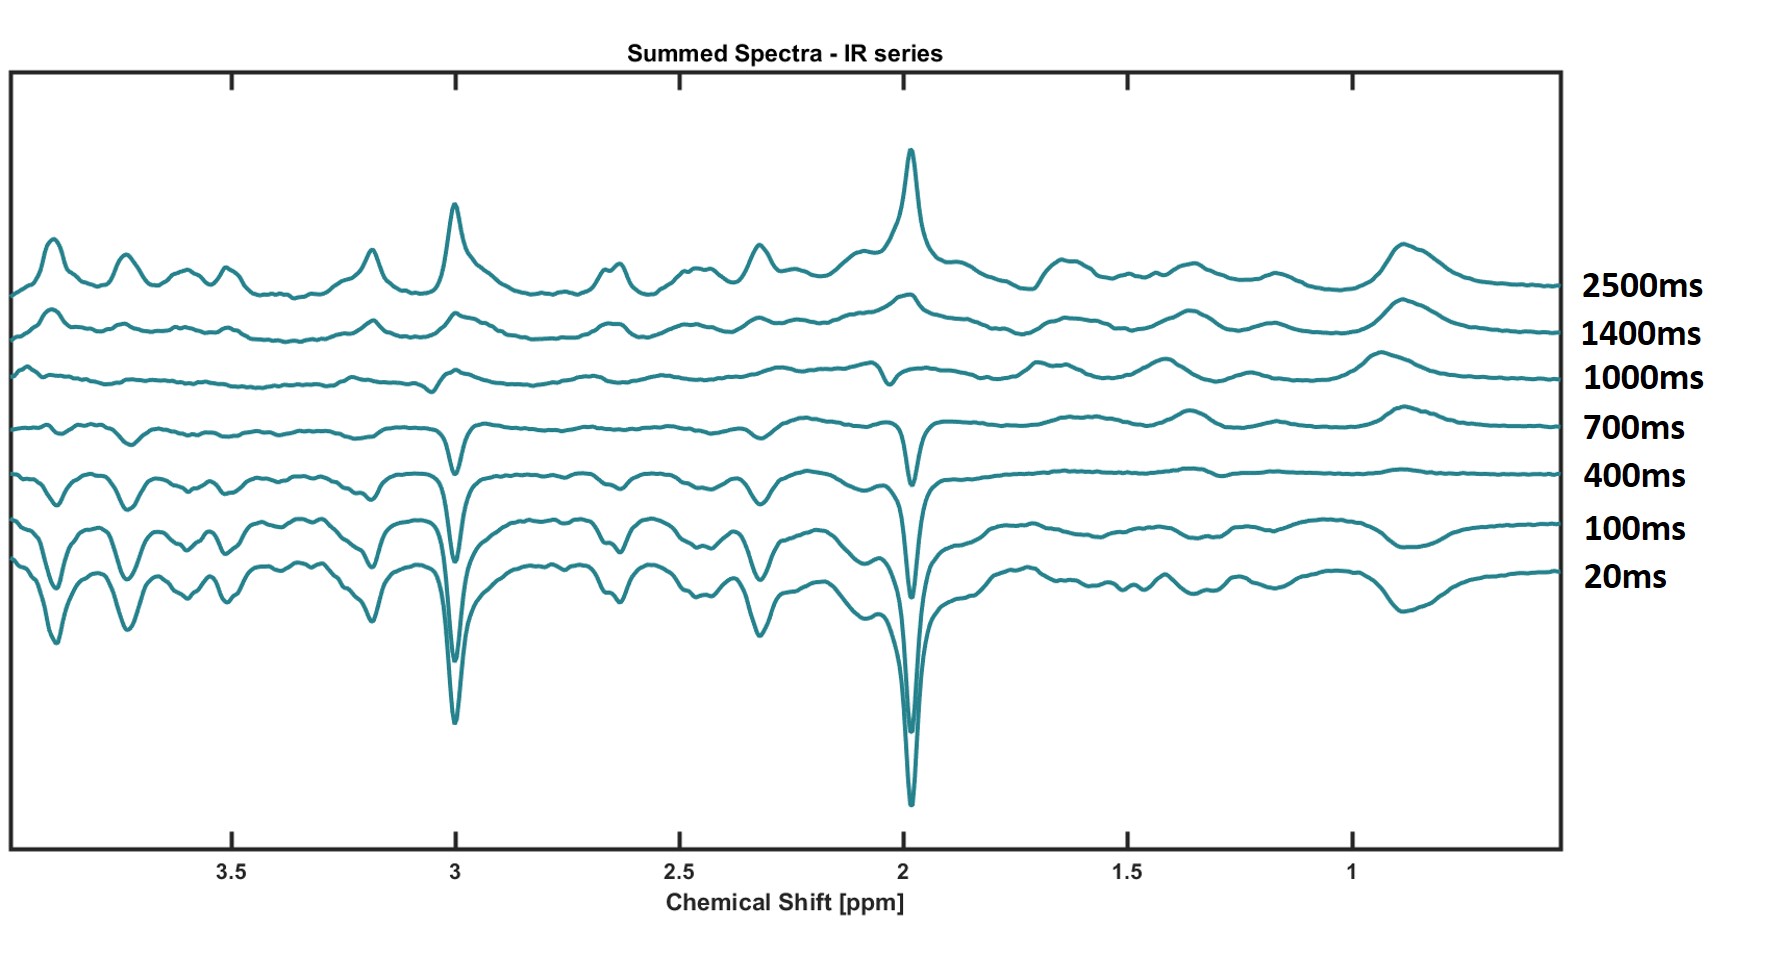
The same coil was used to acquire the spectroscopy data driven as a surface coil using the bottom three channels alone to transmit by utilizing a three-way power splitter2. A 2x2x2cm3 voxel was placed spanning the longitudinal fissure of the occipital lobe for GM measurements, and a voxel was placed within the right occipital-parietal transition for WM measurements [Fig. 1A]. T1-relaxation was measured using the aforementioned IR-MC-STEAM sequence with TE/TM/TR = 8/50/10000ms. A series of inversion times(TI = 20, 100, 400, 700, 1000, 1400, 2500ms) was chosen to characterize the T1-relaxation of a variety of metabolites (Fig. 2).
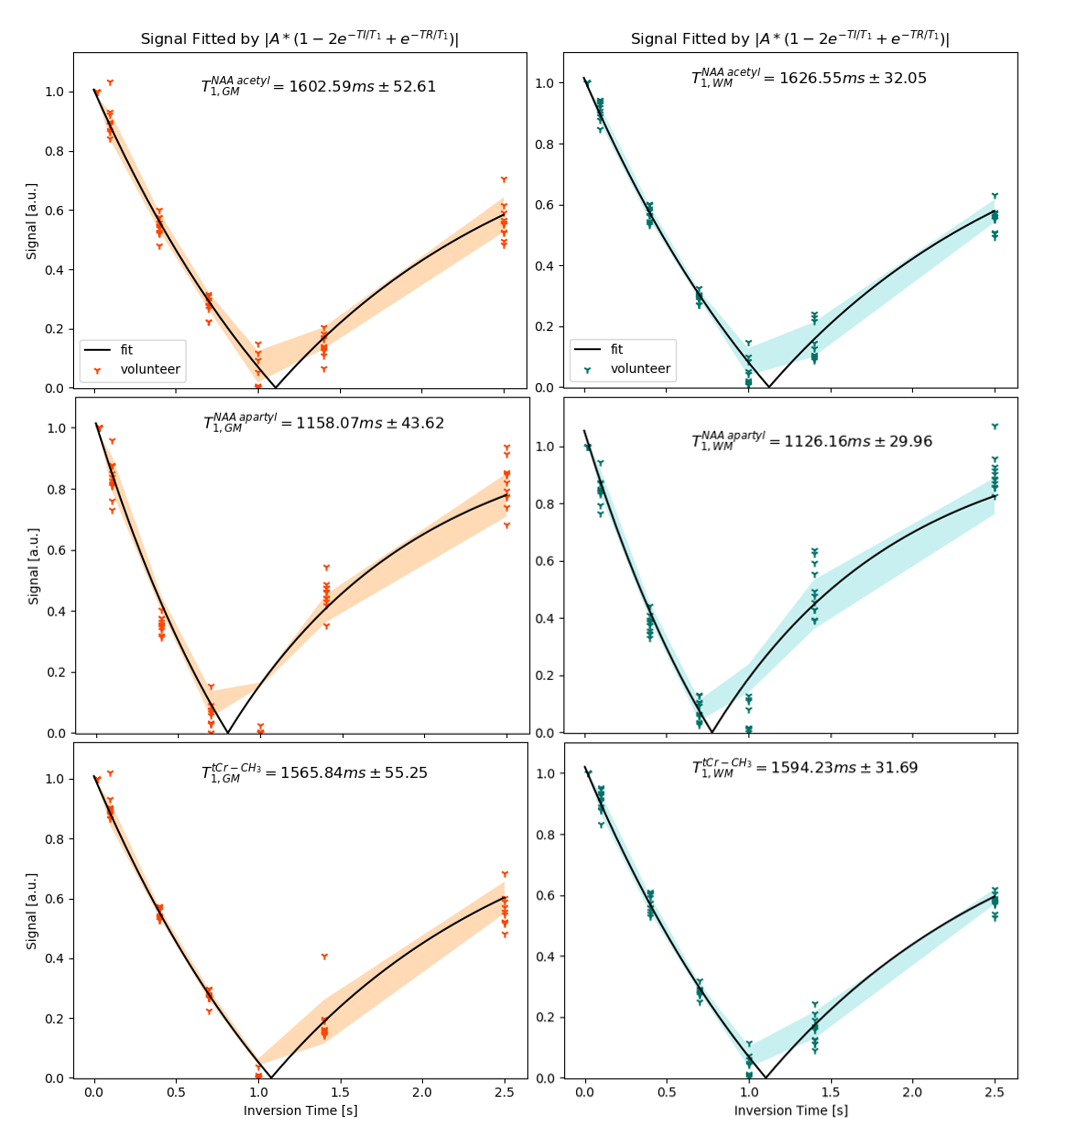
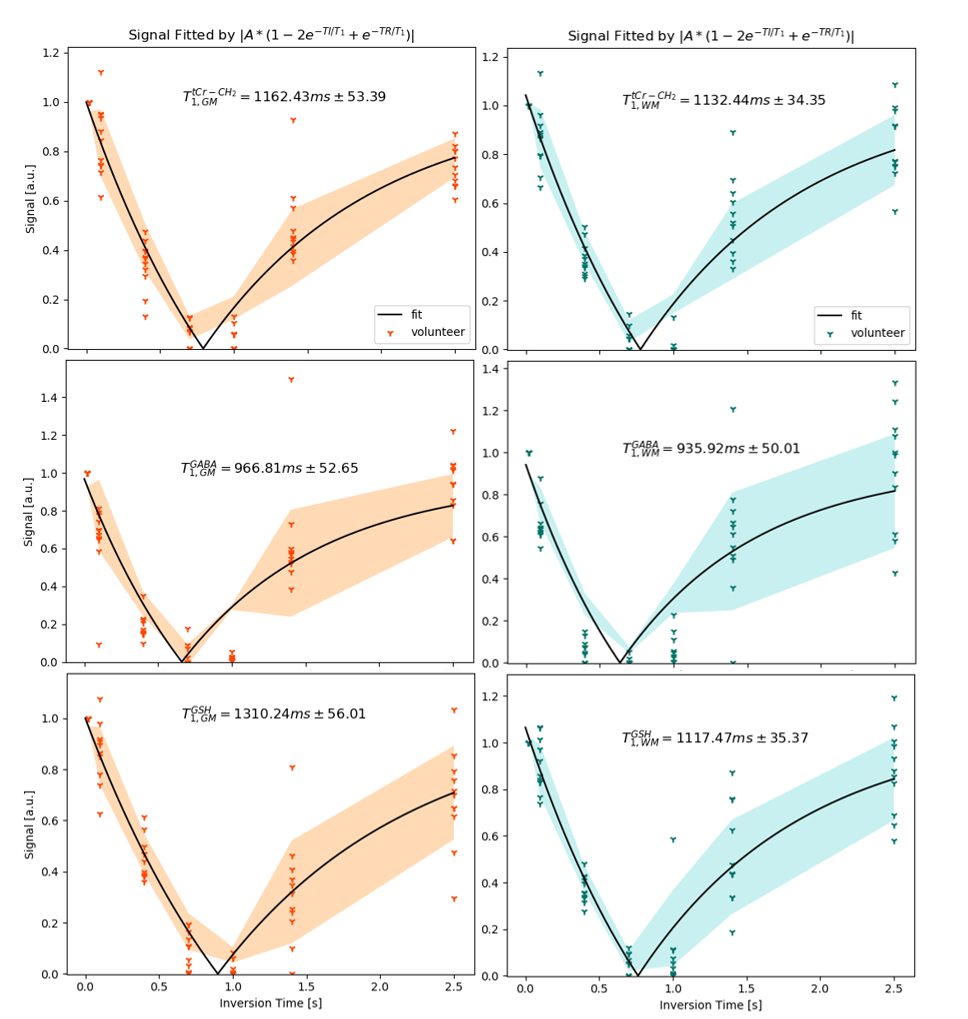
A basis set was simulated using VeSPA simulation tool6 using the ideal STEAM sequence matching our TM and TE. LCModel(v-6.3)7 was used to fit spectra(Fig.1B) with manual phase correction for TI = 1000 and 1400ms; the spline baseline was set to have medium flexibility to fit experimental imperfections and macromolecular components(dkntmn=0.5). The concentration of metabolites was taken after LCModel fitting and fit to a bi-exponential model:
$$ S = |A(1-2e^{\frac{-TI}{T_{1}}} + e^{\frac{-TR}{T_{1}}})|, \\ A\equiv \frac{\rho}{4kT\cdot R \cdot BW} $$
$$$S$$$ is the concentration, and $$$T_{1}$$$ is solved by a linear model curve fitting optimization, where $$$A$$$ is a constant with $$$ \rho $$$ being the effective spin density, $$$ k $$$ the Boltzmann constant, $$$T$$$ the temperature, $$$R$$$ the effective resistance of the loaded coil, and $$$BW$$$ is the bandwidth of the receiver, using the SciPy toolkit8 in Python(v2.7)9 and figures were created using the matplotlib library10.
Since T1-relaxation has been shown to vary due to tissue type and not spatially like T2-relaxation3, an assumption to further estimate the relaxation of pure WM and GM voxels was performed. Assuming a linear relationship in relaxation time to the contribution of tissue type two linear equations of the following form were solved:
$$f_{GM}\cdot T^{pure\,voxel}_{1, GM}+f_{WM}\cdot T^{pure\,voxel}_{1,WM}=T^{rich\,voxel}_{1,GM} \\f'_{GM}\cdot T^{pure\,voxel}_{1,GM}+f'_{WM}\cdot T^{pure\,voxel}_{1,WM}=T^{rich\,voxel}_{1,WM}$$
where $$$f$$$ represents the tissue fraction in measures from GM-rich voxels and $$$f’$$$ represents the tissue fraction in measures from WM-rich voxels.
Results
Fig.3&4 show the fitting of metabolites to the model with the solid line representing the fit to the model. Results of the relaxation times from 11 metabolites are reported in Table 1. The average content of GM voxels was GM/WM/CSF=68.91/23.84/6.52% and the average content in WM voxels was GM/WM/CSF=32.10/66.16/1.56%. The T1-relaxation of a theoretically pure GM and WM voxel can be found in Table 1.Discussion
A short TE was utilized in order to maintain signal from fast T2-decaying metabolites and J-evolving components of metabolites. Thus, 11 metabolites are reported with a majority showing stable results. A challenge with a short TE is the influence of MMs underlying metabolites; which potentially affects the quality of fit in LCModel of the metabolites.
T1-relaxations of a pure GM voxel measured herein are in agreement with previous work of Deelchand et al1; who measured the T1-relaxation to be 1777ms and 1746ms for the NAA singlet and CH3-tCr group respectively in a GM rich voxel. The slight disagreement between the T1-relaxation times of tCho of 1513ms as measured previously1 and GPC of 1233ms as measured herein is potentially due to the MM contribution in the spectra from this work. A similar effect could be affecting the Gln relaxation time. Future work will utilize a tailored MM baseline model for correction of these signals to better report metabolite T1-relaxation times of a wide range of brain metabolites.
Conclusion
The longitudinal relaxation times of 11 human brain metabolites are reported for GM and WM at 9.4T. Our results add to previous work in reporting in vivo T1-relaxation of metabolites at 9.4T1 .By characterization of more T1-relaxation times, it will be possible to absolutely quantify metabolite concentrations in vivo with respect to water, and potentiates pathology characterization with SVS and high-resolution MRSI in the future.Acknowledgements
Funding by the European Union (ERC Starting Grant, SYNAPLAST MR, Grant Number: 679927 and Horizon 2020 Health call project grant, CDS-QUAMRI, Grant Number: 634541) is gratefully acknowledged. Special thanks also go to Sahar Nassirpour, Paul Chang, Wolfgang Bogner, Jim Murdoch, and Theresia Ziegs for helpful conversations and other support throughout this work.References
1. Deelchand DK, Van de Moortele PF, Adriany G, Iltis I, Andersen P, Strupp JP, Vaughan JT, Uğurbil K, Henry PG. In vivo 1H NMR spectroscopy of the human brain at 9.4 T: initial results. Journal of Magnetic Resonance. 2010 Sep 1;206(1):74-80.
2. Giapitzakis IA, Shao T, Avdievich NI, Mekle R, Kreis R and Henning A (April-2018) Metabolite-cycled STEAM and semi-LASER localization for MR spectroscopy of the human brain at 9.4T Magnetic Resonance in Medicine 79(4) 1841-1850.
3. Hagberg GE, Bause J, Ethofer T, Ehses P, Dresler T, Herbert C, Pohmann R, Shajan G, Fallgatter A, Pavlova MA, Scheffler K. Whole brain MP2RAGE-based mapping of the longitudinal relaxation time at 9.4 T. Neuroimage. 2017 Jan 1;144:203-16.
4. Avdievich N, Giapitzakis I and Henning A (April-25-2017): Optimization of the Receive Performance of a Tight-Fit Transceiver Phased Array for Human Brain Imaging at 9.4T, 25th Annual Meeting and Exhibition of the International Society for Magnetic Resonance in Medicine (ISMRM 2017), Honolulu, HI, USA.
5. Ashburner J, Barnes G, Chen C, Daunizeau J, Flandin G, Friston K, Kiebel S, Kilner J, Litvak V, Moran R, Penny W. SPM12 manual. Wellcome Trust Centre for Neuroimaging, London, UK. 2014 Jun 26.
6. Soher BJ, Semanchuk P, Todd D, Steinberg J, Young K. VeSPA: integrated applications for RF pulse design, spectral simulation and MRS data analysis. InProc Int Soc Magn Reson Med 2011 (Vol. 19, p. 1410).
7. Provencher SW. Estimation of metabolite concentrations from localized in vivo proton NMR spectra. Magnetic resonance in medicine. 1993 Dec;30(6):672-9.
8. Jones E, Oliphant E, Peterson P, et al. SciPy: Open Source Scientific Tools for Python, 2001-, https://www.scipy.org.
9. G. van Rossum, Python Tutorial, Technical Report CS-R9526, Centrum voor Wiskunde en Informatixa (CWI), Amsterdam, May 1995.
10. John D. Hunter. Matplotlib: A 2D Graphics Environment, Comuting in Science & Engineering, 9, 90-95 (2007), DOI:10.1109/MCSE.2007.53
Figures