0512
Effects of Carrier Frequency Mismatch on Frequency-Selective Spectral Editing1National Institute of Mental Health, National Institutes of Health, Bethesda, MD, United States
Synopsis
This study investigated the effects of carrier frequency mismatch on spectral editing and its correction by frequency matching of basis functions. Full density matrix computations and Monte Carlo simulations based on MRS data collected from five healthy volunteers at 7 T were used to analyze the effects of carrier frequency mismatch on spectral editing. There were significant errors in metabolite quantification without frequency matching of basis functions when carrier frequency mismatch was generally considered negligible. By matching basis functions with the history of frequency deviation, errors in glutamate, glutamine, g-aminobutyric acid, and glutathione concentrations were significantly reduced.
INTRODUCTION
Most spectral editing techniques use very selective pulses for spectral editing to minimize contamination from co-edited signals. An unstated assumption has been that if frequency deviation is much smaller than the bandwidth of the editing pulse one should not expect significant effects of frequency deviation on metabolite quantification. In this work, we evaluate the effects of frequency deviations on spectral editing using editing pulses with high frequency selectivity.
METHODS
A previously proposed spectral editing MRS pulse sequence was used in this study (1). A simplified version of the pulse sequence (Figure 1) was used in the density matrix simulation to improve computation speed without affecting the accuracy of the computed basis functions. Basis functions of 16 metabolites were simulated for fitting in vivo spectra in the range of 1.8 – 3.7 ppm. For each metabolite, 31 sets of basis functions, with each set corresponding to one frequency shift value, were computed.In vivo MRS data were acquired at 7 T from a 2 × 2 × 2 mL voxel placed in the pregenual anterior cingulate cortex (pgACC) of five subjects. Each dataset comprised a total of 72 interleaved FIDs with 24 FIDs for each of the three editing steps. Frequency deviations in the individual spectra were determined by fitting two Voigt curves to the creatine and choline peaks. The frequency and phase aligned individual spectra were separately averaged into three spectra corresponding to the three editing steps. A histogram of the frequency deviations, which was a distribution of the frequency deviations at 1 Hz intervals, was generated for each of the three editing steps. The basis spectra used in the subsequent fitting process were computed as the average of the basis spectra corresponding to 31 frequency deviation values, where the experimentally measured histogram was used as the weighting function (2). The three averaged in vivo spectra were fitted to obtain the concentrations, linewidths, and lineshape of the metabolites, as well as the noise level and a cubic spline baseline with 17 control points between 1.8 – 3.7 ppm for each spectrum. Based on these values and the frequency deviation history, 72 individual FIDs were simulated by summing the properly scaled, line-broadened, and frequency-shifted basis functions and then adding random noise to the sum. The simulated FIDs did not contain baseline signals. The 72 simulated individual FIDs were processed the same way as the in vivo FIDs to generate three averaged spectra. These three simulated spectra were fitted simultaneously using two different sets of basis functions: basis functions with and without frequency matching. This process of simulation followed by fitting the data was repeated 100 times using the two different sets of basis functions. Results obtained via the two different basis sets were compared with the input values of metabolite concentrations to compute relative errors.
RESULTS
Figure 2 displays the frequency deviation history as well as the reconstructed spectra and corresponding fits from one subject. Monte Carlo simulated spectra and the corresponding fits based on the in vivo data are displayed in Figure 3. Significant artifacts were observed in the fit residual signals without frequency matching (Fig. 3A) but no visible artifacts were observed in the fit residual signals with frequency matching (Fig. 3B). The corresponding metabolite concentration values obtained by fitting the simulated spectra using the basis functions with and without frequency matching are given in Table 1. The relative errors in the metabolite concentrations from all five subjects were given in Table 2. On average, the magnitude of frequency deviation during each scan was 2.4 ± 1.8 Hz, which is relatively small for clinical MRS scans. Using the set of basis functions without frequency matching, the mean relative errors in the quantified glutamate, glutamine, g-aminobutyric acid (GABA), and glutathione concentrations were 3.90%, 1.85%, 11.53%, and 3.43%, respectively. Using the set of frequency matched basis functions, the mean relative errors in the quantified glutamate, glutamine, GABA, and glutathione concentrations became significantly lower, which were 0.18%, 0.34%, 0.40%, and 0.51%, respectively.DISCUSSION AND CONCLUSION
Full density matrix computations and Monte Carlo simulations based on in vivo spectral editing MRS data collected at 7 T were used to analyze the effects of carrier frequency mismatch on spectral editing. We found significant differences in metabolite quantification results with and without frequency matching of basis functions when carrier frequency mismatch was generally considered negligible. Matching basis functions to frequency deviation history can significantly improve accuracy of metabolite quantification in spectral editing experiments.Acknowledgements
This work was supported by the intramural programs of the NIH and NIMH.References
An L, Araneta MF, Johnson C, Shen J. Simultaneous measurement of glutamate, glutamine, GABA, and glutathione by spectral editing without subtraction. Magn Reson Med 2018;80(5):1776-1786.
van der Veen JW, Marenco S, Berman KF, Shen J (2017) Retrospective correction of frequency drift in spectral editing: The GABA editing example. Nmr in Biomedicine 30 (8).
Figures
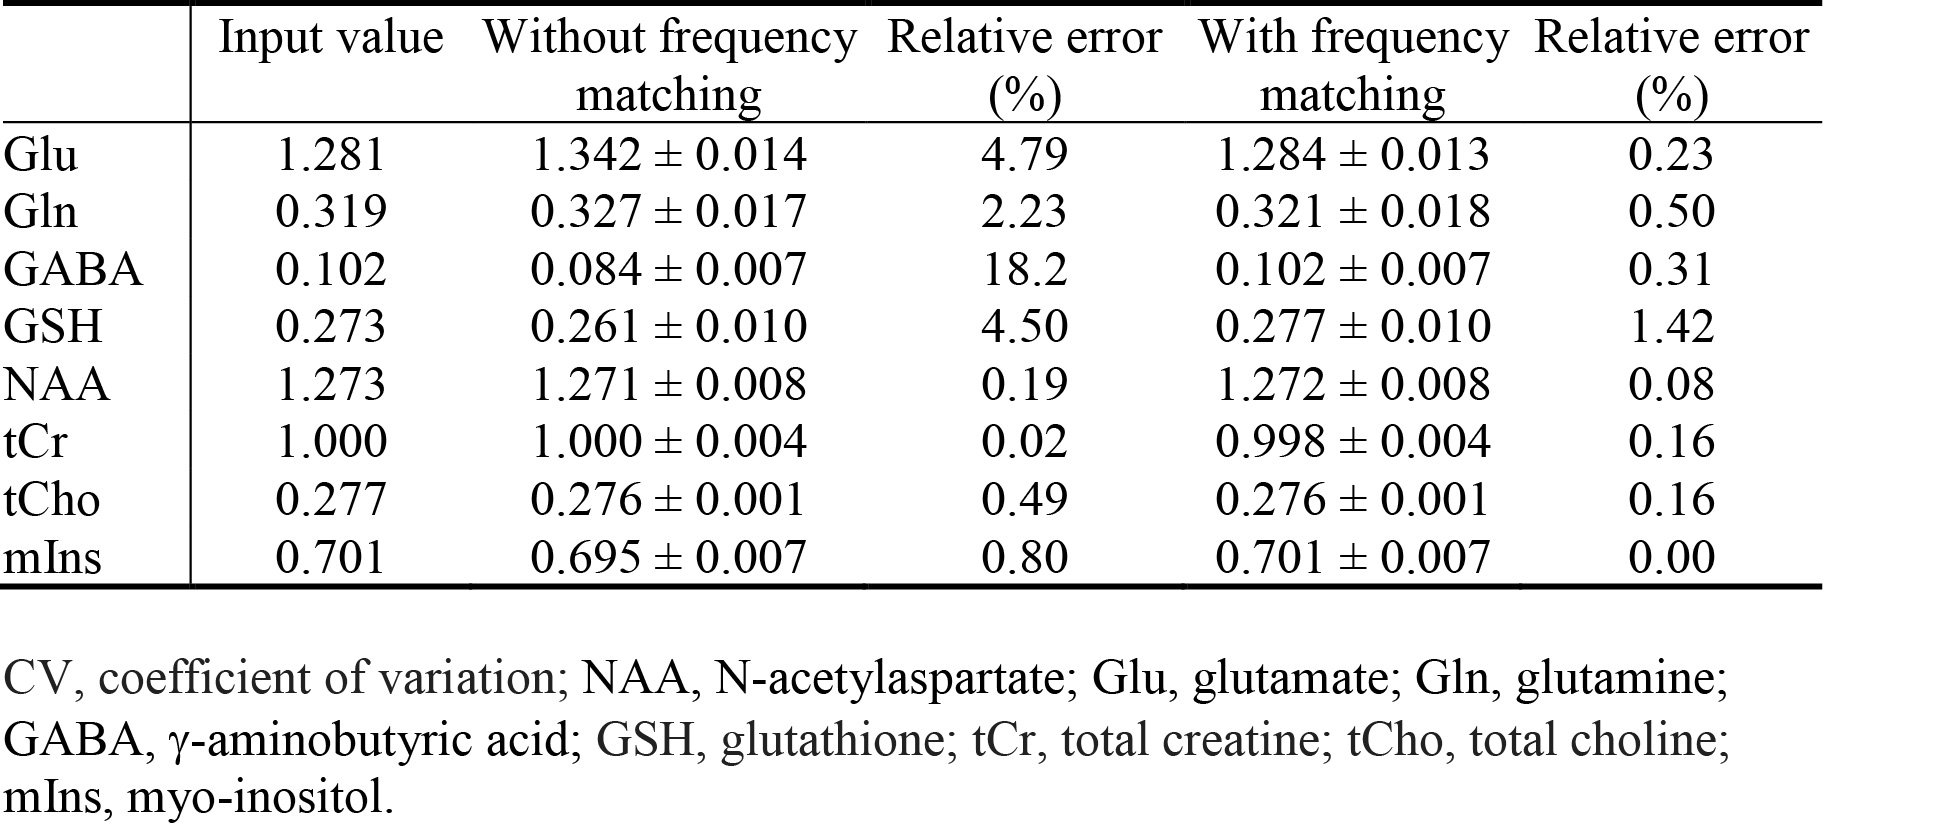
Table 1. Metabolite concentration by Monte Carlo analysis of an in vivo dataset (Figure 2). Two different sets of basis functions—with and without frequency matching—were used in the fitting.
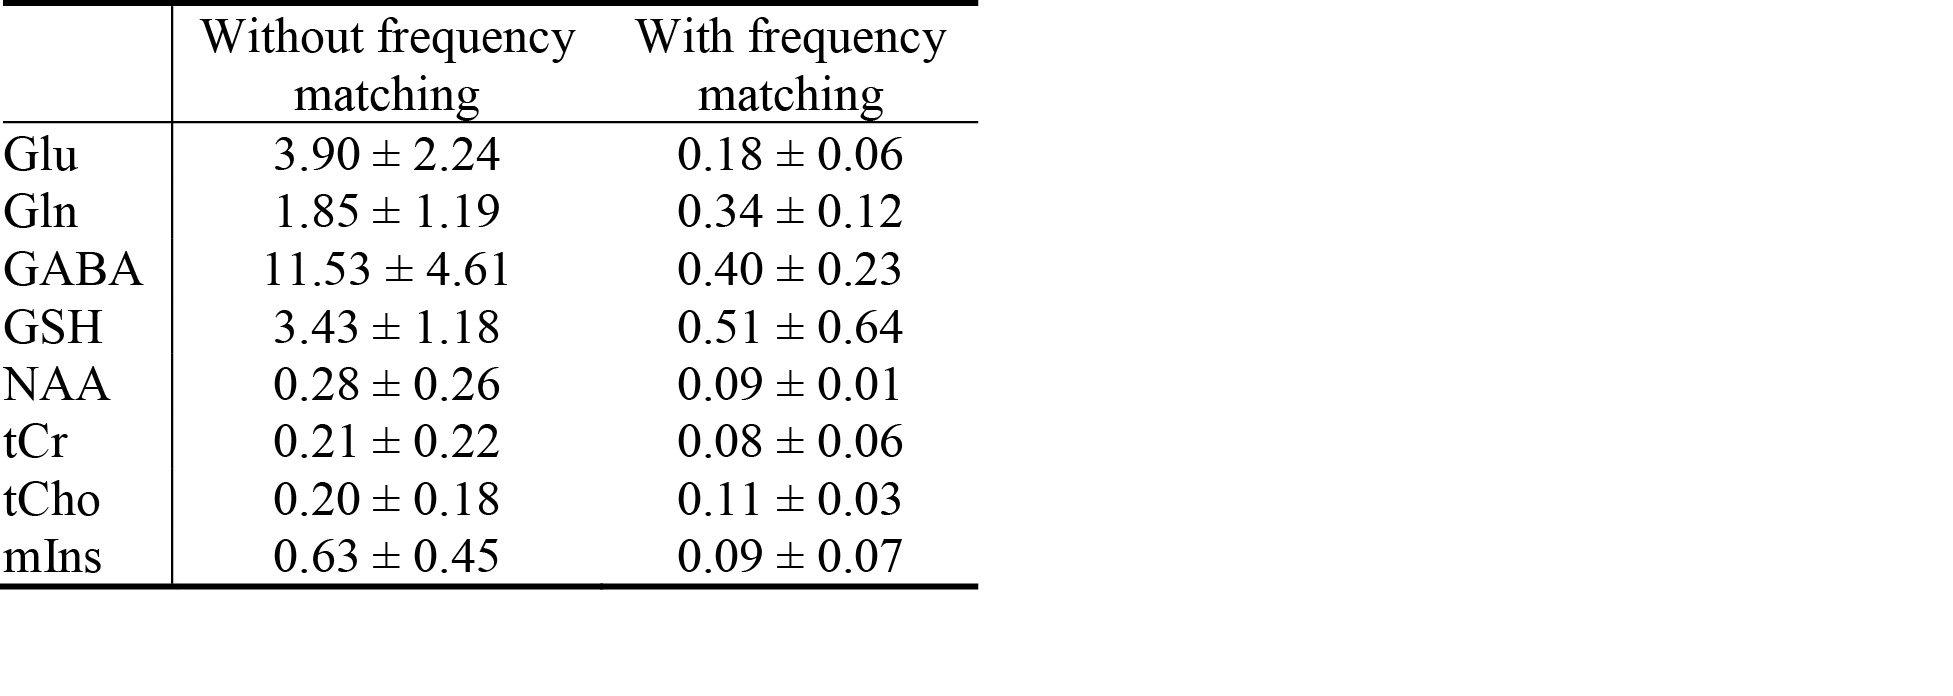
Table 2. Relative errors (%) in metabolite quantification by Monte Carlo analysis of five subjects. On average, the magnitude of frequency deviation during each scan was 2.4 ± 1.8 Hz.
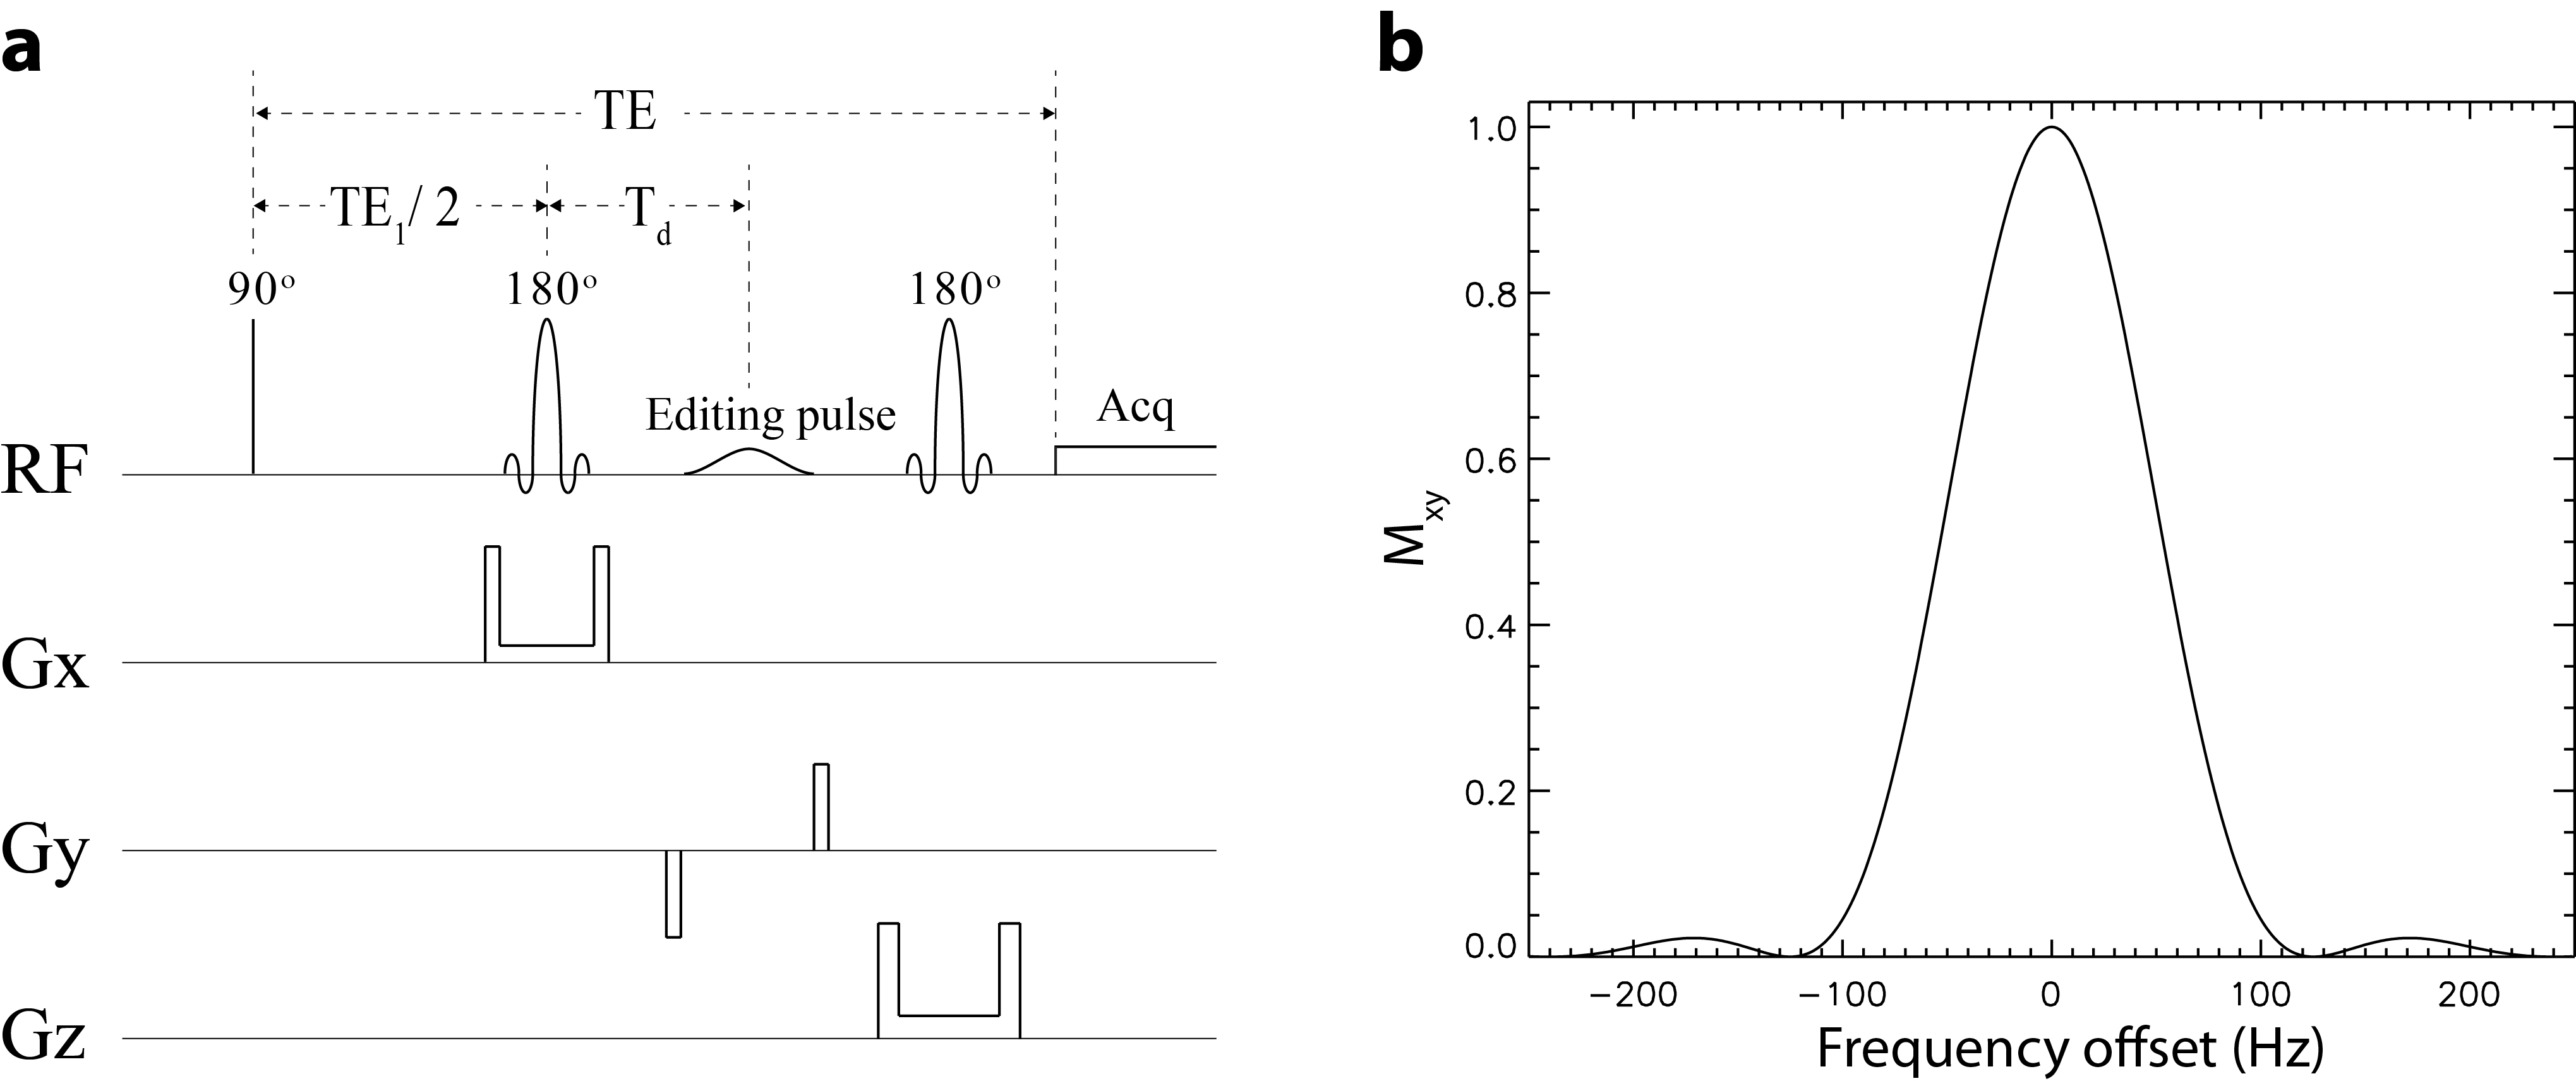
Figure 1. a Schematics of the simplified spectral editing pulse sequence used in full density matrix simulations. Repetition time (TR) = 3.5 s; echo time (TE) = 56 ms; TE1 = 40 ms; Td = 15.3 ms; editing radiofrequency (RF) pulse setting = OFF, ON at 1.89 ppm, and ON at 2.12 ppm. b Frequency profile of the 180° editing pulse which was a truncated Gaussian pulse with a duration of 10 ms.
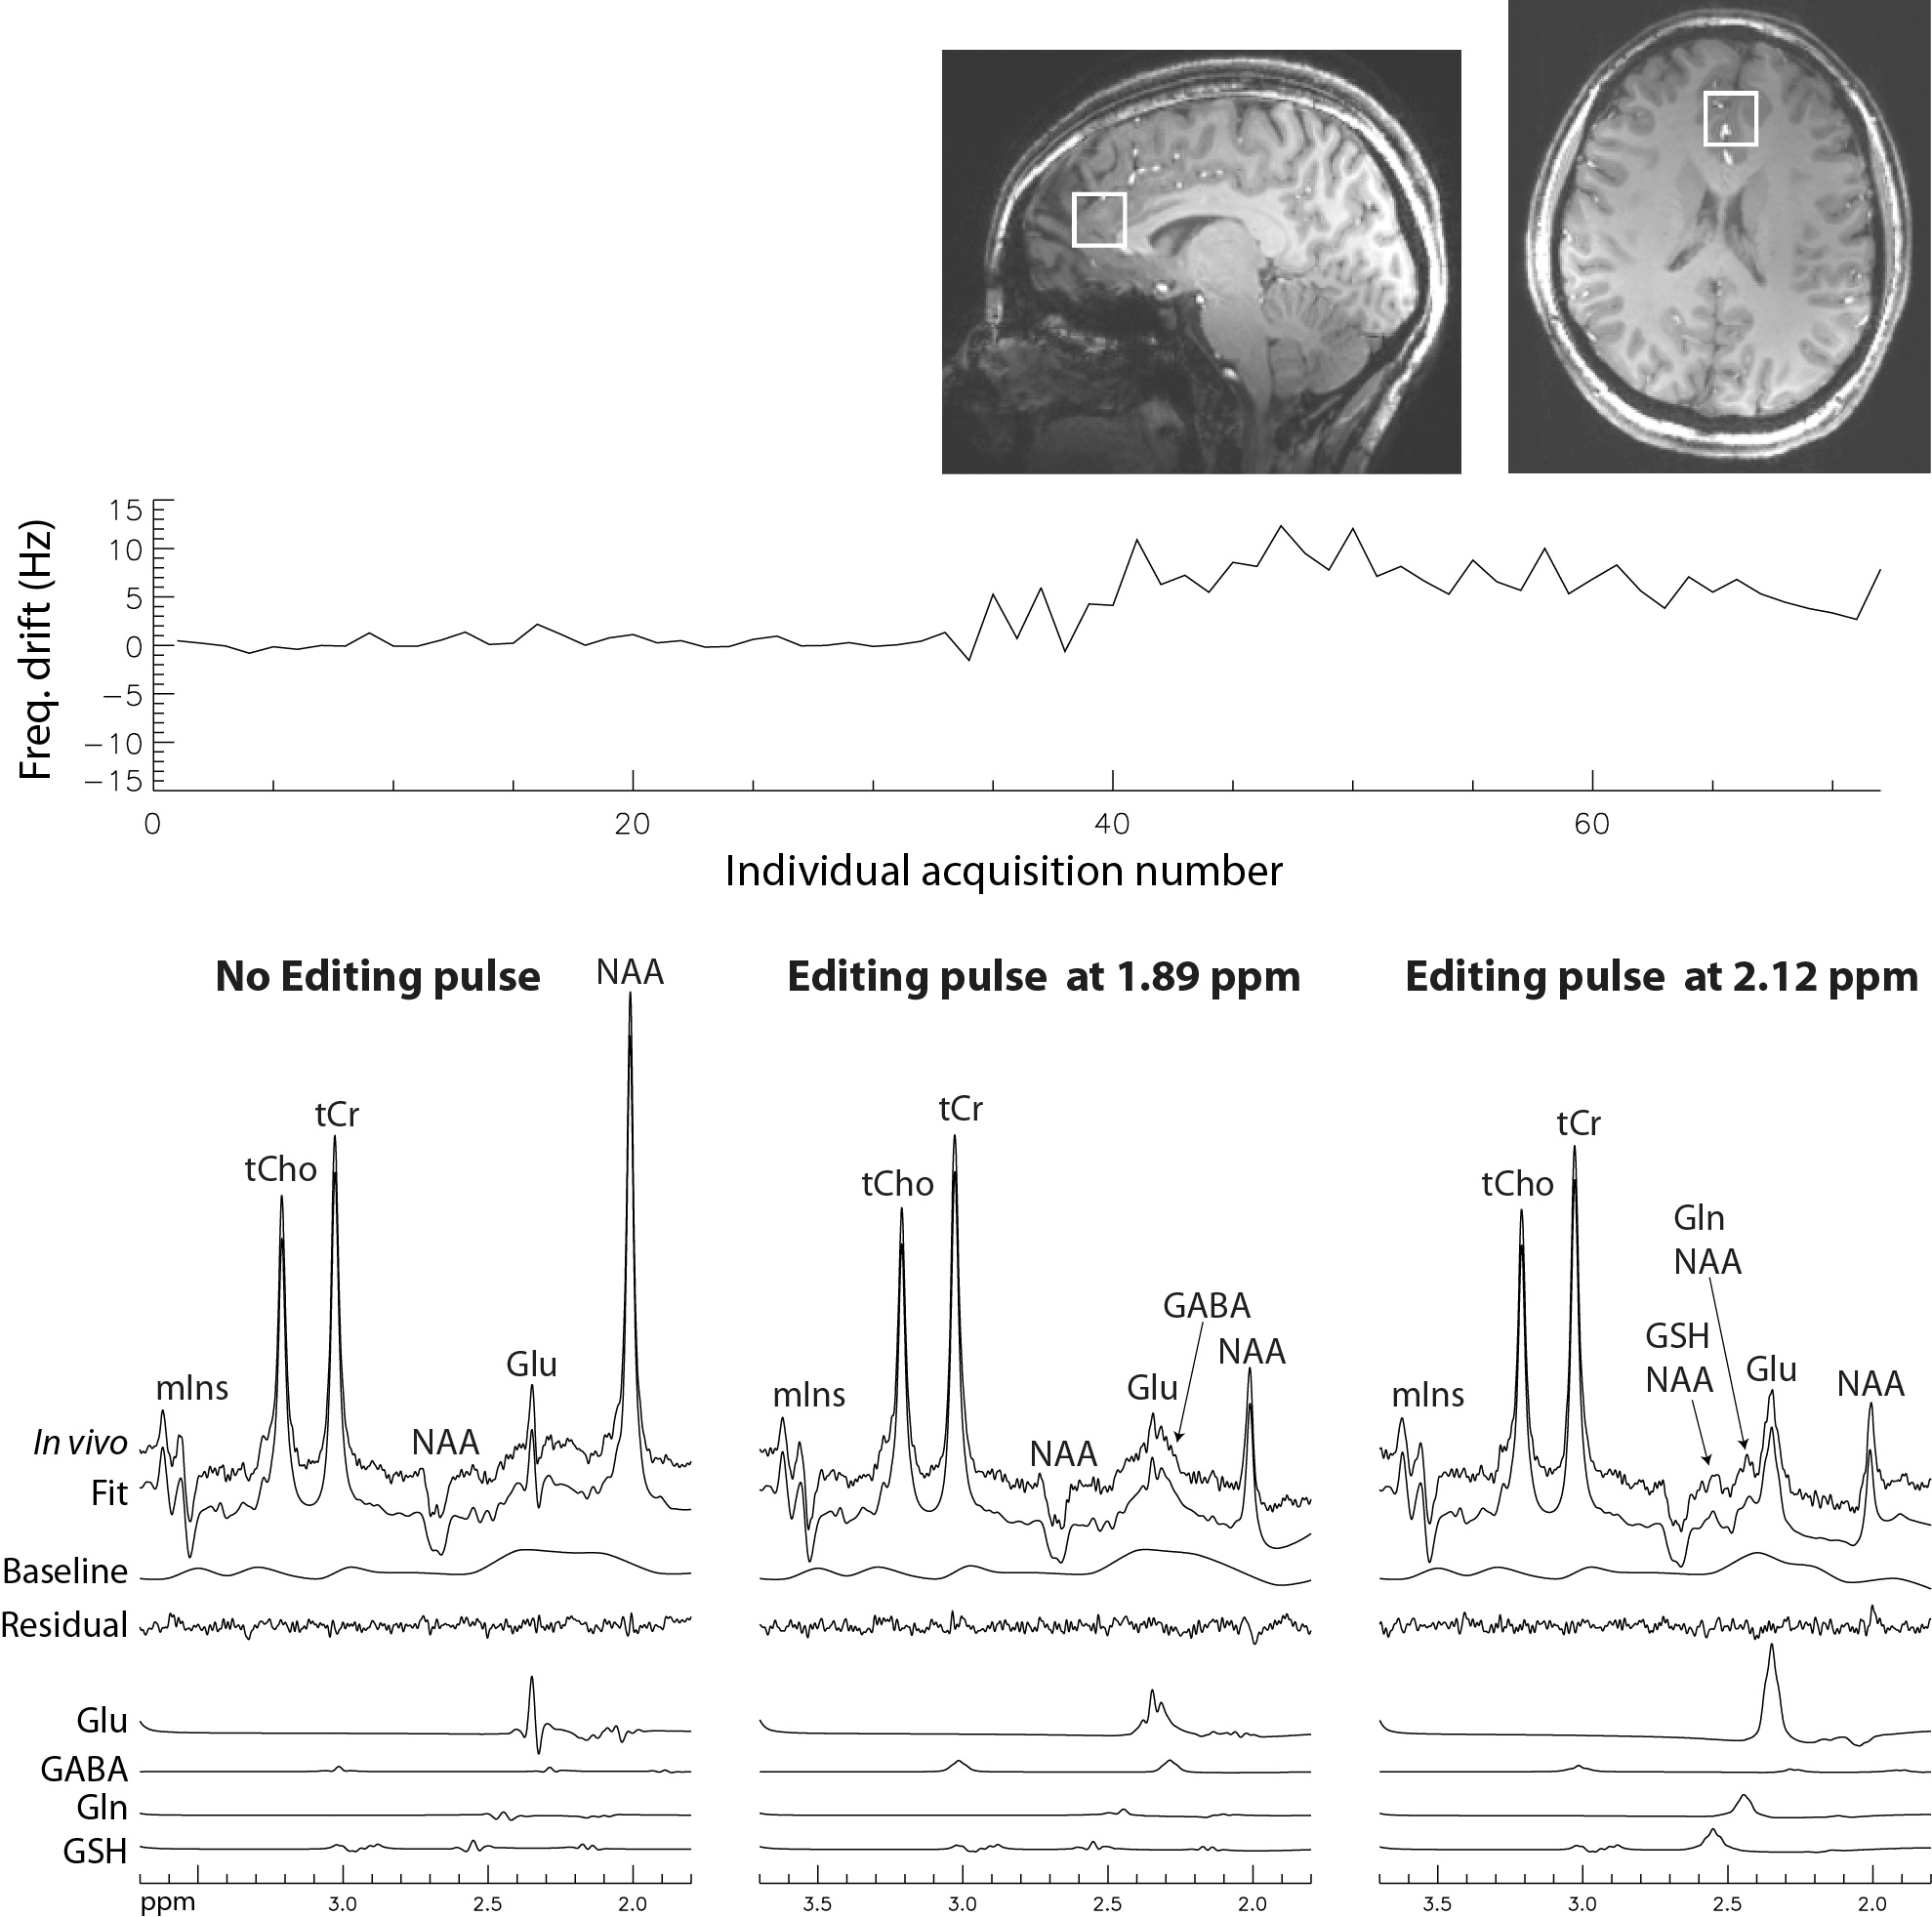
Figure 2. Frequency deviation history and reconstructed spectra and corresponding fits from a 2 × 2 × 2 cm3 voxel in the pregenual anterior cingulate cortex (pgACC) of one healthy volunteer. Repetition time (TR) = 3.5 s; echo time (TE) = 56 ms; TE1 = 40 ms; Td = 15.3 ms; spectral width = 4000 Hz; number of data points = 1024; number of averages = 72; and total scan time = 4 mins, 23 s.
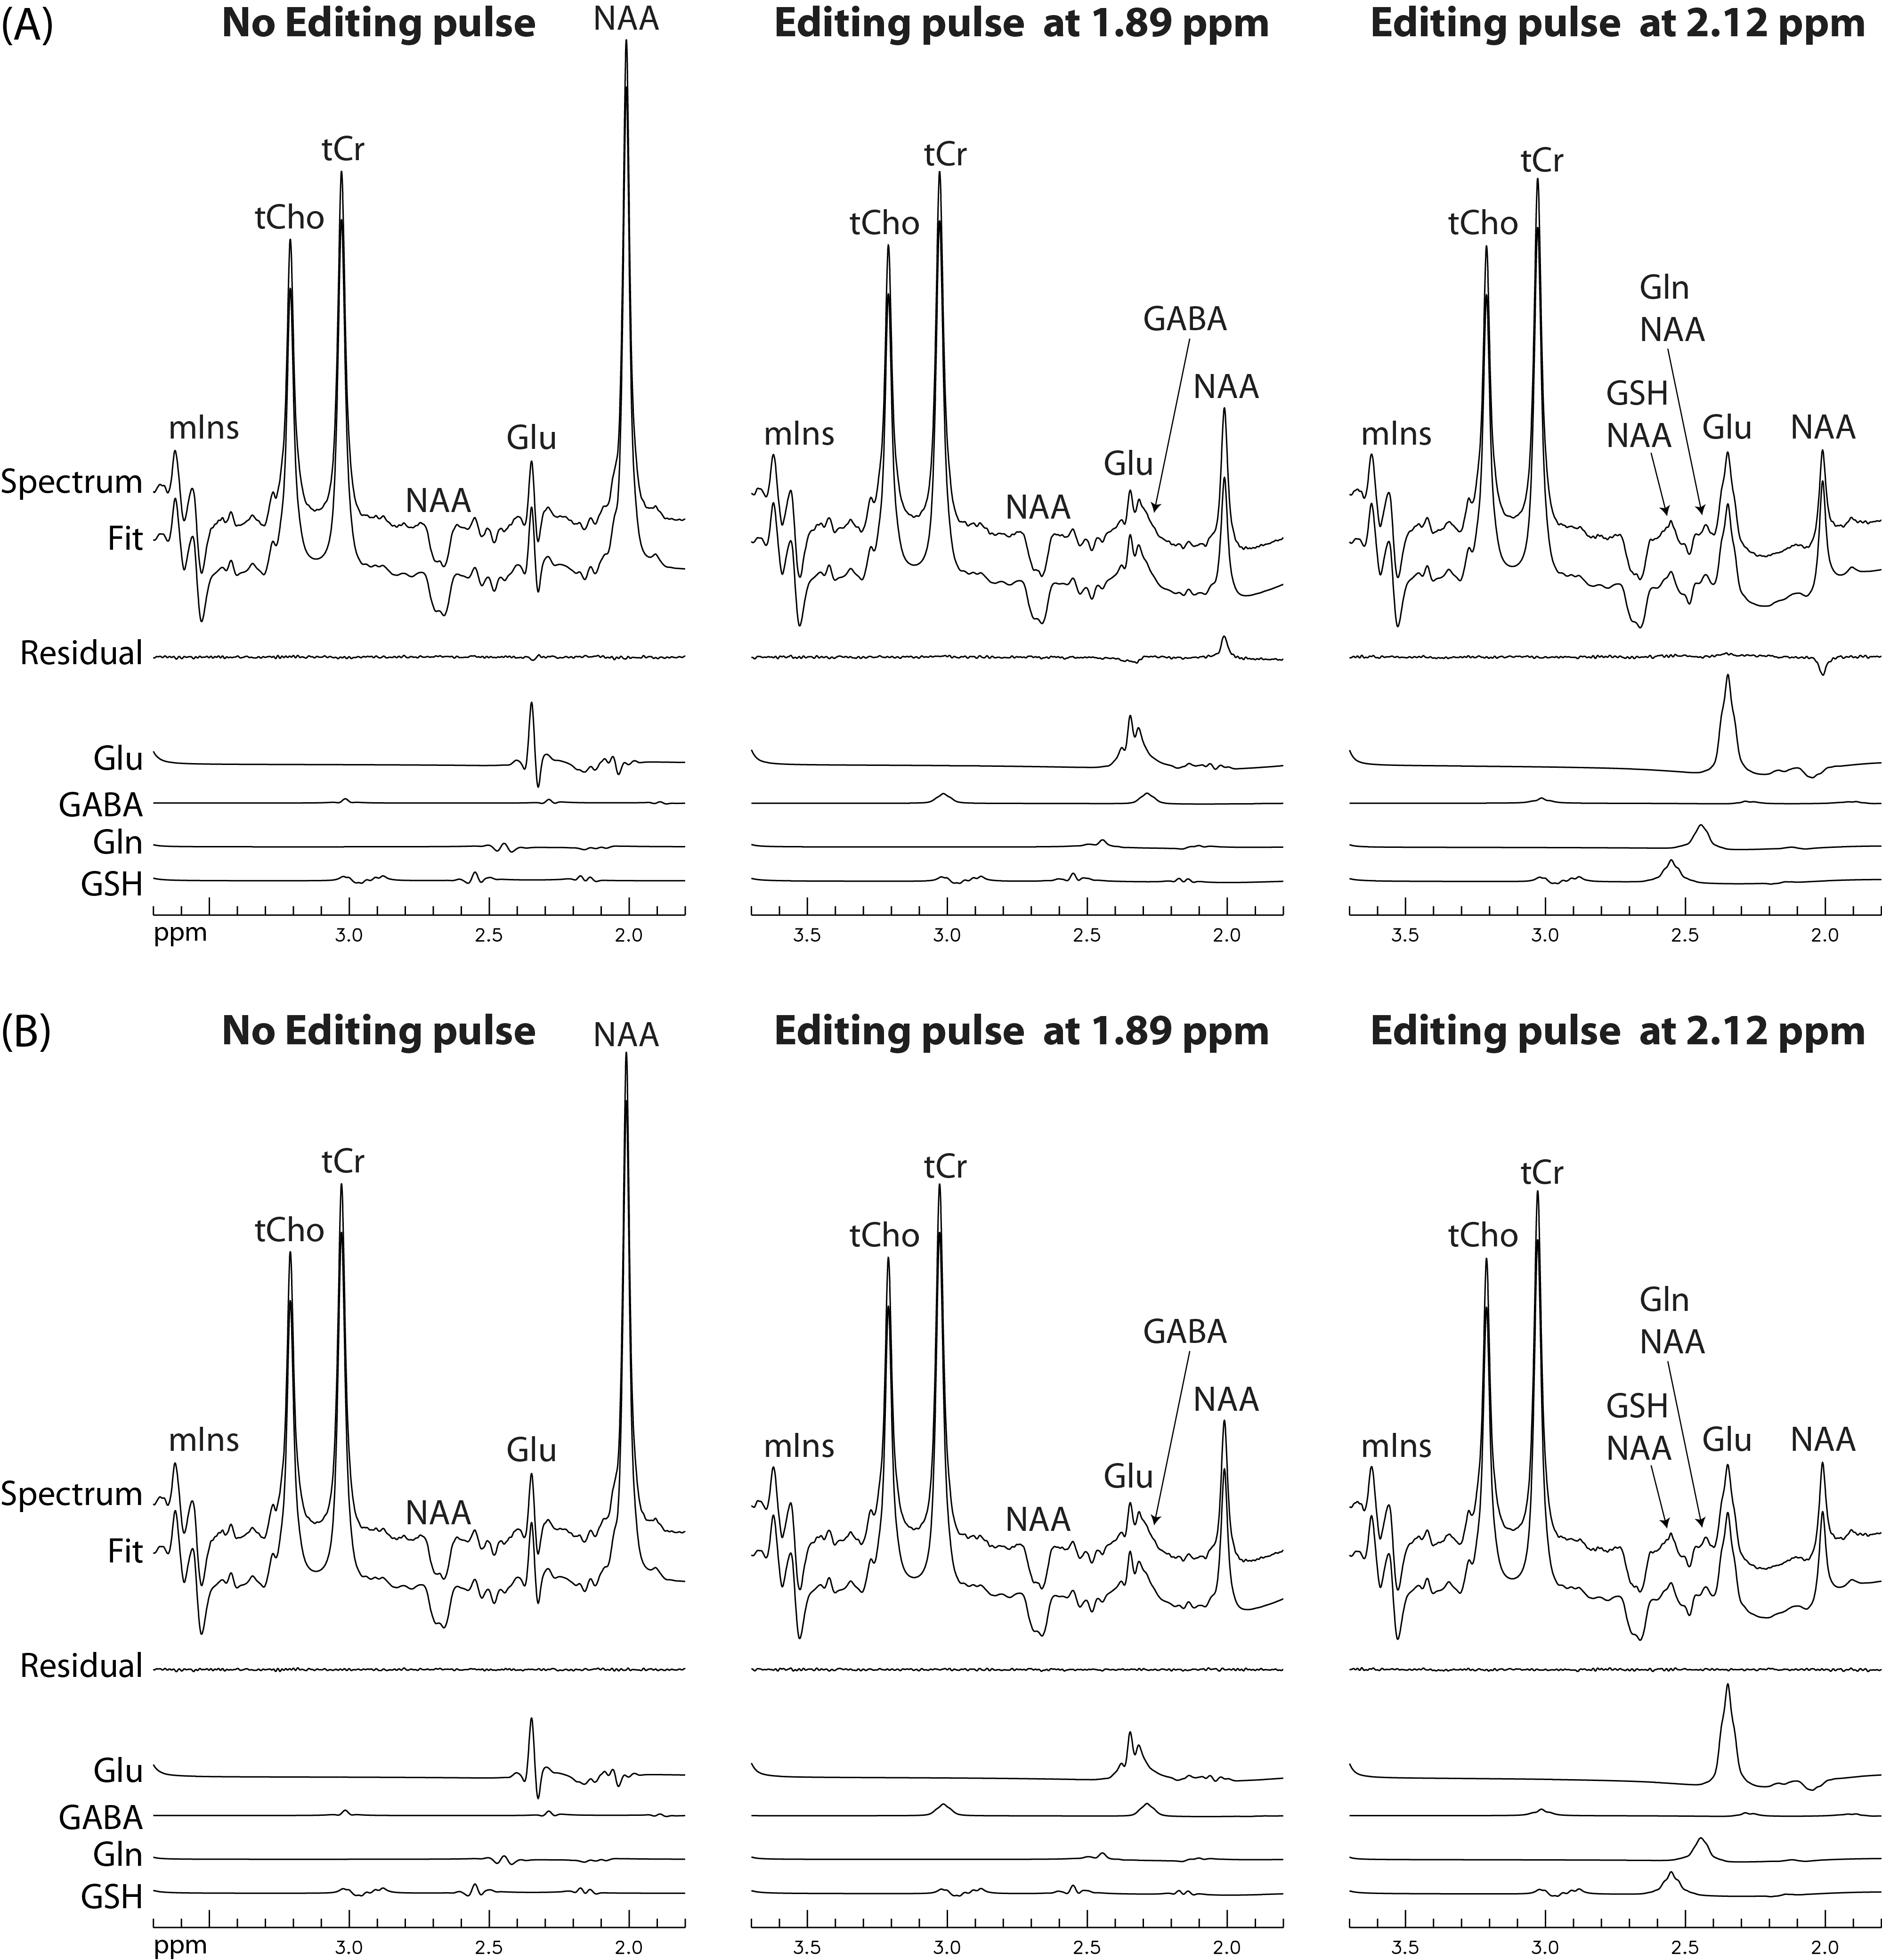
Figure 3. Monte Carlo analysis of an in vivo dataset (Figure 2). The displayed spectra and corresponding fits were averaged over 100 repetitions such that small residual signals were distinguishable from noise. (A) Basis functions without frequency matching were used. There were significant artifacts in the fit residual. (B) Basis functions with frequency matching were used. There were no visible artifacts in the fit residual.