0509
Does ADC better predict tumour cellularity or necrosis? A multi-centre multi-vendor study in twelve rodent tumour models1University of Manchester, Manchester, United Kingdom, 2Cancer Research UK Cambridge Institute, Cambridge, United Kingdom, 3AstraZeneca, Cambridge, United Kingdom, 4INSERM Center for Research on Inflammation, Paris, France, 5Imperial College, London, United Kingdom, 6Radboud University Medical Center, Nijmegen, Netherlands, 7European Institute for Molecular Imaging, University of Münster, Münster, Germany, 8TRIC, University Hospital, University of Münster, Münster, Germany, 9STFC, Daresbury, United Kingdom, 10Bioxydyn, Manchester, United Kingdom
Synopsis
We studied tumour Apparent Diffusion Coefficient (ADC), necrosis and cellularity in untreated rodent tumours of twelve types from six centres using two different vendors’ equipment. Tumour types included human xenografts (conventional and patient-derived) genetically engineered mouse tumours and syngeneic rat tumours. Across this broad spectrum there was a robust inverse correlation between ADC and cellularity, and a weaker positive correlation between ADC and necrosis. ADC mean and median were the best correlates for cellularity, while ADC standard deviation and kurtosis provided the best correlates for necrosis. This work advances the biological validation of ADC as a biomarker of tumour cellularity.
Introduction
Apparent diffusion coefficient (ADC) is used widely as a biomarker of treatment effect in cancer [1]. While some studies in single tumour types report good correlation between ADC and necrosis e.g. [2,3], others failed to detect a correlation [4,5]. It is unclear why ADC-histopathology correlations are not robust across tumour types, and why findings reported in one centre are not reproducible in other models in other centres using other vendors’ equipment. This study aims to determine whether correlations between tumour ADC, cellularity and necrosis persist across a broad range of pre-clinical tumours within a multicentre consortium aimed at validating imaging biomarkers in oncology[6].Methods
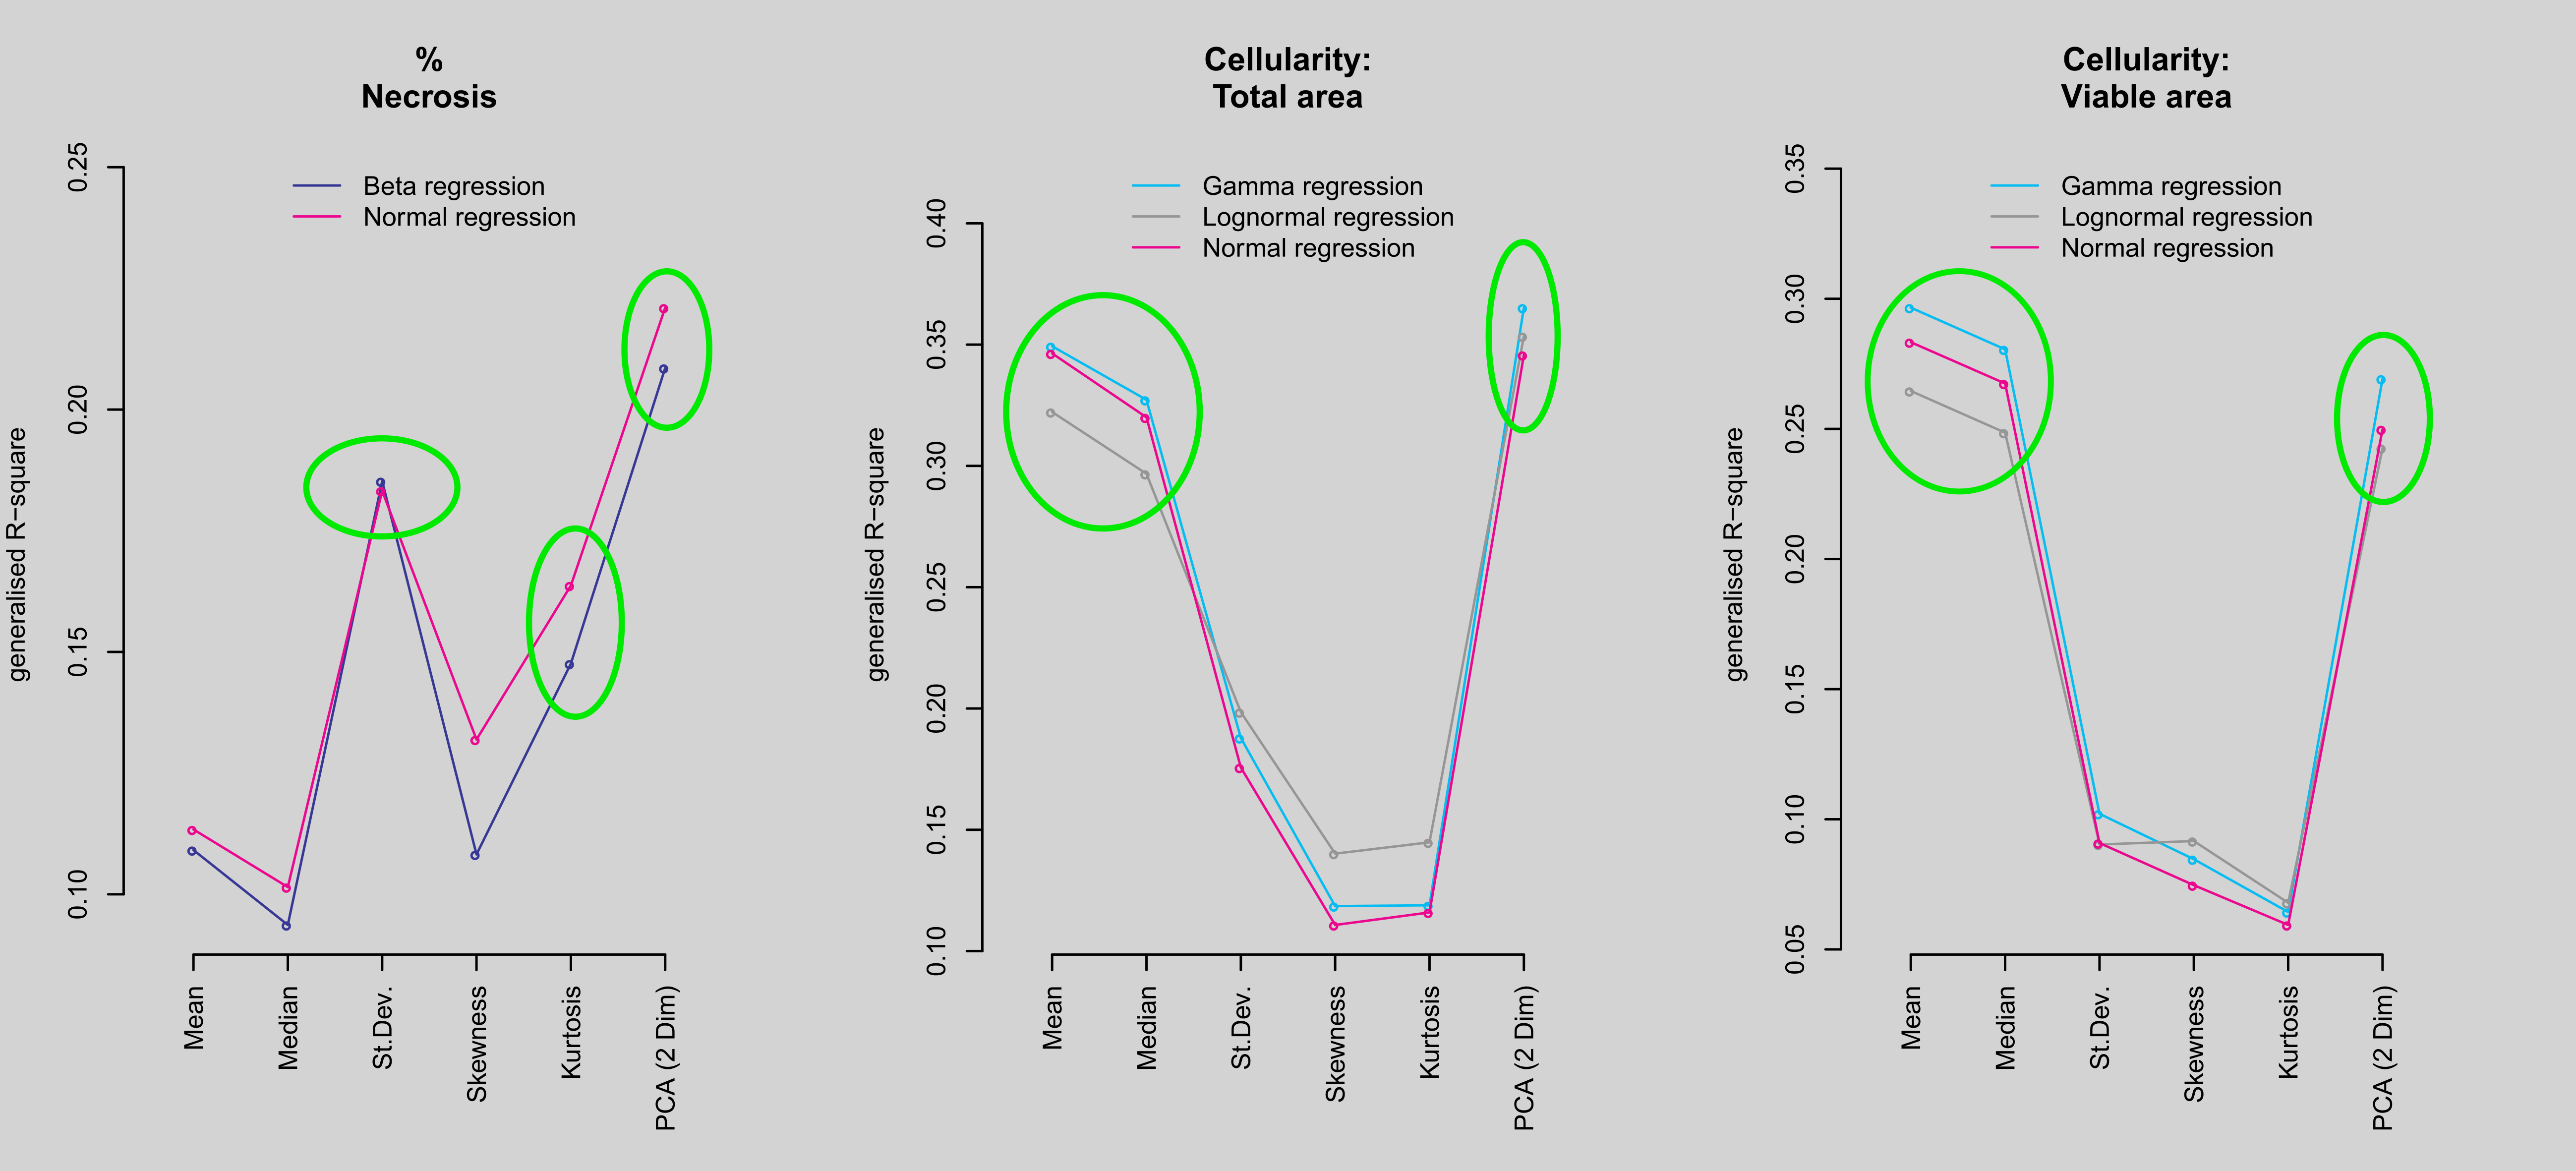
We studied 12 types of untreated tumours from six centres, comprising human (xenograft and PDX), syngeneic rat and GEM mouse tumours. All centres conformed to a consistent standard of ADC data acquisition [7] and used b values of ≥100 s/mm2. Tumours were cut in the plane of the ADC slice for fixation and paraffin processing. To ensure uniformity of histology analysis, paraffin-blocks from tumours were sectioned and stained centrally except for one centre for which direct comparability of staining was comprehensively tested and confirmed. All slides were assessed centrally. Sequential sections were stained with H&E for necrosis or Feulgen’s for cellularity and co-analysed using Halo software to deliver percent necrosis, total cellularity and cellularity in the viable area of each tumour location. Histology and ADC values were compared for the best-matched single ADC slice. More than one pair of sections was obtained from some tumours, separated by several millimetres, and each matched to a different ADC slice. For each matched tumour slice we used the mean, median, standard deviation, skewness and kurtosis of the observed ADC values as a univariate predictor of the histological outcomes, modelling by means of normal and beta regression percent necrosis and normal, lognormal and gamma regressions for cellularity outcomes. We also used the first 2 dimensions of a principal component analysis (PCA) performed on the selected ADC summary statistics as predictors. The best predictors were defined by means of the generalised Akaike Information Criterion (AIC) and R-square criteria.Results
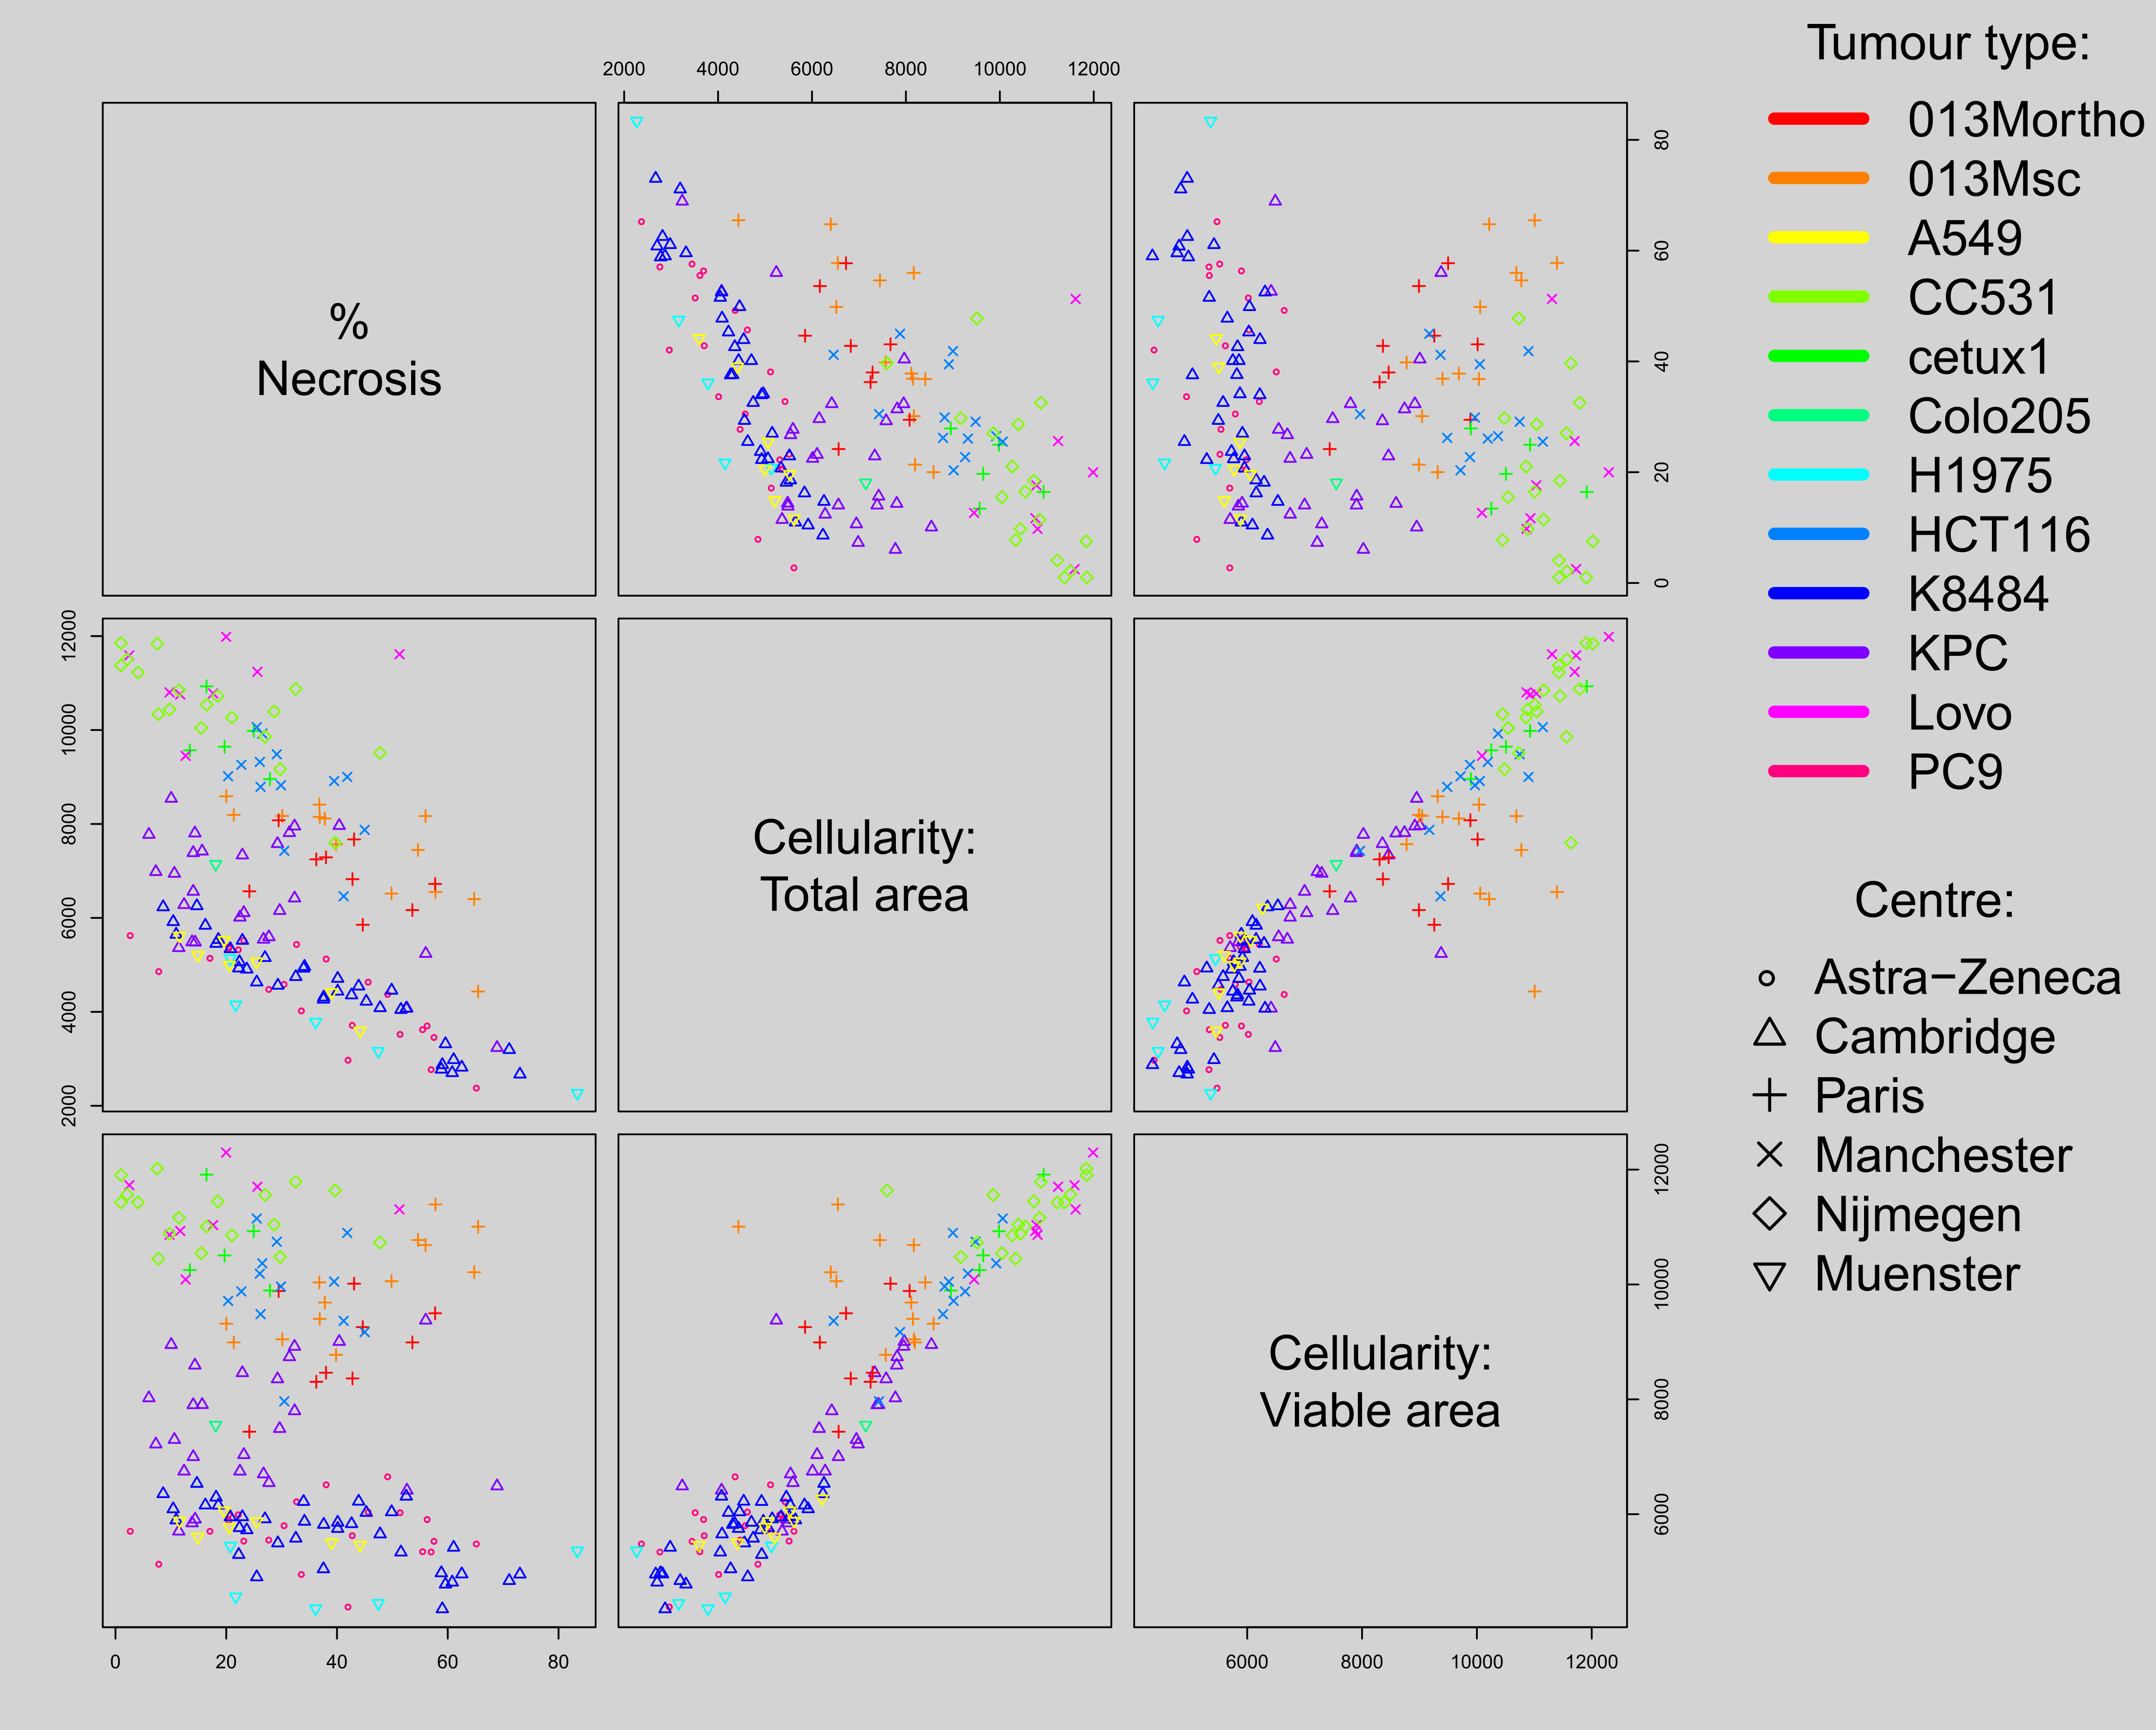
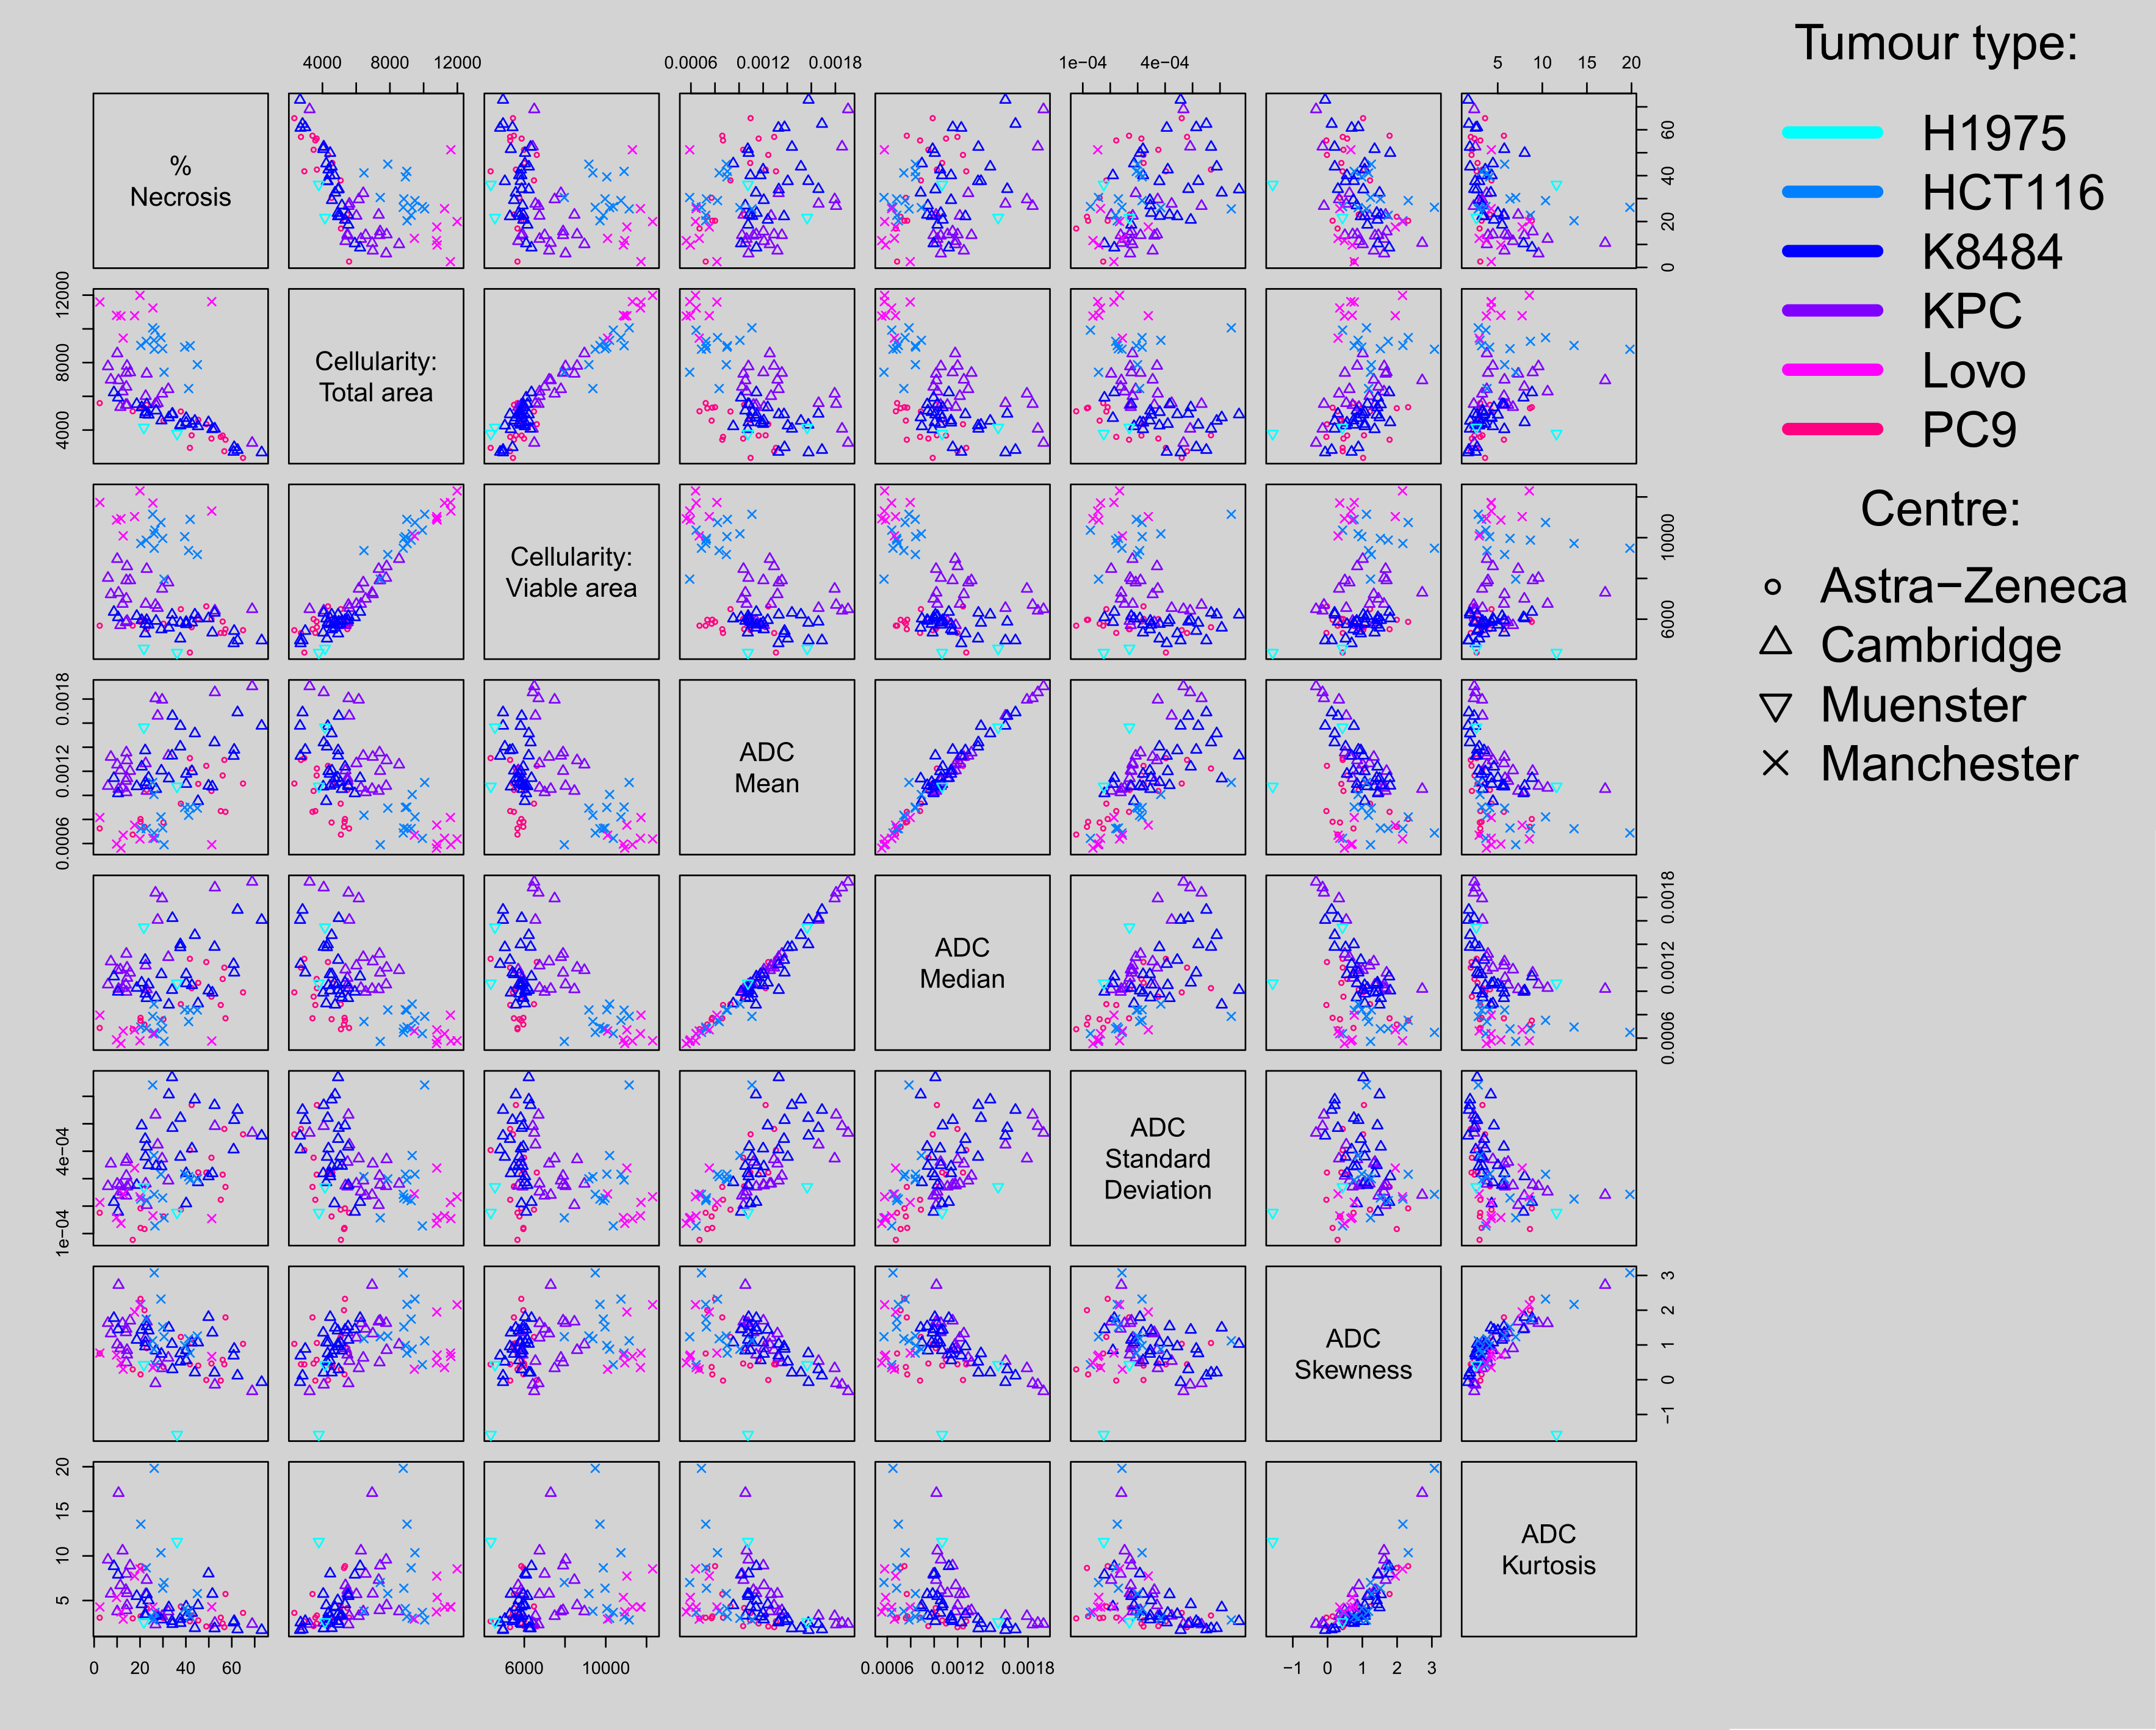
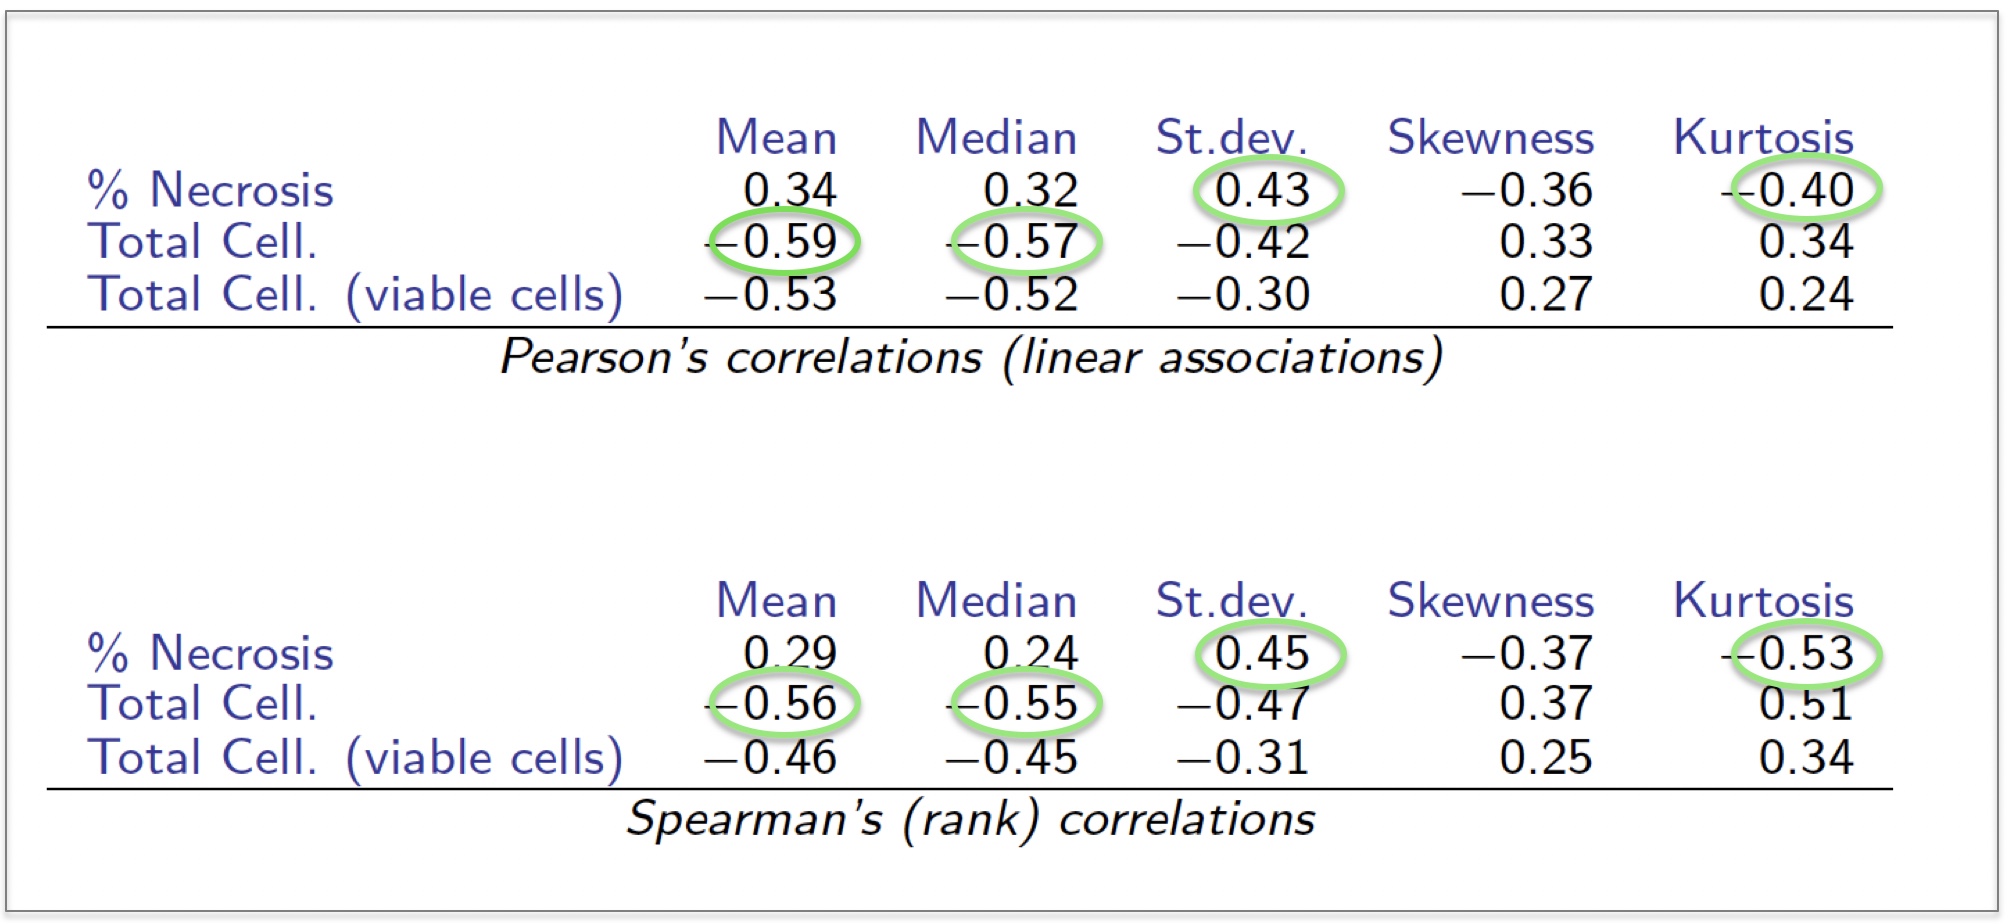
We present correlations between histology parameters (164 sections, 117 animals,12 tumour types) and correlations between ADC measures and a subset of the histology (88 sections, 56 animals, 6 tumour types). Figure 1 shows strong correlation between the whole section cellularity with that in the viable area, but relatively poor correlation between cellularity and necrosis. Figure 2 shows the patterns of correlation of the histological outcomes with ADC parameters and the associated values presented in Figure 3 confirm that mean and median ADC correlate better with cellularity than with necrosis, (see values circled in green). Total cellularity correlates better than cellularity of the viable area. Figure 4 shows results for preliminary statistical modelling, including PCA (2 dim), the combination of the first two principal components of the PCA. Both generalised R-square per outcome and generalised AIC model comparison (not shown) consolidate the conclusions from the data in Figures 2 and 3. The data suggest that the linear combination of the summary statistics defined by the PCA are the best predictors of the histological outcomes and that standard deviation and mean respectively are the best univariate predictors of necrosis and cellularity.Discussion
The biophysical measure, ADC of water in tissue, is, among other factors, dependent on the size and spacing of structures within the cellular microenvironment. Despite a general assumption that absolute ADC values reflect necrosis, our large multi-institutional pre-clinical tumour data presented here show that they better reflect cellularity, in part because many tumours have immune cell infiltration within necrotic areas. However, other factors must also contribute to this. The better predictors of necrosis itself are the descriptors of the shape of the ADC distribution curve, which appear to be reporting more faithfully than the absolute values on the variability in the cellular packing and integrity. Subvoxel areas of necrosis can be scattered widely across a tumour and would be expected to broaden the peaks associated with mainly viable areas, which could explain this observation. The observed dissociation between the correlations of ADC measures with necrosis and cellularity is probably underpinned by the relatively poor correlation of cellularity with necrosis.Conclusion
ADC correlates more strongly with cellularity than necrosis. This study is the most comprehensive biological validation of ADC to date as we extract common features from multiple pre-clinical tumour types, and hence identify robust parameters for future studies. Our findings will facilitate optimal use of ADC in patient studies of cancer therapy.Acknowledgements
We thank the CRUK Cambridge Institute histopathology and ISH core facility for support. The research leading to these results has received support from the Innovative Medicines Initiative Joint Undertaking (www.imi.europa.eu) under grant agreement number 115151, resources of which are composed of financial contribution from the European Union's Seventh Framework Programme (FP7/2007-2013) and EFPIA companies’ in kind contribution. This work was also supported by the the University of Cambridge, Cancer Research UK (C14303/A17197) and CRUK and EPSRC Cancer Imaging Centre in Cambridge and Manchester (grant C8742/A18097). The MRI scanner at the University of Manchester is supported by the UK BBSRC (BB/F011350/1).References
1. Sinkus R, Van Beers BE, Vilgrain V, et al. Apparent diffusion coefficient from magnetic resonance imaging as a biomarker in oncology drug development. Eur J Cancer. 2012;48(4):425-431.
2. de Souza PC, Balasubramanian K, Njoku C, et al. OKN-007 decreases tumor necrosis and tumor cell proliferation and increases apoptosis in a preclinical F98 rat glioma model. J Magn Reson Imaging. 2015;42(6):1582-1591.
3. Graham TJ, Box G, Tunariu N, et al. Preclinical evaluation of imaging biomarkers for prostate cancer bone metastasis and response to cabozantinib. J Natl Cancer Inst.2014;106(4):dju033
4. Schelhaas S, Held A, Wachsmuth L, et al. Gemcitabine Mechanism of Action Confounds Early Assessment of Treatment Response by 3'-Deoxy-3'-[18F]Fluorothymidine in Preclinical Models of Lung Cancer. Cancer Res. 2016;76(24):7096-7105
5. Heskamp S, Heijmen L, Gerrits D, et al. Response Monitoring with [18F]FLT PET and Diffusion-Weighted MRI After Cytotoxic 5-FU Treatment in an Experimental Rat Model for Colorectal Liver Metastases. Mol Imaging Biol. 2017;19(4):540-549.
6. www.quic-concept.eu
7. Doblas S, Almeida GS, Ble F-X et al. Apparent diffusion coefficient is highly reproducible on preclinical imaging systems: Evidence from a seven-center multivendor study. J Magn Reson Imaging. 2015: 42(6):1759-1764.
Figures