0508
Characterization of metabolic adaptations of patient-derived xenografts to in vitro tissue and cell culture using high-resolution NMR1Radiology and Biomedical Imaging, University of California, San Francisco, San Francisco, CA, United States, 2Urology, Stanford University, Stanford, CA, United States
Synopsis
In this study we investigated the metabolic changes that occurred when a renal cell carcinoma patient-derived xenograft was propagated in tissue slice culture or primary cell culture at varying pO2 levels to understand the attributes and limitations of each of the model systems for studying the metabolic underpinnings of this pathology using high resolution NMR. This data indicates drastically altered metabolism at varying pO2 and between each model system.
Purpose
Renal cell carcinoma (RCC) is the 16th most common cause of cancer death globally1. Predictive preclinical models of RCC are needed to improve all aspects of RCC clinical management from diagnosis to prognosis to treatment. While cell lines are a common and facile preclinical model, the intact microenvironment complete with vasculature and varying levels of oxygen delivery is an indelible feature of RCC that is germane to understanding its pathobiology, necessitating the use of in vivo tumor models. However, as in vivo models are labor-intensive and expensive, in vitro models may prove appropriate for certain studies. Since dysregulated metabolism is a key feature of RCC pathobiology, we used high-resolution NMR to investigate the metabolic changes that occurred when an RCC patient-derived xenograft (PDX) was propagated in tissue slice culture or primary cell culture at varying pO2 levels to understand the attributes and limitations of each of the model systems for studying the metabolic underpinnings of RCC.Materials and Methods
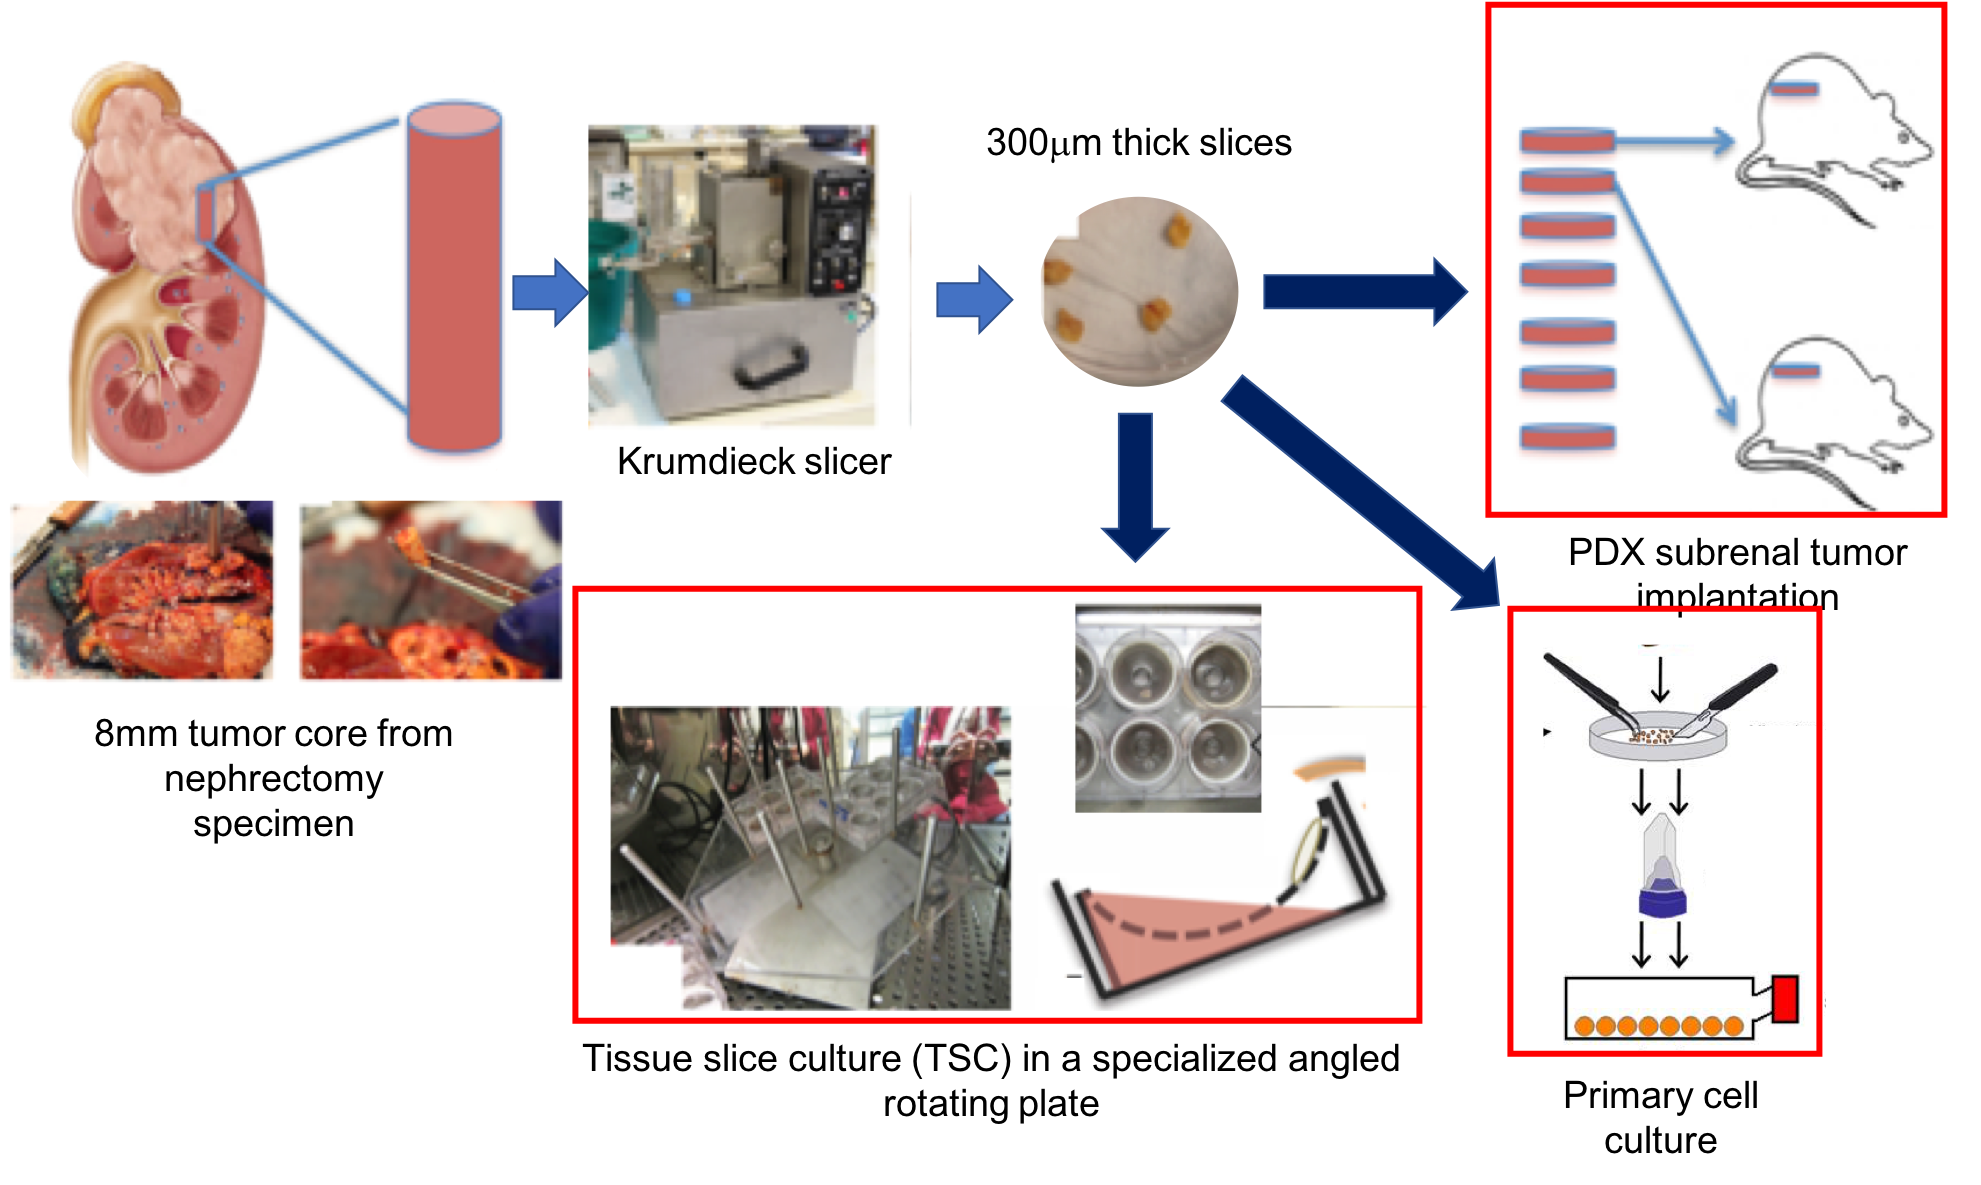
In vivo tumor model: A PDX was established from a metastasis to the colon of clear cell RCC with a VHL gene mutation2. Third generation subrenal PDX tumors were grown to ~0.8cc (from T2-weighted MRI). Mice were injected with 25%weight [U-13C]glucose via tail vein over 45min3. Tumor tissue was collected and flash-frozen.
Tissue slice cultures (TSCs): Second generation PDX tumors were precision-cut into thin (300-micron thick, 8-mm diameter) slices using a Krumdieck slicer, then cultured in an angled rotating plate in an atmospheric incubator (20% oxygen) in specialized medium2,4. After 12hrs of overnight culture, the TSCs were labeled with 25mM [1,6-13C2]glucose for 2hrs and flash-frozen.
Cells: Cells recovered after enzymatic digestion of harvested PDX tumors were established in primary culture under 2% oxygen using previously-described media5. At passage 10, cells were placed in incubators with 2%, 5% and 20% oxygen overnight, then incubated in DMEM containing 25mM [1,6-13C2]glucose for 6hrs and extracted.
Metabolite extraction: Metabolites were extracted from the aqueous layer of cold methanol:water:chloroform6, lyophilized, and resuspended in D2O for NMR analysis.
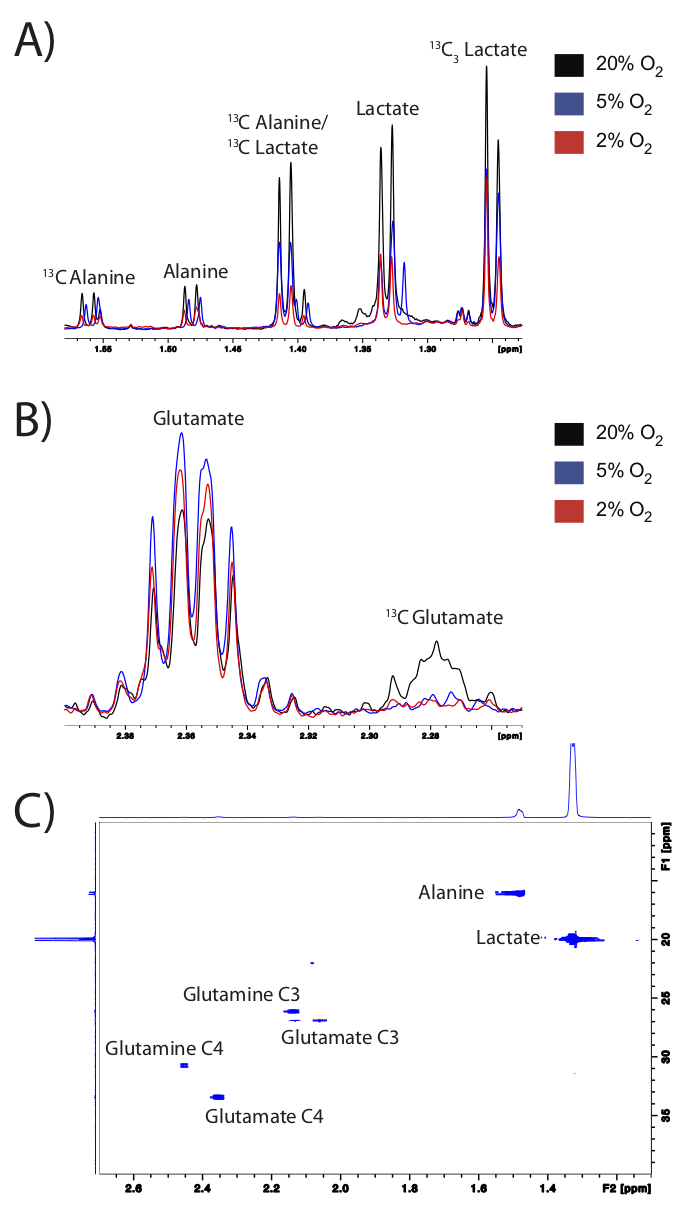
NMR: 13C-decoupled proton spectra and 2D 1H-13C HSQC were acquired on an 800Mhz spectrometer equipped with a multichannel cryo-probe to quantify fractional enrichment (FE)=[13C-metabolite]/[12C-metabolite+13C-metabolite] (Fig3).
Results
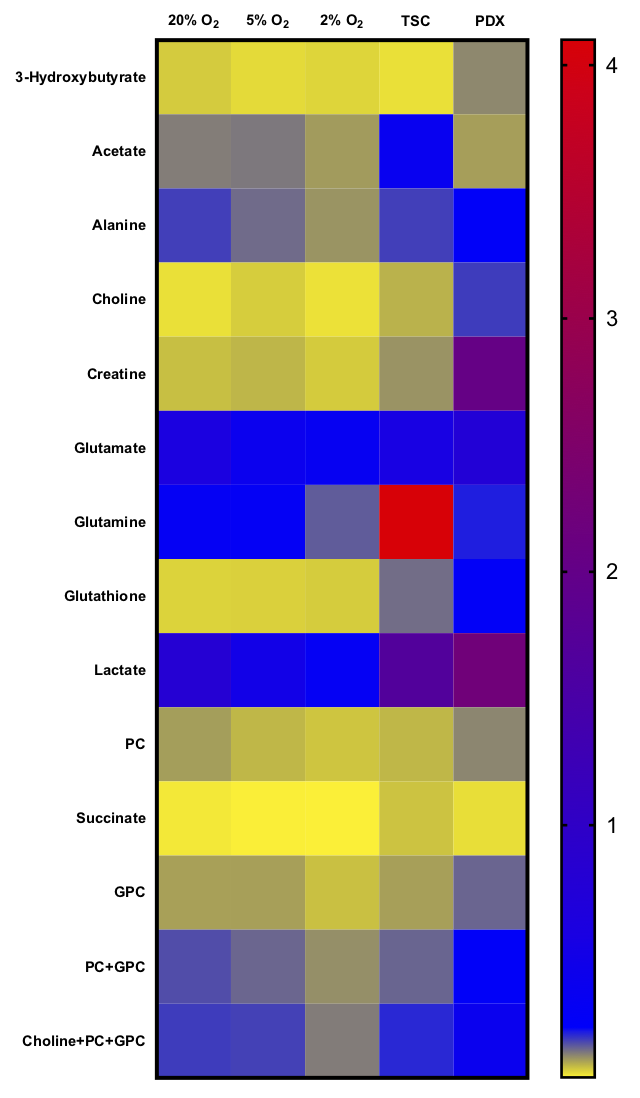
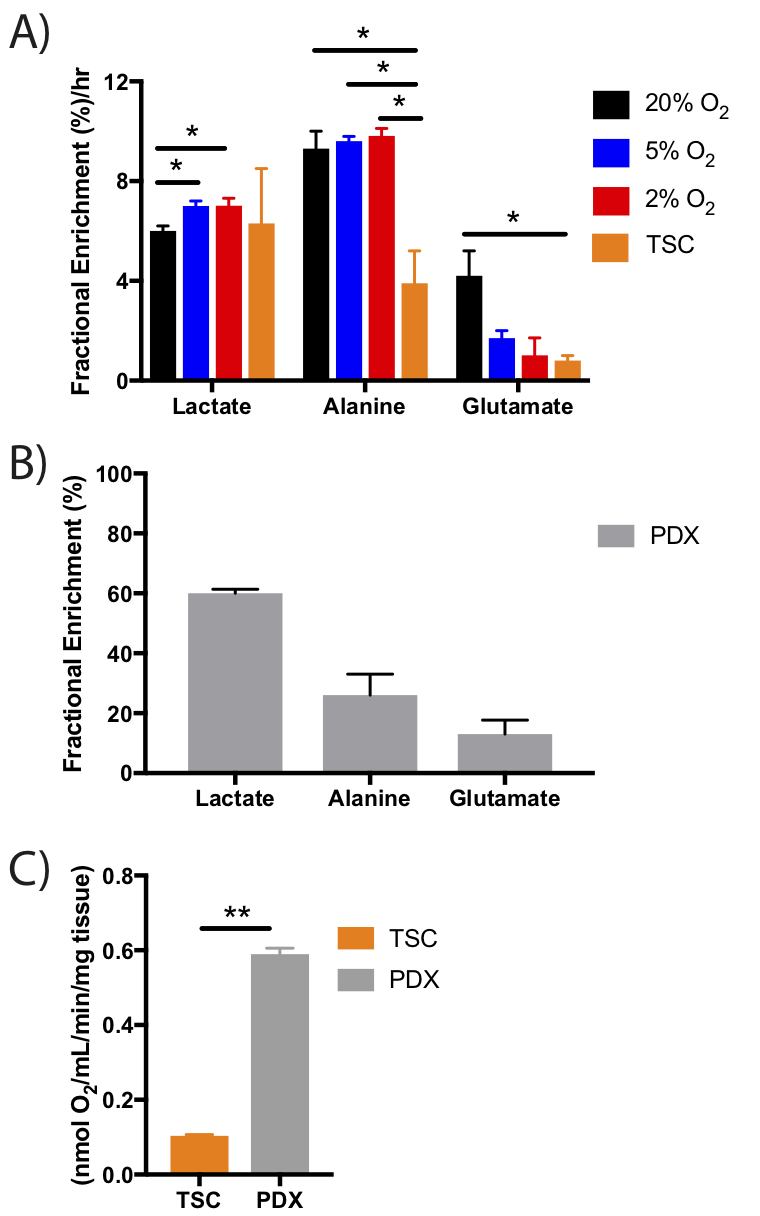
Normalized intracellular metabolite concentrations (Fig2) indicated drastic changes between the model systems. PDX tumors had almost 10-fold increases in choline, creatine and glutathione compared to cells. TSCs also had 10-fold higher choline and glutathione compared to cells, and higher acetate and glutamine than other models. Lactate was significantly higher (2-fold) in the TSCs and PDX tumors compared to the cells. In cells grown in varying pO2, hypoxic cells had significantly reduced oxidative metabolism (glutamate) and proliferation (choline compounds) compared to cells grown in atmospheric conditions, as expected7-10. Representative 1D proton spectra (Fig3) indicated significantly upregulated glucose flux to glycolysis and oxidative metabolism evidenced by the 13C-lactate and 13C-glutamate peaks in the cells grown in 20% oxygen compared to lower oxygen levels (5% and 2%). Cells grown in 5% or 2% oxygen also had significantly elevated glycolysis (higher lactate FE) and significantly decreased oxidative metabolism (lower glutamate FE) compared to cells grown in 20% oxygen (Fig4). Although TSCs had similar lactate FE as cells, alanine FE and glutamate FE was significantly reduced. Furthermore TSCs had reduced glutamate FE and OCR compared to PDX, indicating reduced oxidative metabolism. While the FE in PDX wasn’t directly comparable to cells or TSC, due to the differences in duration/mode of labeling, the absolute enrichment of lactate, alanine and glutamate (60%, 30% and 20% respectively) was similar to that of cells grown under atmospheric conditions (45%, 25% and 20%).Discussion and Conclusion
Oxidative stress is often heterogenous in in vivo tumors with tumors being hypometabolic under conditions of hypoxia and transforming to highly oxidative under atmospheric conditions; with tumor metabolism rapidly switching between anaerobic glycolysis to carbohydrate oxidation11. This metabolic adaptation is also demonstrated in tumor cells grown in vitro under varying oxygen conditions. Interestingly hypoxic conditions (2% oxygen) were necessary to efficiently grow during primary cell culture; with cells grown under atmospheric conditions only becoming viable in later passages. However, the metabolism of PDX tissues is better recapitulated by cells grown under atmospheric conditions, indicating maintenance of common metabolic pathways under these conditions. The increased creatine, choline compounds and glutathione plausibly reflect the heterogeneity of the cells and their microenvironment that’s prevalent in the in vivo PDX tumors but not fully recapitulated in in vitro cell studies. Currently, the genomic drivers underlying these metabolic changes are being investigated to further understand the metabolic transformations that occur in the different model systems.Acknowledgements
The authors would like to acknowledge Sukumar Subramaniam and Romelyn Delos Santos for their help. This work has been supported by the following grants: NIH P41EB013598 (JK), NIH U01CA217456 (JK/DP), Department of Defense Peer Reviewed Visionary Postdoctoral Fellowship (RS), Department of Defense Peer Reviewed Cancer Research Concept Award (ZJW), Radiological Society of North America Scholar grant (ZJW).References
1) M. Medina-Rico, H. L. Ramos, M. Lobo, J. Romo and J. G. Prada, Canadian Urological Association Journal, 2018, 12, E154.
2) A. E. Thong, H. Zhao, A. Ingels, M. P. Valta, R. Nolley, J. Santos, S. R. Young and D. M. Peehl, Urologic Oncology: Seminars and Original Investigations, 2014, 32, 43.e23–43.e30.
3) A. N. Lane, J. Yan and T. W. M. Fan, Bio-protocol, 2015, 5.
4) R. Sriram, M. Van Criekinge, J. D. Santos, K. R. Keshari, D. M. Wilson, D. Peehl, J. Kurhanewicz and Z. J. Wang, Tomography, 2016, 2, 35–42.
5) M. Varna, G. Gapihan, J.-P. Feugeas, P. Ratajczak, S. Tan, I. Ferreira, C. Leboeuf, N. Setterblad, A. Duval, J. Verine, S. Germain, P. Mongiat-Artus, A. Janin and G. Bousquet, Clin Cancer Res, 2015, 21, 916–924.
6) R. Prasad Maharjan and T. Ferenci, Analytical Biochemistry, 2003, 313, 145–154.
7) K. Glunde, Z. M. Bhujwalla and S. M. Ronen, Nature Reviews Cancer, 2011, 11, 835–848.
8) N. S. Chandel and G. R. S. Budinger, Free Radical Biology and Medicine, 2007, 42, 165–174.
9) R. E. Kimura, G. E. Thulin, D. Wender and J. B. Warshaw, J Appl Physiol, 1983, 55, 1501–1505.
10) K. K. Papas, R. C. Long, A. Sambanis and I. Constantinidis, Biotechnol Bioeng, 1999, 66, 231–237.
11) A. C. Kulkarni, P. Kuppusamy and N. Parinandi, Antioxid. Redox Signal., 2007, 9, 1717–1730.
Figures