0504
Prediction of Breast Cancer Response to Neoadjuvant Chemotherapy with High b-Value Non-Gaussian Diffusion MRI1Center for Magnetic Resonance Research, University of Illinois at Chicago, Chicago, IL, United States, 2Department of Bioengineering, University of Illinois at Chicago, Chicago, IL, United States, 3Department of Radiology, Cancer Hospital, Chinese Academy of Medical Sciences, Beijing, China, 4Department of Electrical and Computer Engineering, University of Illinois at Chicago, Chicago, IL, United States, 5Departments of Radiology and Neurosurgery, University of Illinois at Chicago, Chicago, IL, United States
Synopsis
Neoadjuvant chemotherapy has been used to extend surgical options by downstaging tumor in both locally advanced and operable breast cancer. An early imaging assessment of tumor response to neoadjuvant chemotherapy is critical for timely tailoring personalized treatment strategies. In this study, we investigate whether the changes in the parameters derived from a non-Gaussian diffusion model – continuous-time random-walk (CTRW) model – are predictive of pathologic response in women undergoing neoadjuvant chemotherapy. Our results demonstrate the high predictive performance of the combined changes in CTRW parameters from pre-treatment levels as early as the second cycle of chemotherapy.
Introduction:
Breast cancer is the second cause of female cancer death in the US1. Neoadjuvant chemotherapy is used to downstage tumor in both locally advanced and operable breast cancer2. An accurate imaging assessment of tumor response to neoadjuvant chemotherapy is critical for limiting the use of ineffective chemotherapy, timely planning of alternative treatments, and predicting survival. With its ability to probe tissue microstructural alterations, diffusion-weighted MRI (DWI) is reported to be predictive of breast cancer response with conventional apparent diffusion coefficient (ADC)3,4 or the intra-voxel incoherence motion (IVIM) parameters5-7. Despite its advantages over dynamic contrast-enhanced MRI (DCE-MRI), DWI with these parameters has not been fully established as an imaging marker for breast cancer response to therapy3. Recent advances in high b-value diffusion imaging have enabled the use of a number of non-Gaussian diffusion models with their parameters reflecting different aspects of tissue microstructures. One of these models is the continuous-time random-walk (CTRW) model, producing a pair of spatial and temporal diffusion heterogeneity parameters that have been shown to be useful in cancer imaging8,9. In this study, we investigate the predictive power of the CTRW parameters for the pathologic response to neoadjuvant chemotherapy of breast cancer.Methods:
Patients: 22 histologically confirmed breast cancer patients with scheduled neoadjuvant chemotherapy were recruited to the study. Patients with Miller-Payne10 grade 4 or 5 were categorized as having a pathologic response (pR, n=10), and with grades 1-3 as not having a pR (npR, n=12). Image Acquisition: All patients were scanned on a 3T MR scanner (GE Healthcare, MR750) at three time points: before the first course (pre-treatment), after the second course (mid-treatment), and after the final course (post-treatment) of chemotherapy. The DWI was performed with 12 b-values (0 to 3000s/mm2) and the following parameters: TR/TE=3500/80ms, slice thickness=5.5mm, FOV=34cm×34cm, matrix=256×256. Trace-weighted images were obtained to minimize the effect of diffusion anisotropy. DWI Analysis: The mid-treatment and post-treatment diffusion-weighted images were co-registered with the pre-treatment images using a 3D non-rigid image registration algorithm11,12. The co-registered multi-b-value diffusion-weighted images at each time point were analyzed with the CTRW model8, $$S/S_{0}=E_{\alpha}(-(bD_{m})^{\beta}), (1) $$ where Dm is an anomalous diffusion coefficient, α and β are temporal and spatial diffusion heterogeneity parameters, respectively, and Eα is a Mittag-Leffler function. Statistical Analysis: The regions of interest (ROIs) were drawn on the pre-treatment images. These ROIs were then propagated to the CTRW parameter maps computed from the co-registered diffusion-weighted images at all time points. The ROI-based parameter changes of the pR and npR groups, calculated as the percentage change from the pre-treatment value, were compared at both mid-treatment (ΔmidDm, Δmidα, Δmidβ) and post-treatment (ΔpostDm, Δpostα, Δpostβ) by a Mann-Whitney U-test. The performance of the parameter changes for predicting pR at mid-treatment and post-treatment was then evaluated with a receiver operator characteristics (ROC) analysis.Results:
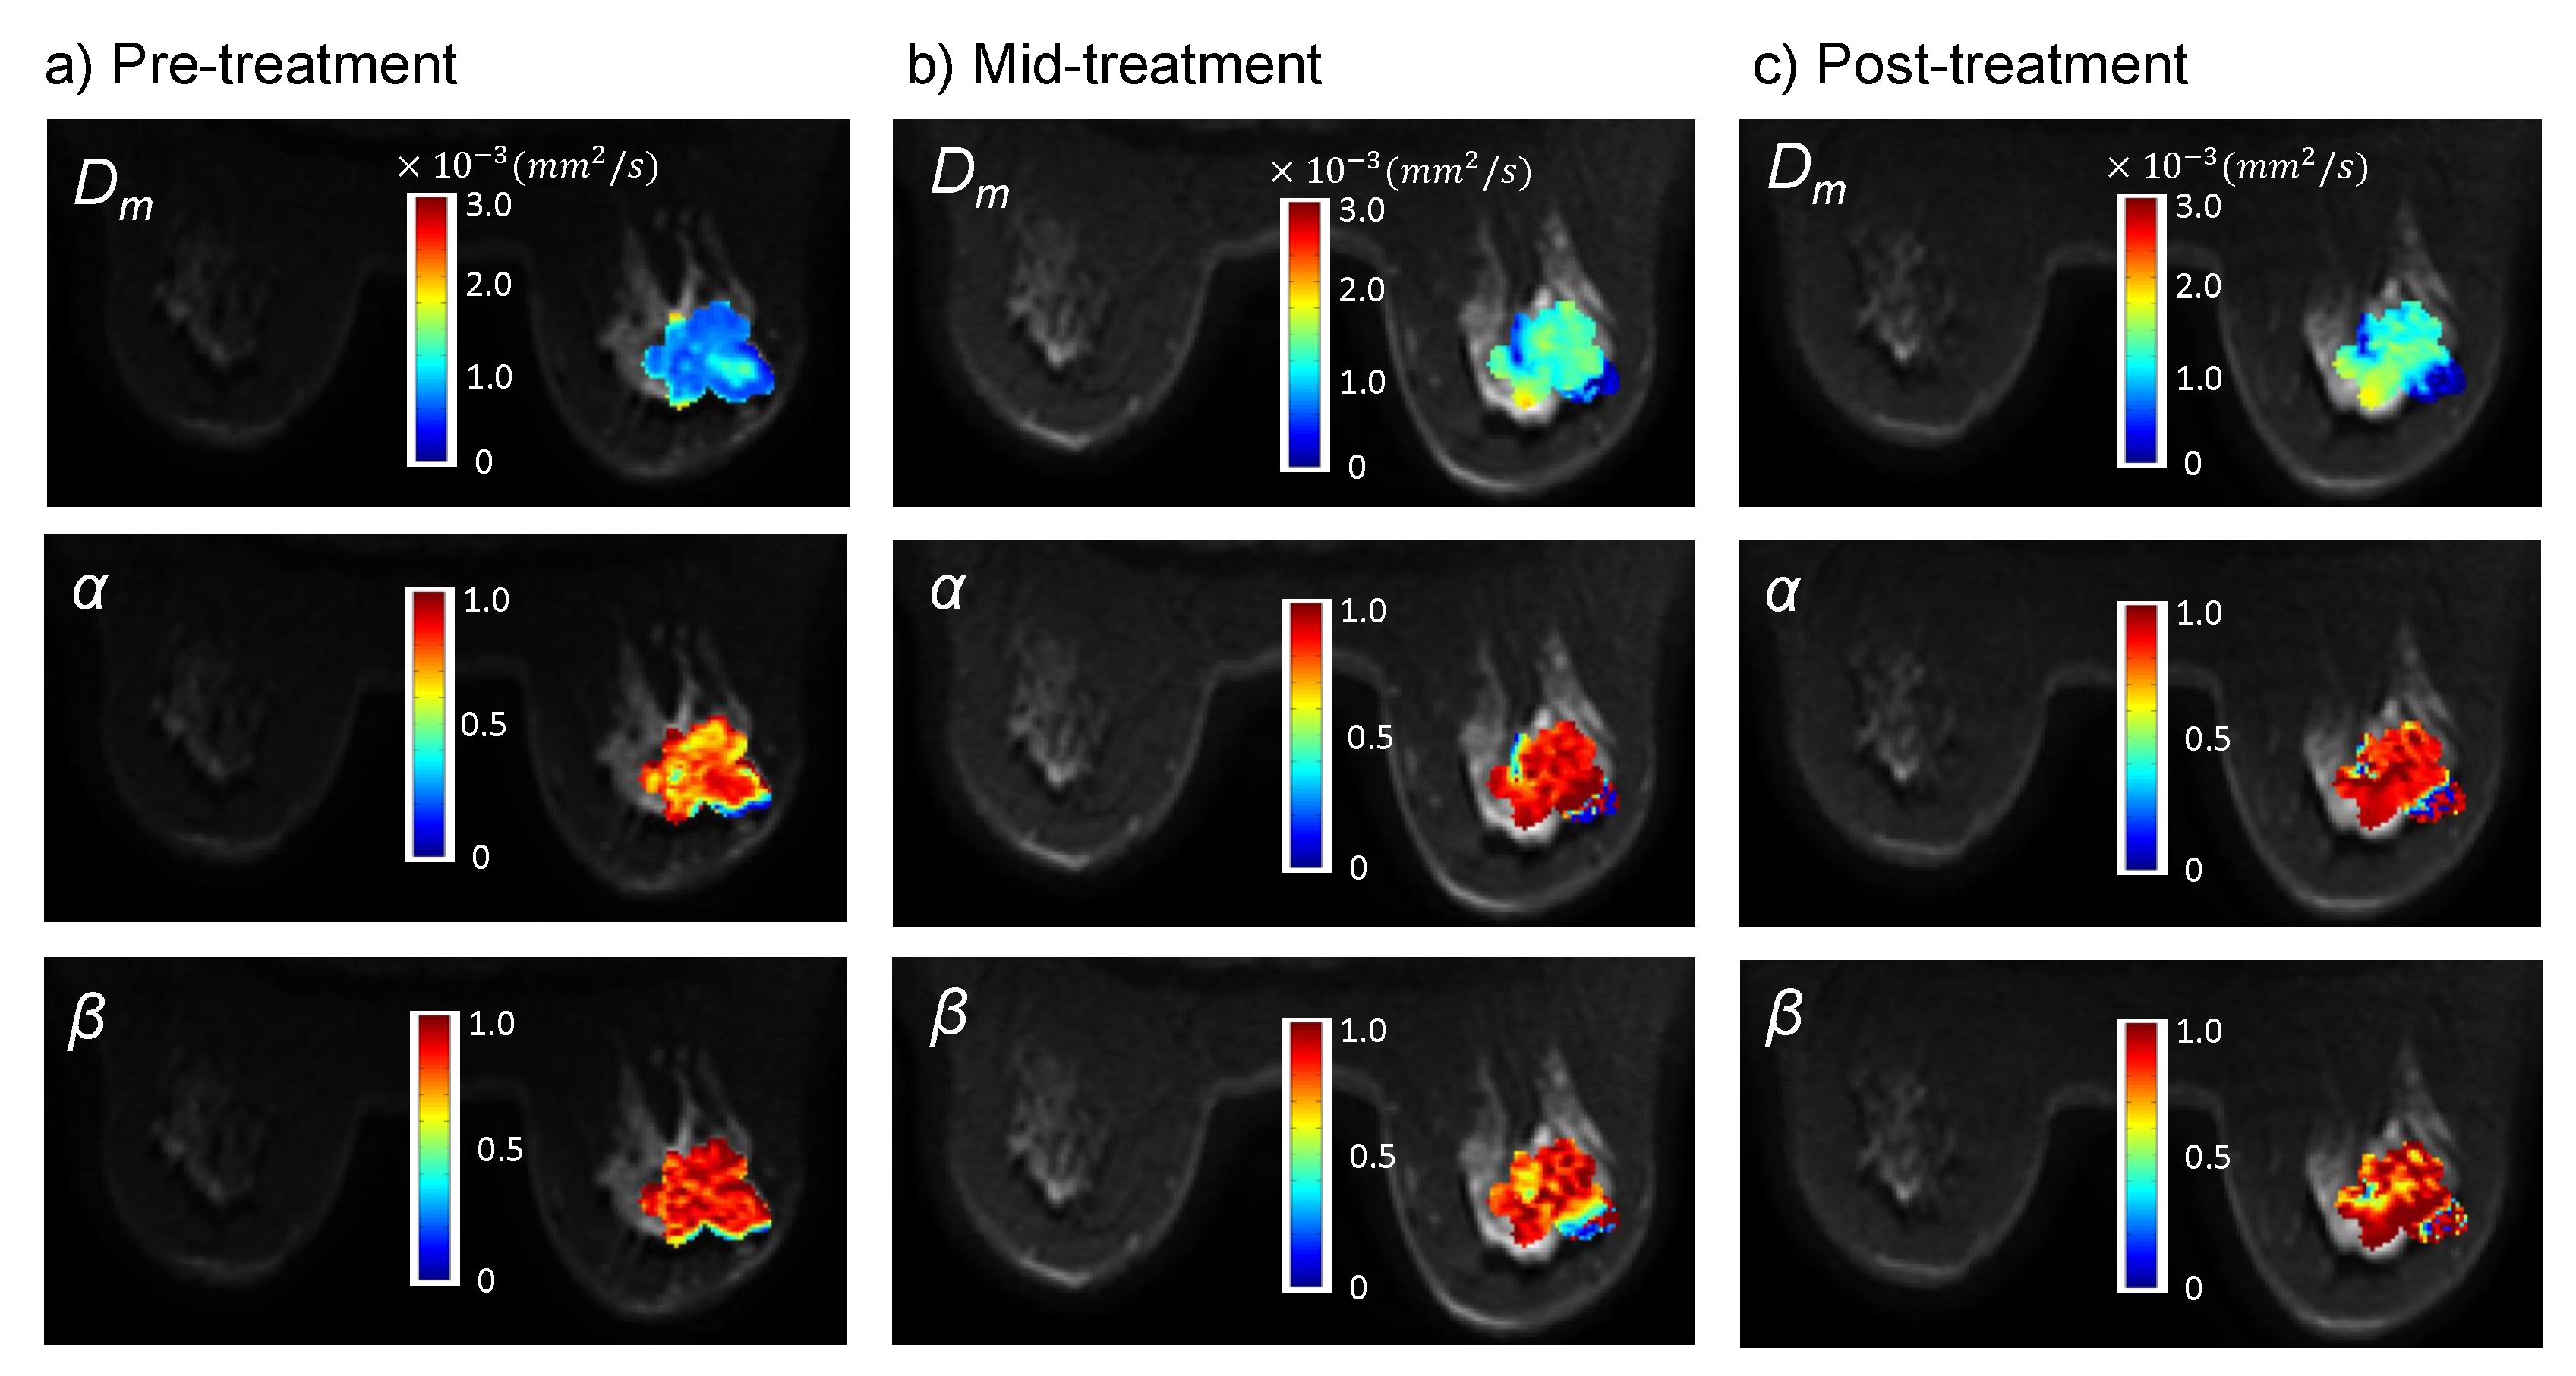
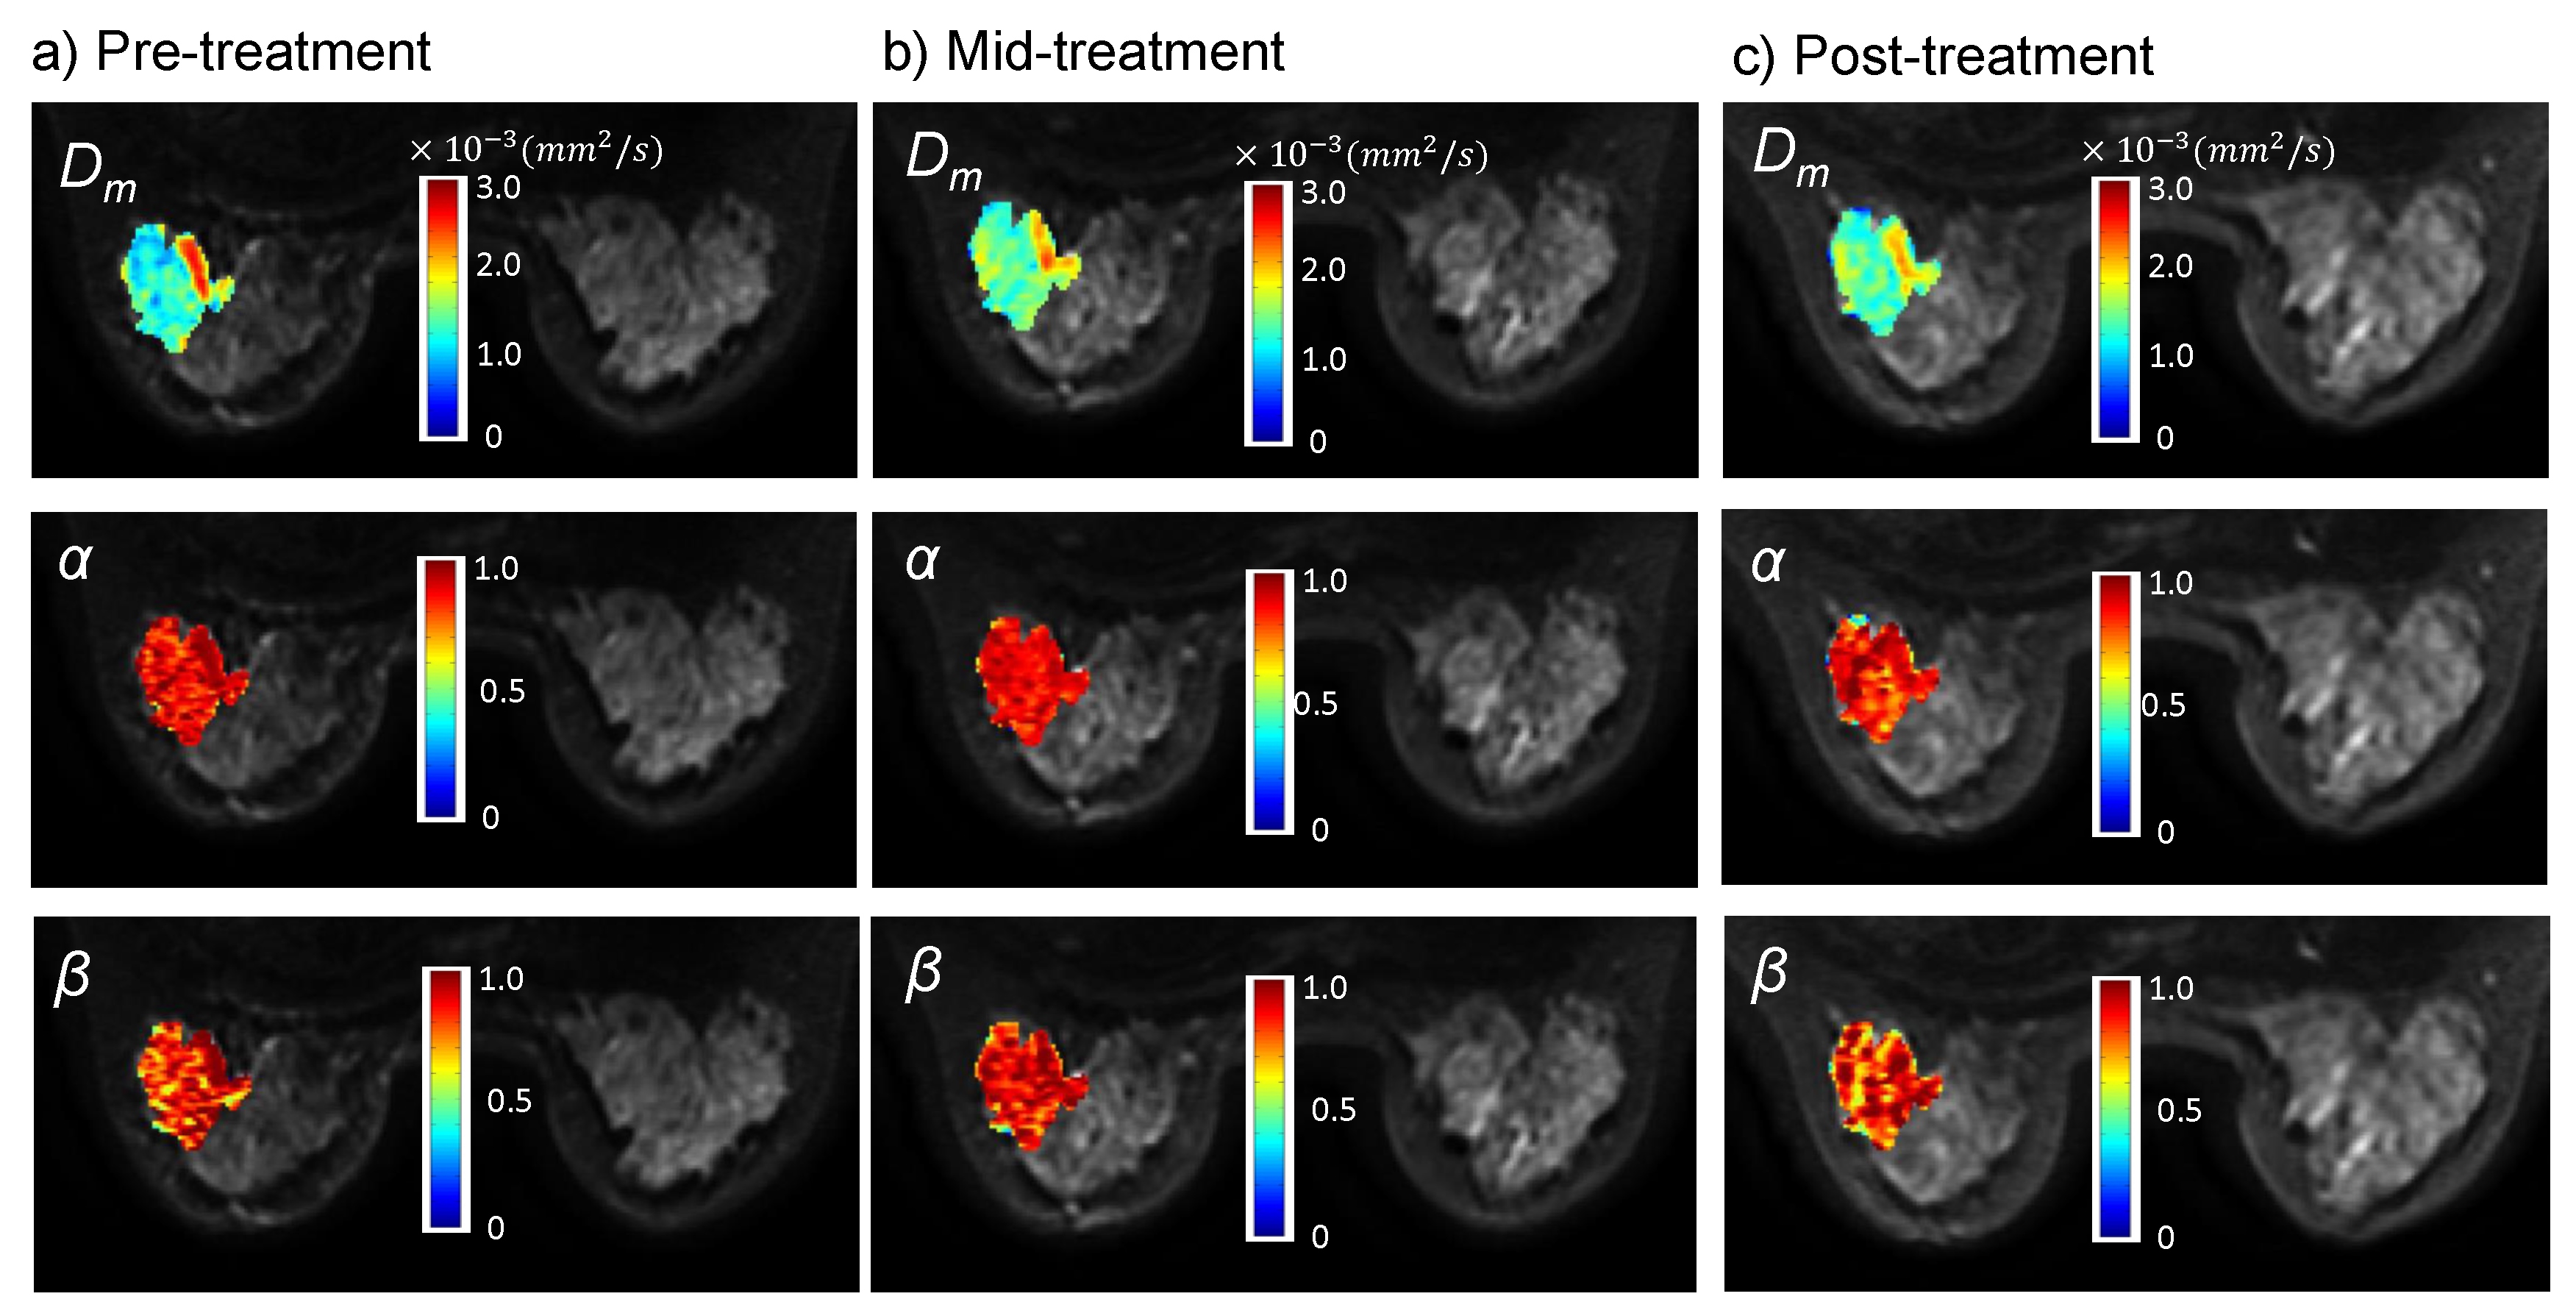
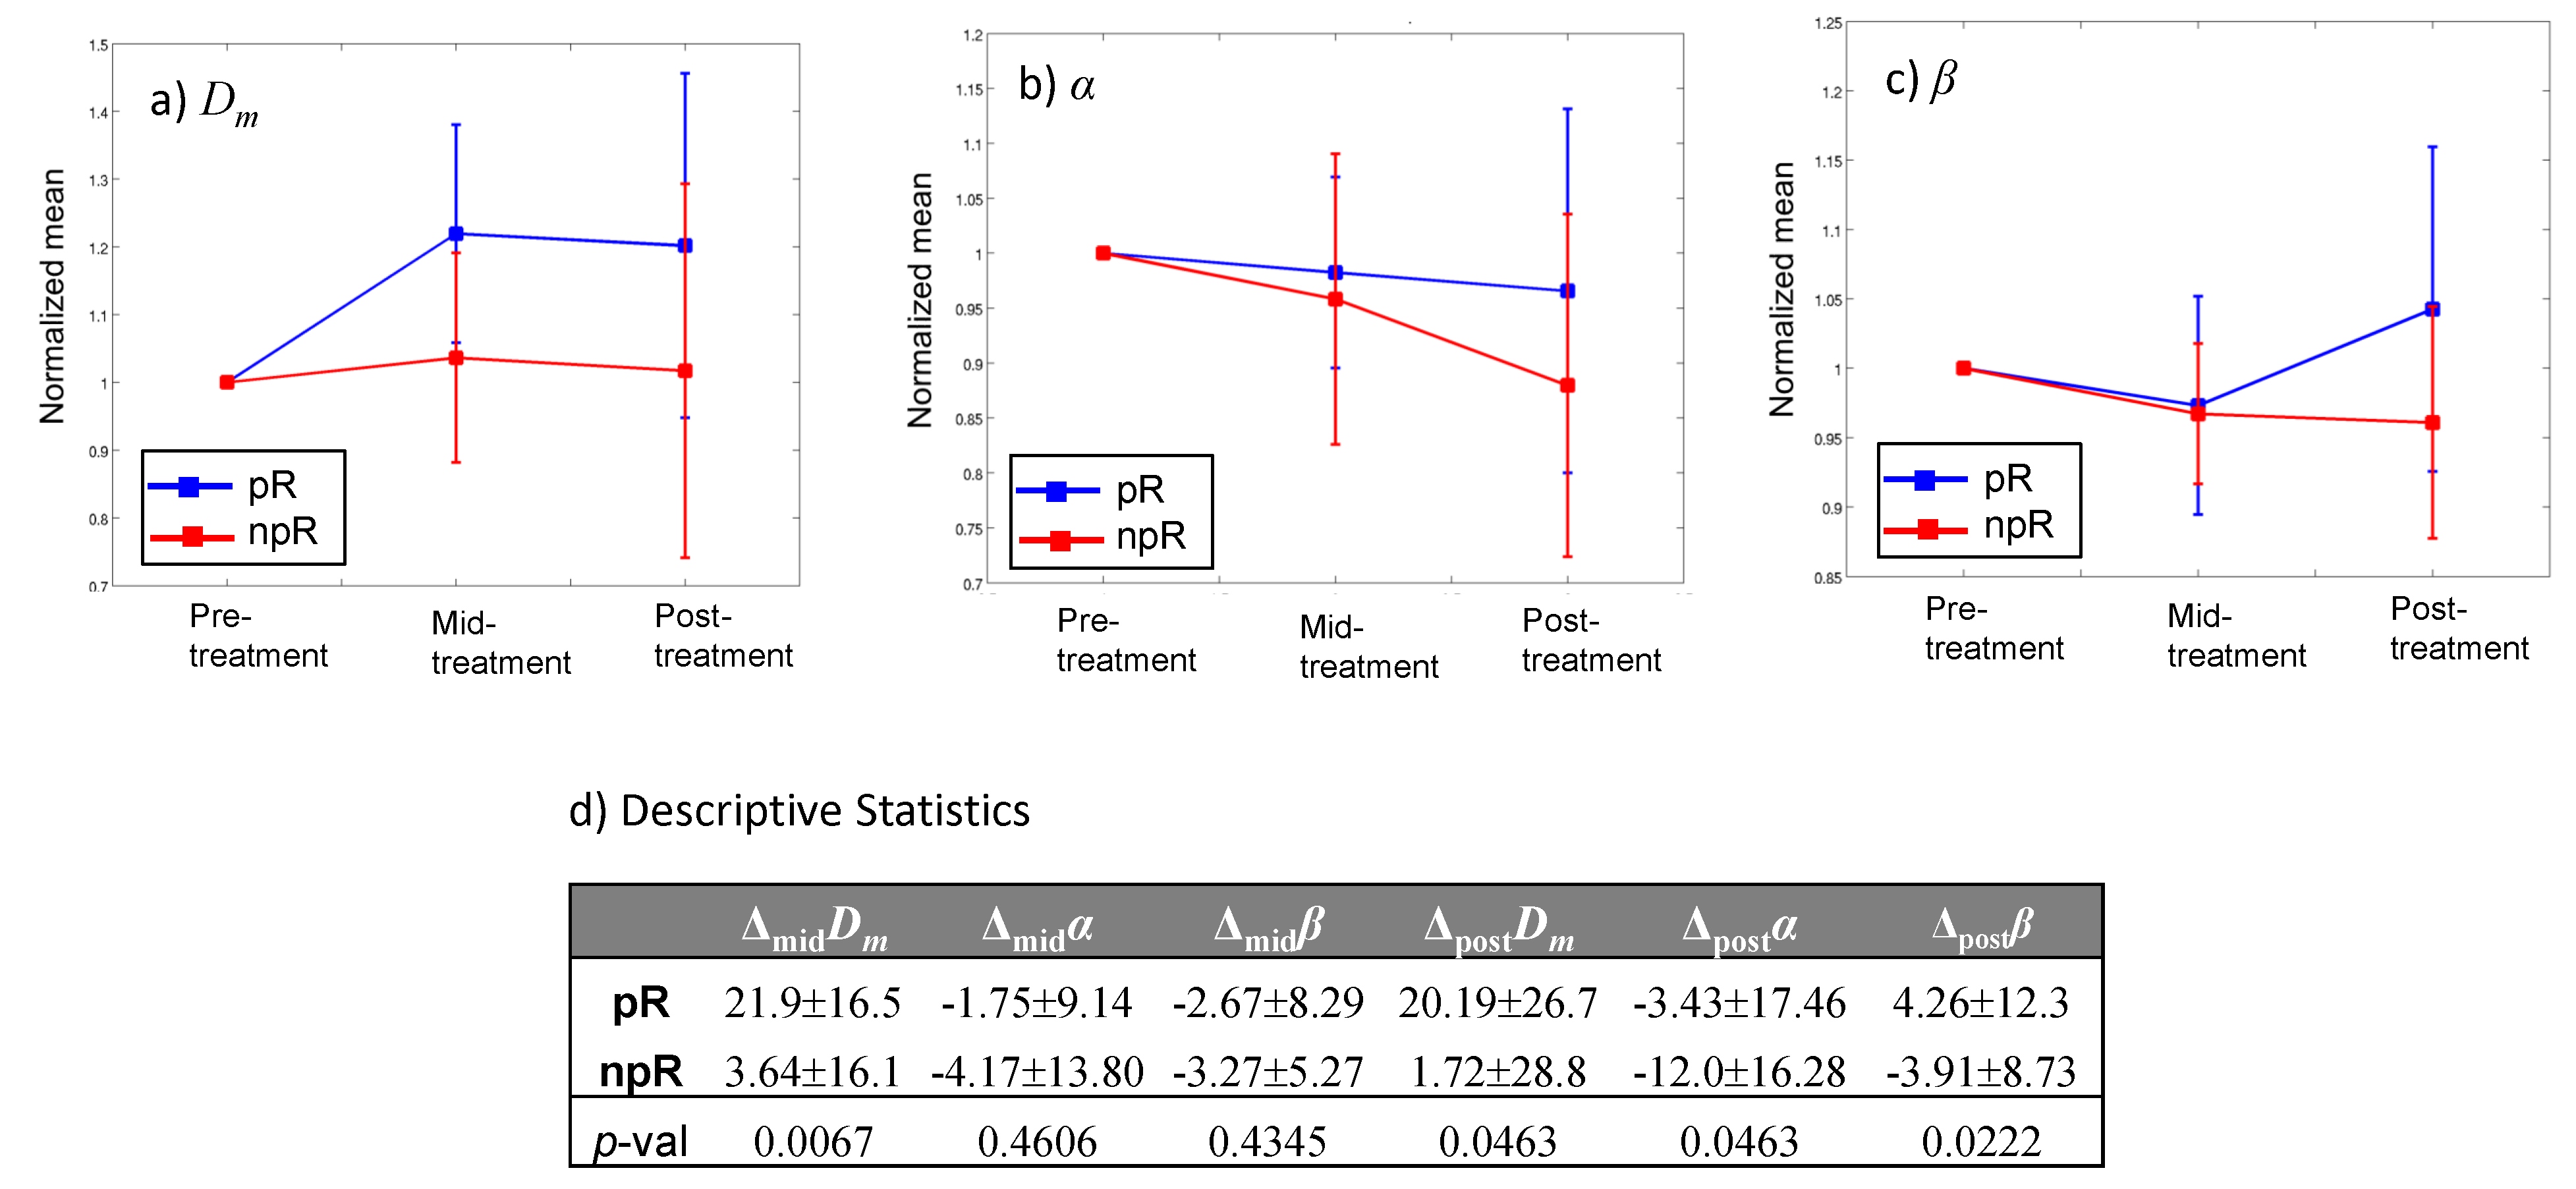
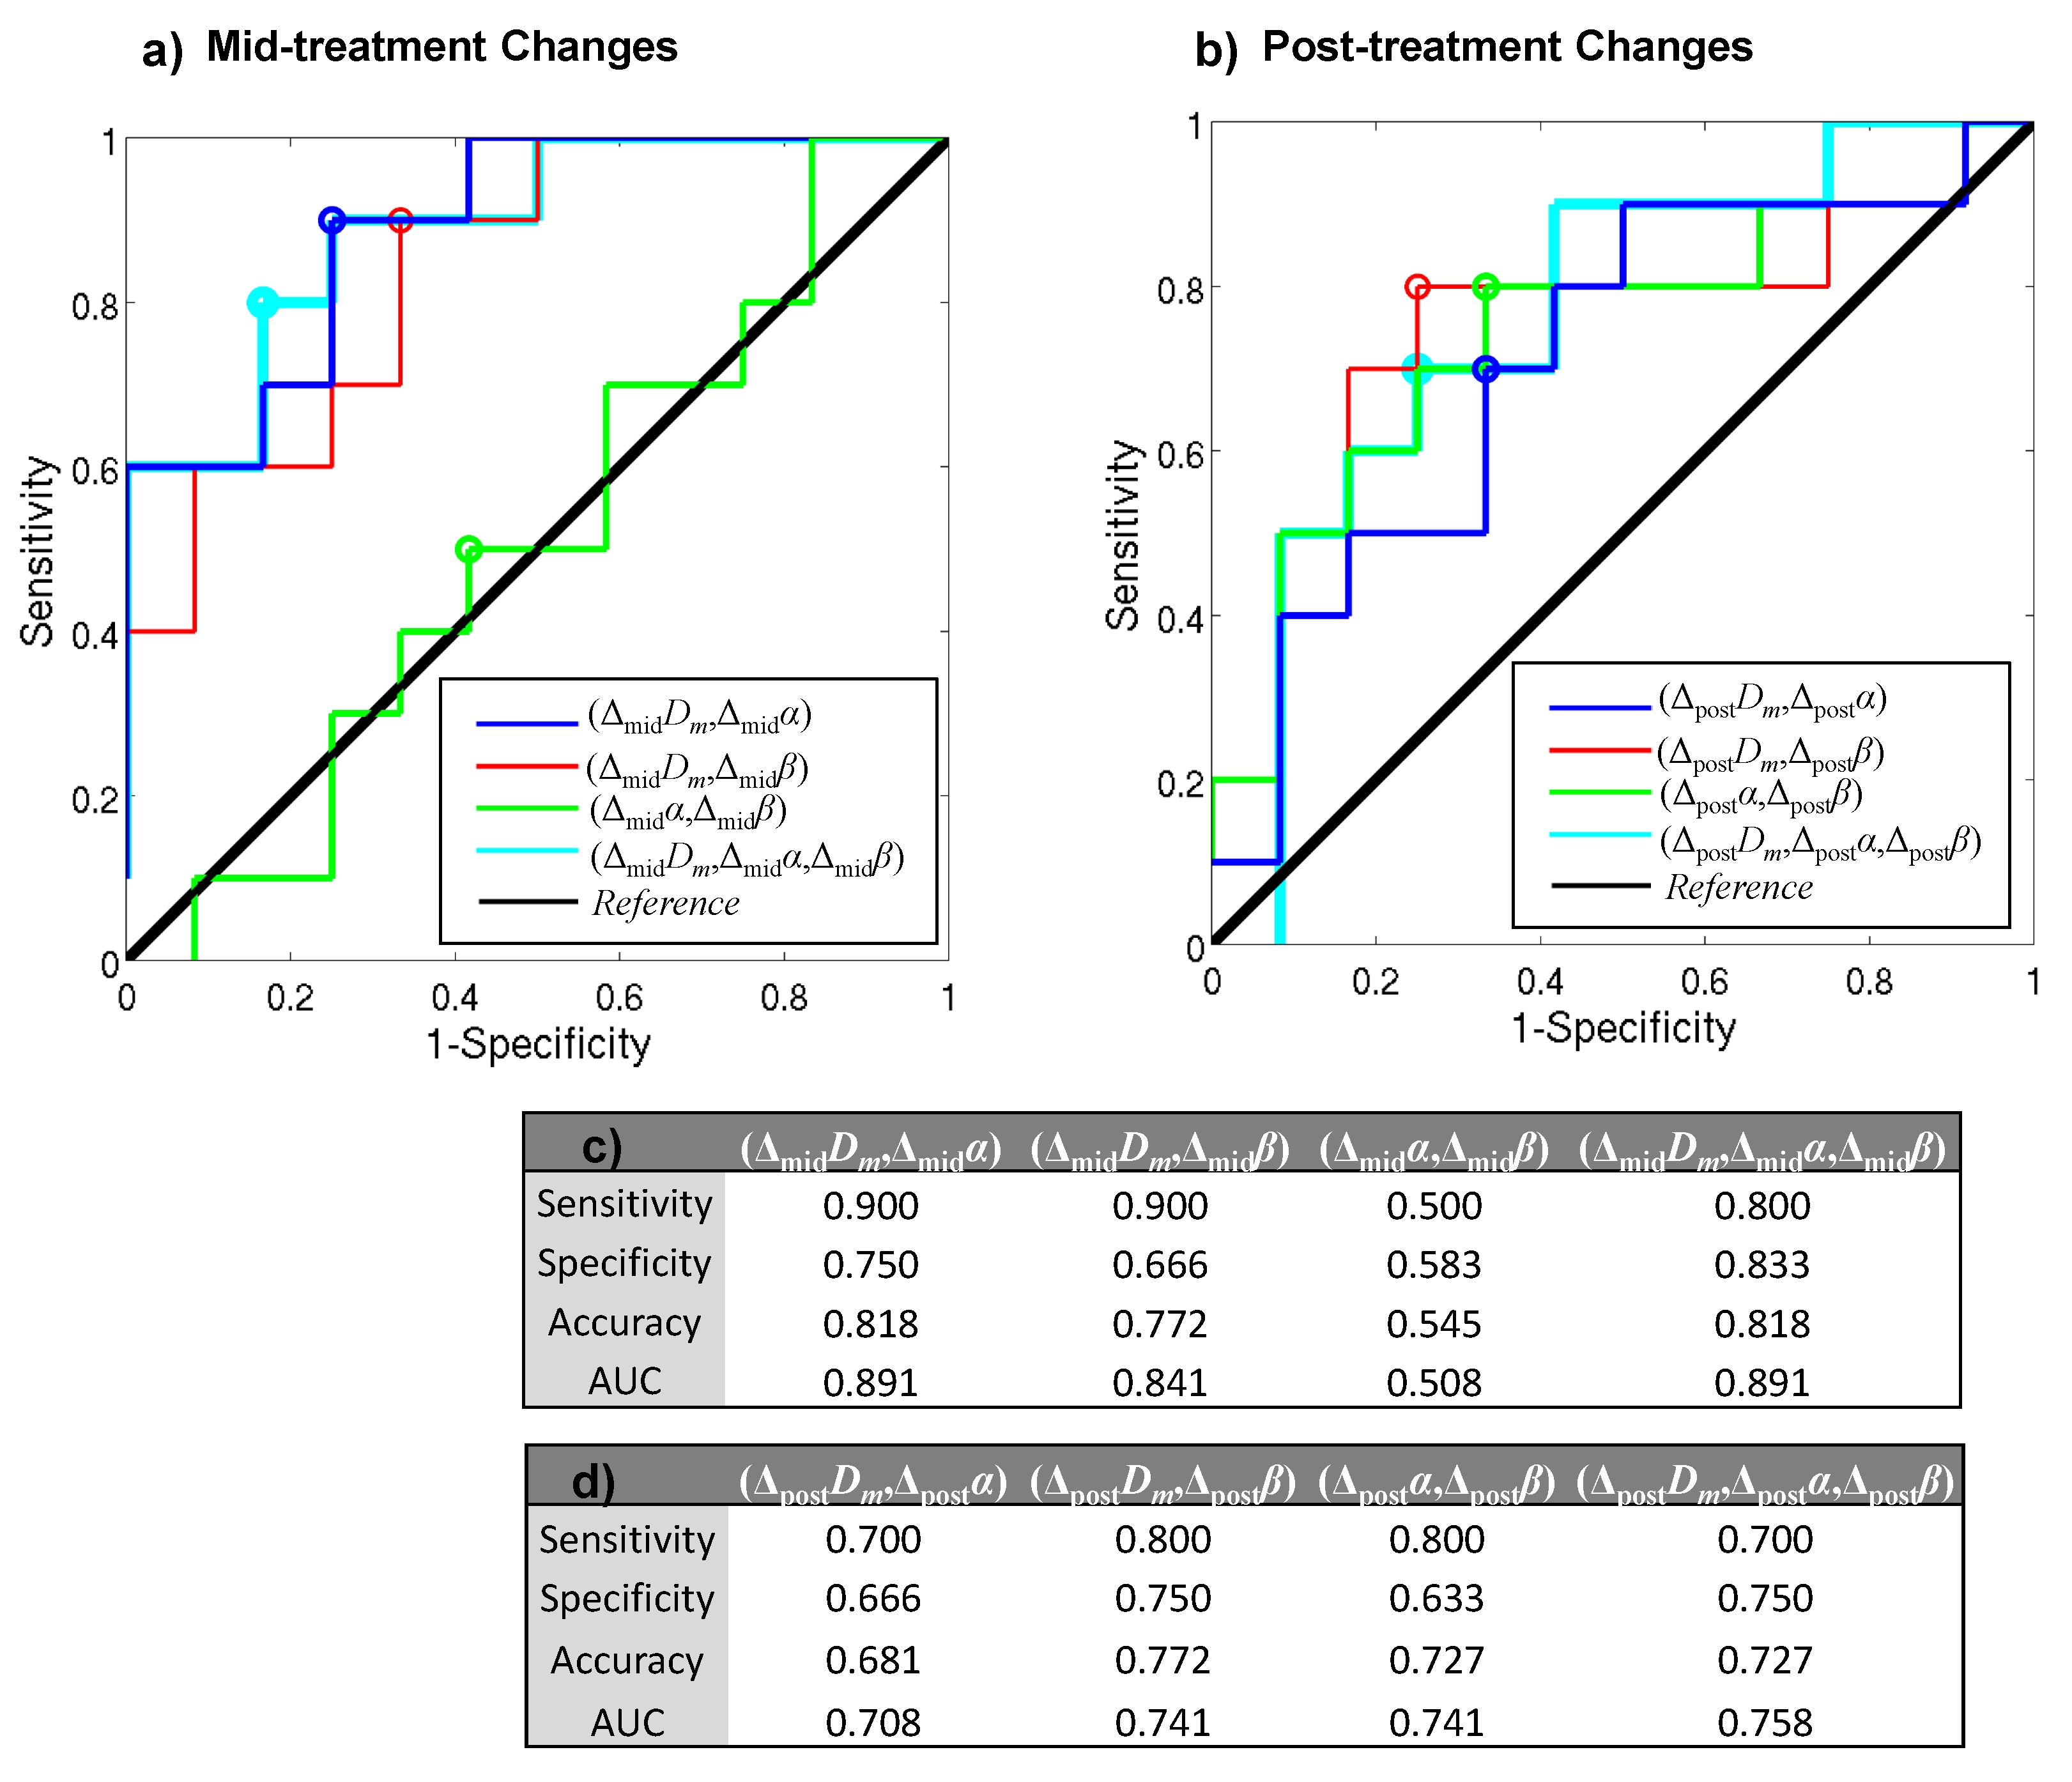
Figures 1a-1c show Dm, α, and β maps of a representative patient from the pR group throughout the course of treatment, while the results from a representative patient in the npR group are shown in Figure 2 with a similar layout. The CTRW parameters, specifically Dm and α, exhibited greater changes in the pR patient (Figures 1a-1c) than the npR patient (Figures 2a-2c) starting from the mid-treatment. As presented in Figure 3, the parameter changes in the pR group exhibited a larger increase (ΔmidDm, ΔpostDm, and Δpostβ) or smaller decrease (Δmidα, Δmidβ, and Δpostα) than the npR group. The changes in Dm at both mid-treatment and post-treatment, and in α or β at post-treatment were statistically significant (p-values<0.05) between the pR and npR groups (Figure 3d). For the mid-treatment changes (Figure 4c), the combination of (ΔmidDm,Δmidα) yielded the highest sensitivity (0.900; shared with (ΔmidDm,Δmidβ)), specificity (0.750), accuracy (0.818; shared with (ΔmidDm,Δmidα,Δmidβ)), and area-under-the-curve (AUC; 0.891; shared with (ΔmidDm,Δmidα,Δmidβ)). For the post-treatment changes (Figure 4d), the combination of (ΔpostDm,Δpostβ) yielded the highest sensitivity (0.800; shared with (Δpostα,Δpostβ)), specificity (0.750; shared with (ΔpostDm,Δpostα,Δpostβ)), accuracy (0.772), and AUC (0.741; shared with (Δpostα,Δpostβ)).Discussion and Conclusion:
We have demonstrated the prognostic value of CTRW parameters in predicting tumor response to treatment in breast cancer. Our results showed that the combination of the changes in Dm and α at mid-treatment provided the best performance in differentiating pR and npR patients, overperforming the post-treatment changes. Supporting the emerging role of high b-value non-Gaussian DWI in breast imaging, our findings is expected to stimulate additional studies towards a non-invasive, non-contrast, and radiation-safe diffusion imaging method for assessing response to treatment of breast cancer at an early time.Acknowledgements
This work was supported in part by the NIH (grant No. 1S10RR028898 and R01EB026716) and General Electric Healthcare China.References
- American Cancer Society. Cancer Facts & Figures 2017. Cancer Facts Fig 2017. 2017; 1.
- Charfare H, Limongelli S, Purushotham AD. Neoadjuvant chemotherapy in breast cancer. Br J Surg. 2005; 92(1):14-23.
- Gao W, Guo N, Dong T. Diffusion-weighted imaging in monitoring the pathological response to neoadjuvant chemotherapy in patients with breast cancer: a meta-analysis. World J of Surg Oncol. 2018; 16(1):145.
- Virostko J, Hainline A, Kang H, et al. Dynamic contrast-enhanced magnetic resonance imaging and diffusion-weighted magnetic resonance imaging for predicting the response of locally advanced breast cancer to neoadjuvant therapy: a meta-analysis. J Med Imaging (Bellingham). 2018; 5(1):01101.
- Kim Y, Kim SH, Lee HW, et al. Intravoxel incoherent motion diffusion-weighted MRI for predicting response to neoadjuvant chemotherapy in breast cancer. Magn Reson Imaging. 2018; 48:27-33.
- Che S, Zhao X, Ou Y, et al. Role of the intravoxel incoherent motion diffusion weighted imaging in the pre-treatment prediction and early response monitoring to neoadjuvant chemotherapy in locally advanced breast cancer. Medicine (Baltimore). 2016; 95(4):e2420
- Cho GY, Gennaro L, Sutton EJ, et al. Intravoxel incoherent motion (IVIM) histogram biomarkers for prediction of neoadjuvant treatment response in breast cancer patients. Eur J Radiol Open. 2017; 4:101-107.
- Karaman MM, Sui Y, Wang H, et al. Differentiating low- and high-grade pediatric brain tumors using a continuous-time random-walk diffusion model at high b-values. Magn Reson Med. 2016;76(4):1149-1157.
- Tang L, Sui Y, Zhong Z, et al. Non-Gaussian diffusion imaging with a fractional order calculus model to predict response of gastrointestinal stromal tumor to second-line sunitinib therapy. Magn Reson Med. 2018; 79:1399-1406.
- Ogston KN, Miller ID, Payne S, et al. A new histological grading system to assess response of breast cancers to primary chemotherapy: prognostic significance and survival. Breast 2003; 12:320-327.
- Thirion JP. Image matching as a diffusion process: an analogy with maxwell's demons. Med Image Anal. 1998; 2(3):243-260.
- Kroon DJ and Slump CH. MRI modality transformation in demon registration. IEEE International Symposium on Biomedical Imaging: From Nano to Macro. 2009; 1-2:963-966.
Figures