0503
Dynamic OE-MRI Mapping of Lung Parenchymal Radiotherapy Effects in Non-Small Cell Lung Cancer Patients1Quantitative Biomedical Imaging Laboratory, University of Manchester, Manchester, United Kingdom, 2Division of Cancer Sciences, University of Manchester, Manchester, United Kingdom, 3The Christie NHS Foundation Trust, Manchester, United Kingdom, 4Division of Neuroscience and Experimental Psychology, University of Manchester, Manchester, United Kingdom, 5Bioxydyn Limited, Manchester, United Kingdom
Synopsis
Radiation induced lung disease (RILD) can occur following thoracic irradiation, chemotherapy and immunotherapy in lung cancer patients, manifesting as inflammation, radiation pneumonitis or fibrosis. Oxygen Enhanced (OE)-MRI provides spatial information on oxygen delivery to lung tissue. Five non-small cell lung cancer patients underwent OE-MRI pre and post radiotherapy. Statistically significant changes were measured between pre and post radiotherapy scans in both the contralateral and ipsilateral lungs. These findings indicate that OE-MRI can assess changes in lung function following radiotherapy, with potential application for personalised therapy and reduction of toxicity.
Introduction
Radiation induced lung disease (RILD) can occur following thoracic irradiation and chemotherapy during lung cancer treatment and presents as inflammation, radiation pneumonitis and fibrosis. The volume of lung irradiated and the delivered radiation dose (both of which depend on tumour location, size and stage) can influence the degree of injury1. Methods used to image lung function and structure in healthcare either contribute additional radiation dose or have limited availability2. The advent of hybrid MR-Linac systems further motivates the development of improved MRI methods for assessing radiation damage during the repeat visits of fractionated radiotherapy treatment (RT)2.
Oxygen enhanced (OE)-MRI is a non-ionising and non-invasive method providing spatial information on oxygen delivery to lung tissue3. In OE-MRI, inhaled oxygen dissolves in the blood plasma and interstitial spaces of the lung, increasing the spin-lattice relaxation rate (R1) in proportion to the local change in partial pressure of oxygen (∆PO2)4. This study is the first to investigate the utility of dynamic OE-MRI to measure changes in lung function following radiotherapy in lung cancer patients.
Methods
Five patients with non-small cell lung cancer (NSCLC) underwent dynamic OE-MRI imaging pre-radiotherapy and had a second scan at day (19±4 days). Total doses of 45±8 Gy were administered by the time of the second scan (labelled post RT below), as part of sequential chemo-radiotherapy. Radiotherapy prescribed dose plans were 55 Gy in 20 (N=3) or 60-66 Gy in 30-33 (N=2) fractions. All MRI data were acquired free-breathing on a 1.5 T MR scanner (Philips Achieva, Philips Medical Systems, Best, Netherlands) using Q Body (OE-MRI) and Sense XL Torso coils (anatomical scans). All participants provided written informed consent and the study was conducted following ethical approval.
R1 was calculated using a series of coronal inversion recovery (IR) turbo field echo acquisitions (TR 2.1 ms, TE 0.496 ms, 6° flip angle, number of excitations = 5, TI = 10, 50, 300, 1100, 2000, 5000 ms) using a non-selective inversion and centric k-space ordering. Dynamic images were acquired with a TI of 1100 ms and temporal resolution of 10 s, enabling full magnetisation recovery between volumes. Twelve measurements were acquired while breathing medical air (21% oxygen; (15 l/min) to determine native R1, before switching to 100% for 66 measurements and then 12 final measurements on medical air. Gases were delivered via a non-rebreathing Hudson mask. Maps of baseline T1, maximum changes in PO2 from 21-100% oxygen (ΔPO2max), derived from fitting an exponential uptake function to the ΔPO2(t), and the maximum percentage signal difference between 21-100% oxygen (max%diff) were generated3. Oxygen relaxivity constant of r = 2.49x10⁻⁴ s-1 mmHg-1 was used to calculate ΔPO25.
Lung volumes were manually segmented on the pre and post radiotherapy images for both lungs in Matlab R2014a (Mathworks, USA), excluding the gross tumour volume (GTV; outlined by an experienced radiation oncologist on a reference radiotherapy planning scan) and large vessels. Lung volumes were propagated to native (baseline) T1, ΔPO2max and max%diff maps and median parameter values were quantified per lung. Only enhancing voxels were included. Voxels with T1 calculation fitting errors were discarded from the analysis. A two-tailed paired t-test was used to test for significance between pre and post radiotherapy measurements.
Results
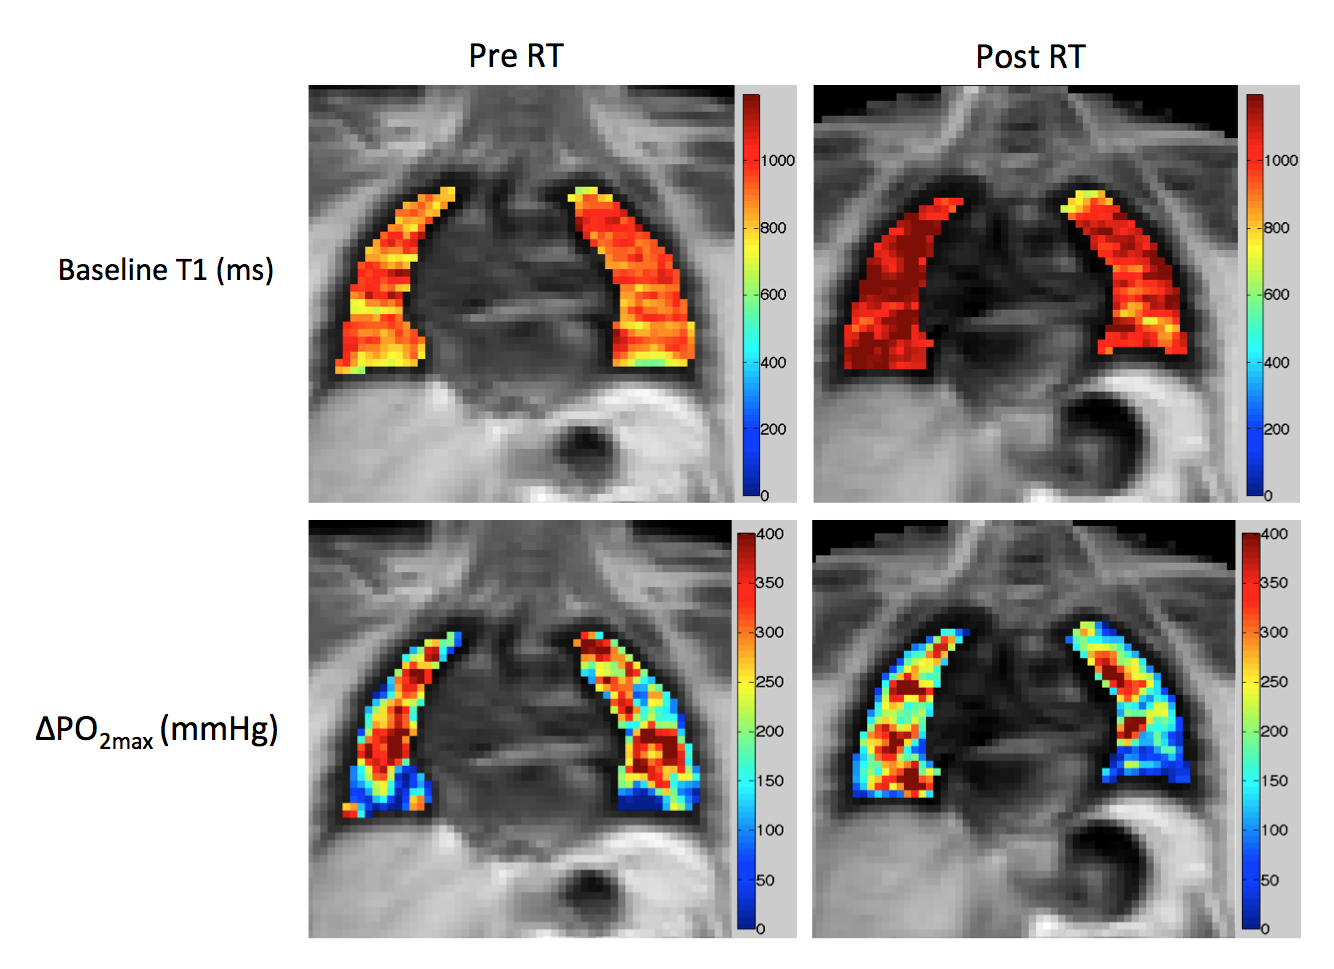
Figure 1 shows example baseline T1 and ΔPO2max maps pre and post radiotherapy in a patient with a T3N2M0 tumour in the right lung (tumour not outlined).
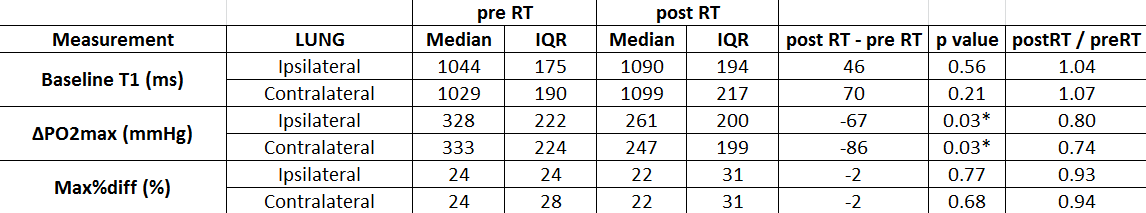
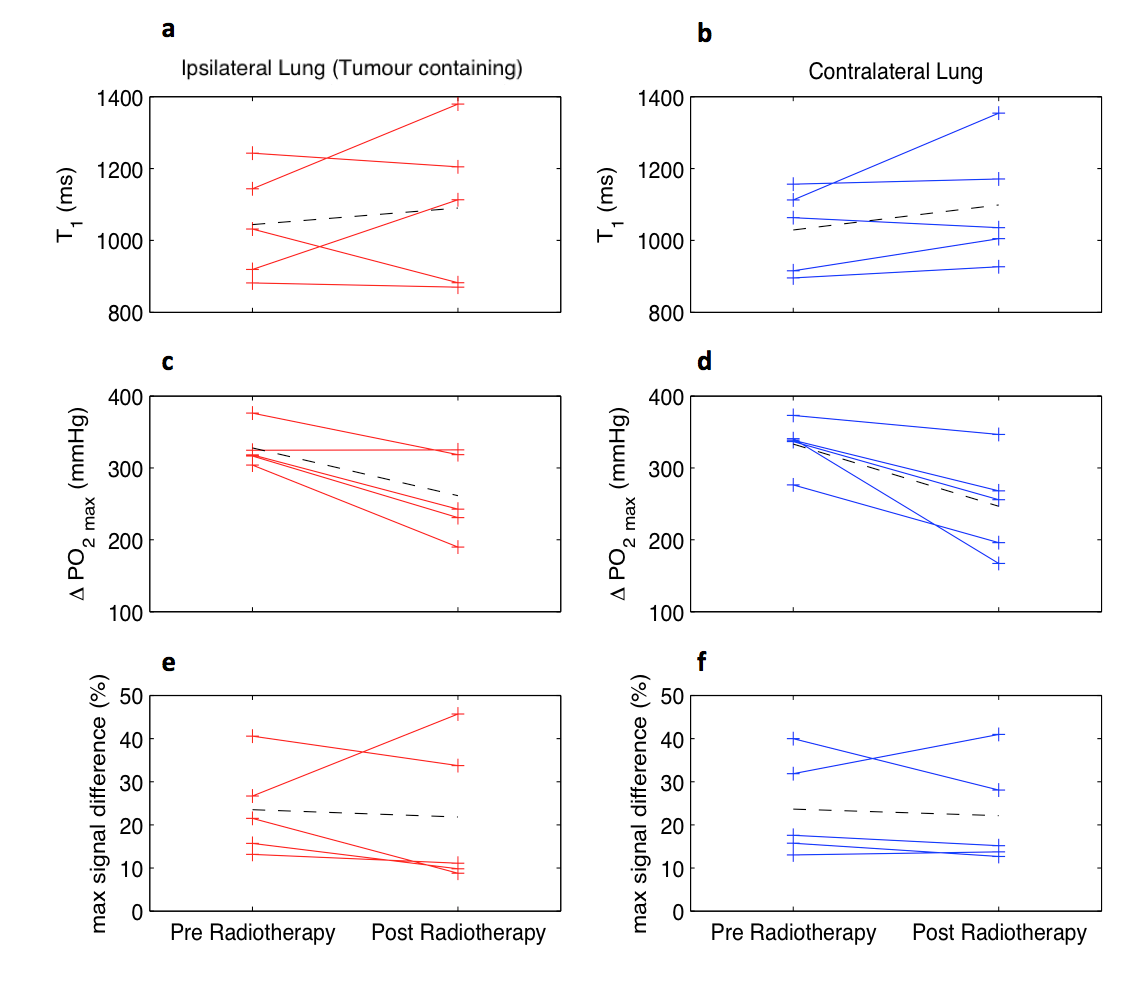
The median baseline T1, ΔPO2max and max%diff results for the group of 5 patients for the ipsilateral (tumour containing) and contralateral lungs, pre and post radiotherapy are shown in table 1 and figures 2.a-f respectively.
Statistically significant reduction in ΔPO2max was measured following radiotherapy in the ipsilateral and contralateral lungs (p=0.03 for both). No other changes reached statistical significance.
Discussion
Significant reductions in ΔPO2max were measured in ipsilateral and contralateral lungs in 5 NSCLC patients treated with radiotherapy. These changes could be the result of radiation-induced fibrosis in the lung tissue, leading to reduced lung function6. The observation of changes in ΔPO2max but not in max%diff indicates the importance of R1-based quantification in assessing oxygen-induced changes in the lung. Additional work is required to investigate whether the changes detected correlate with radiotherapy or chemotherapy dose and/or delivery, which are known causes of parenchymal lung inflammation6.Conclusion
These findings suggest that quantitative dynamic OE-MRI can detect lung parenchymal changes following radiotherapy. Serial OE-MRI may allow differential sparing of healthy lung tissue to reduce RILD in lung cancer patients receiving combination treatments (radiotherapy, chemotherapy and immunotherapy).Acknowledgements
We thank David Higgins of Philips Healthcare for assistance in protocol development and for access to research protocols. This work was supported by CRUK grants (C8742/A18097; Cancer Imaging Centre in Cambridge & Manchester, co-funded by the EPSRC) and (C19221/A22746; personal fellowship to JPBO’C). Michael Dubec is supported by PhD funding from the MRC.References
- Yo Choi et al, Effects of Radiation Therapy on the Lung: Radiologic Appearances and Differential Diagnosis. RadioGraphics 2004; 24:985–99.
- Bainbridge, H et al. Magnetic resonance imaging in precision radiation therapy for lung cancer. Transl Lung Cancer Res. 2017 Dec; 6(6): 689–707.
- Martini, K., Gygax, C. M., Benden, C., Morgan, A. R., Parker, G. J. M., & Frauenfelder, T. (2018). Volumetric dynamic oxygen-enhanced MRI (OE-MRI): comparison with CT Brody score and lung function in cystic fibrosis patients. European Radiology, 28(10), 4037–4047.
- Morgan, A. R., Parker, G. J. M., Roberts, C., Buonaccorsi, G. A., Maguire, N. C., Hubbard Cristinacce, P. L., Nordenmark, L. H. (2014). Feasibility assessment of using oxygen-enhanced magnetic resonance imaging for evaluating the effect of pharmacological treatment in COPD. European Journal of Radiology, 83(11), 2093–2101.
- Zaharchuk, G., Busse, R. F., Rosenthal, G., Manley, G. T., Glenn, O. A., & Dillon, W. P. (2006). Noninvasive oxygen partial pressure measurement of human body fluids in vivo using magnetic resonance imaging. Academic Radiology, 13(8), 1016–1024.
- Mirsadraee S et al. T1 characteristics of interstitial pulmonary fibrosis on 3T MRI – a predictor of early interstitial change? Quant Imaging Med Surg 2016;6(1):42-49.
Figures