0502
Dynamic Oxygen-Enhanced MRI (dOE-MRI) with group ICA detects increased oxygenation in murine tumours treated with VEGF-ablation therapy1Physics & Astronomy, University of British Columbia, Vancouver, BC, Canada, 2Oncology, BC Cancer Research Centre, Vancouver, BC, Canada, 3UBC MRI Research Centre, Vancouver, BC, Canada, 4BC Cancer Research Centre, Vancouver, BC, Canada, 5University of British Columbia, Vancouver, BC, Canada
Synopsis
Tumours treated with VEGF ablation sustain changes to their vasculature, which can result in tissue oxygenation changes. This work uses dynamic oxygen enhanced MRI (dOE-MRI) to assess oxygenation of murine SCCVII tumours treated with B20-4.1.1 (murine anti-VEGF antibody) relative to controls. T1-weighted parameter maps and a modified ICA quantitative analysis technique, groupICA, describe an increase in B20-treated tumour oxygenation.
Introduction
Dynamic oxygen enhanced MRI (dOE-MRI) has recently been proposed to assess tumour oxygenation in vivo using MRI [1]. This technique measures T1-weighted changes in tissues in response to a cycling oxygen challenge, with the responsive signals detected using independent component analysis (ICA) [2]. ICA is a blind-source separation algorithm that separates multiple signal sources by maximizing statistical independence of individual components [3]. However, because single-subject ICA needs to be applied individually, comparison of extracted components and weighting factor maps from different subjects is complicated by differences in scaling factors. GroupICA permits cohort analysis on spatially concatenated MRI data from multiple subjects [4].
Bevacizumab (Avastin) is a monoclonal antibody that neutralizes vascular endothelial growth factor (VEGF), acting as an anti-angiogenic agent used in the treatment of cancer. VEGF ablation has been shown to at least temporarily reduce vascular permeability and increase tumour oxygenation in some models [5]. Here we hypothesized that dOE-MRI with groupICA can detect VEGF ablation-induced changes to oxygenation of SCCVII tumours.
Methods
Animals: Seventeen NRG (NOD rag gamma) mice were implanted with SCCVII murine squamous cell carcinoma tumors (5x10⁵ cells in 50 μl serum-free media; cells provided by Dr. J. Evans) in the dorsal subcutaneous region. Tumours were imaged when their largest diameters reached approximately 8-10 mm. Mice (n=8) were treated with 5mg/kg mouse anti-VEGF antibody (B20-4.1.1.,Genentech) 48 hours prior to imaging.
MRI: Imaging was performed using a 7T scanner (Bruker Biospec) with a transmit quadrature volume coil and a custom built surface receive coil. A T1 map was acquired using the Look-Locker method. OE-MRI scans were acquired with 90 repetitions using a 2D FLASH based sequence with TE/TR=2.67/133, flip angle α=40, 16 slices each 1mm thick, FOV of 3.84cmx2.16 cm, encoding matrix of 128x72, and a temporal resolution of 9.6s for a total scan time of about 14 minutes. Tumour ROIs were outlined on a RARE image (TE/TR=10.7/4250ms).
Oxygen Challenge: Mice were anaesthetized using 1.5-2.0% isoflurane. Breathing gas was alternated between medical air and 100% oxygen every 2 minutes using a 3-channel gas mixer (CWE, Philadelphia, USA) for a total of 3 air-oxygen-air cycles.
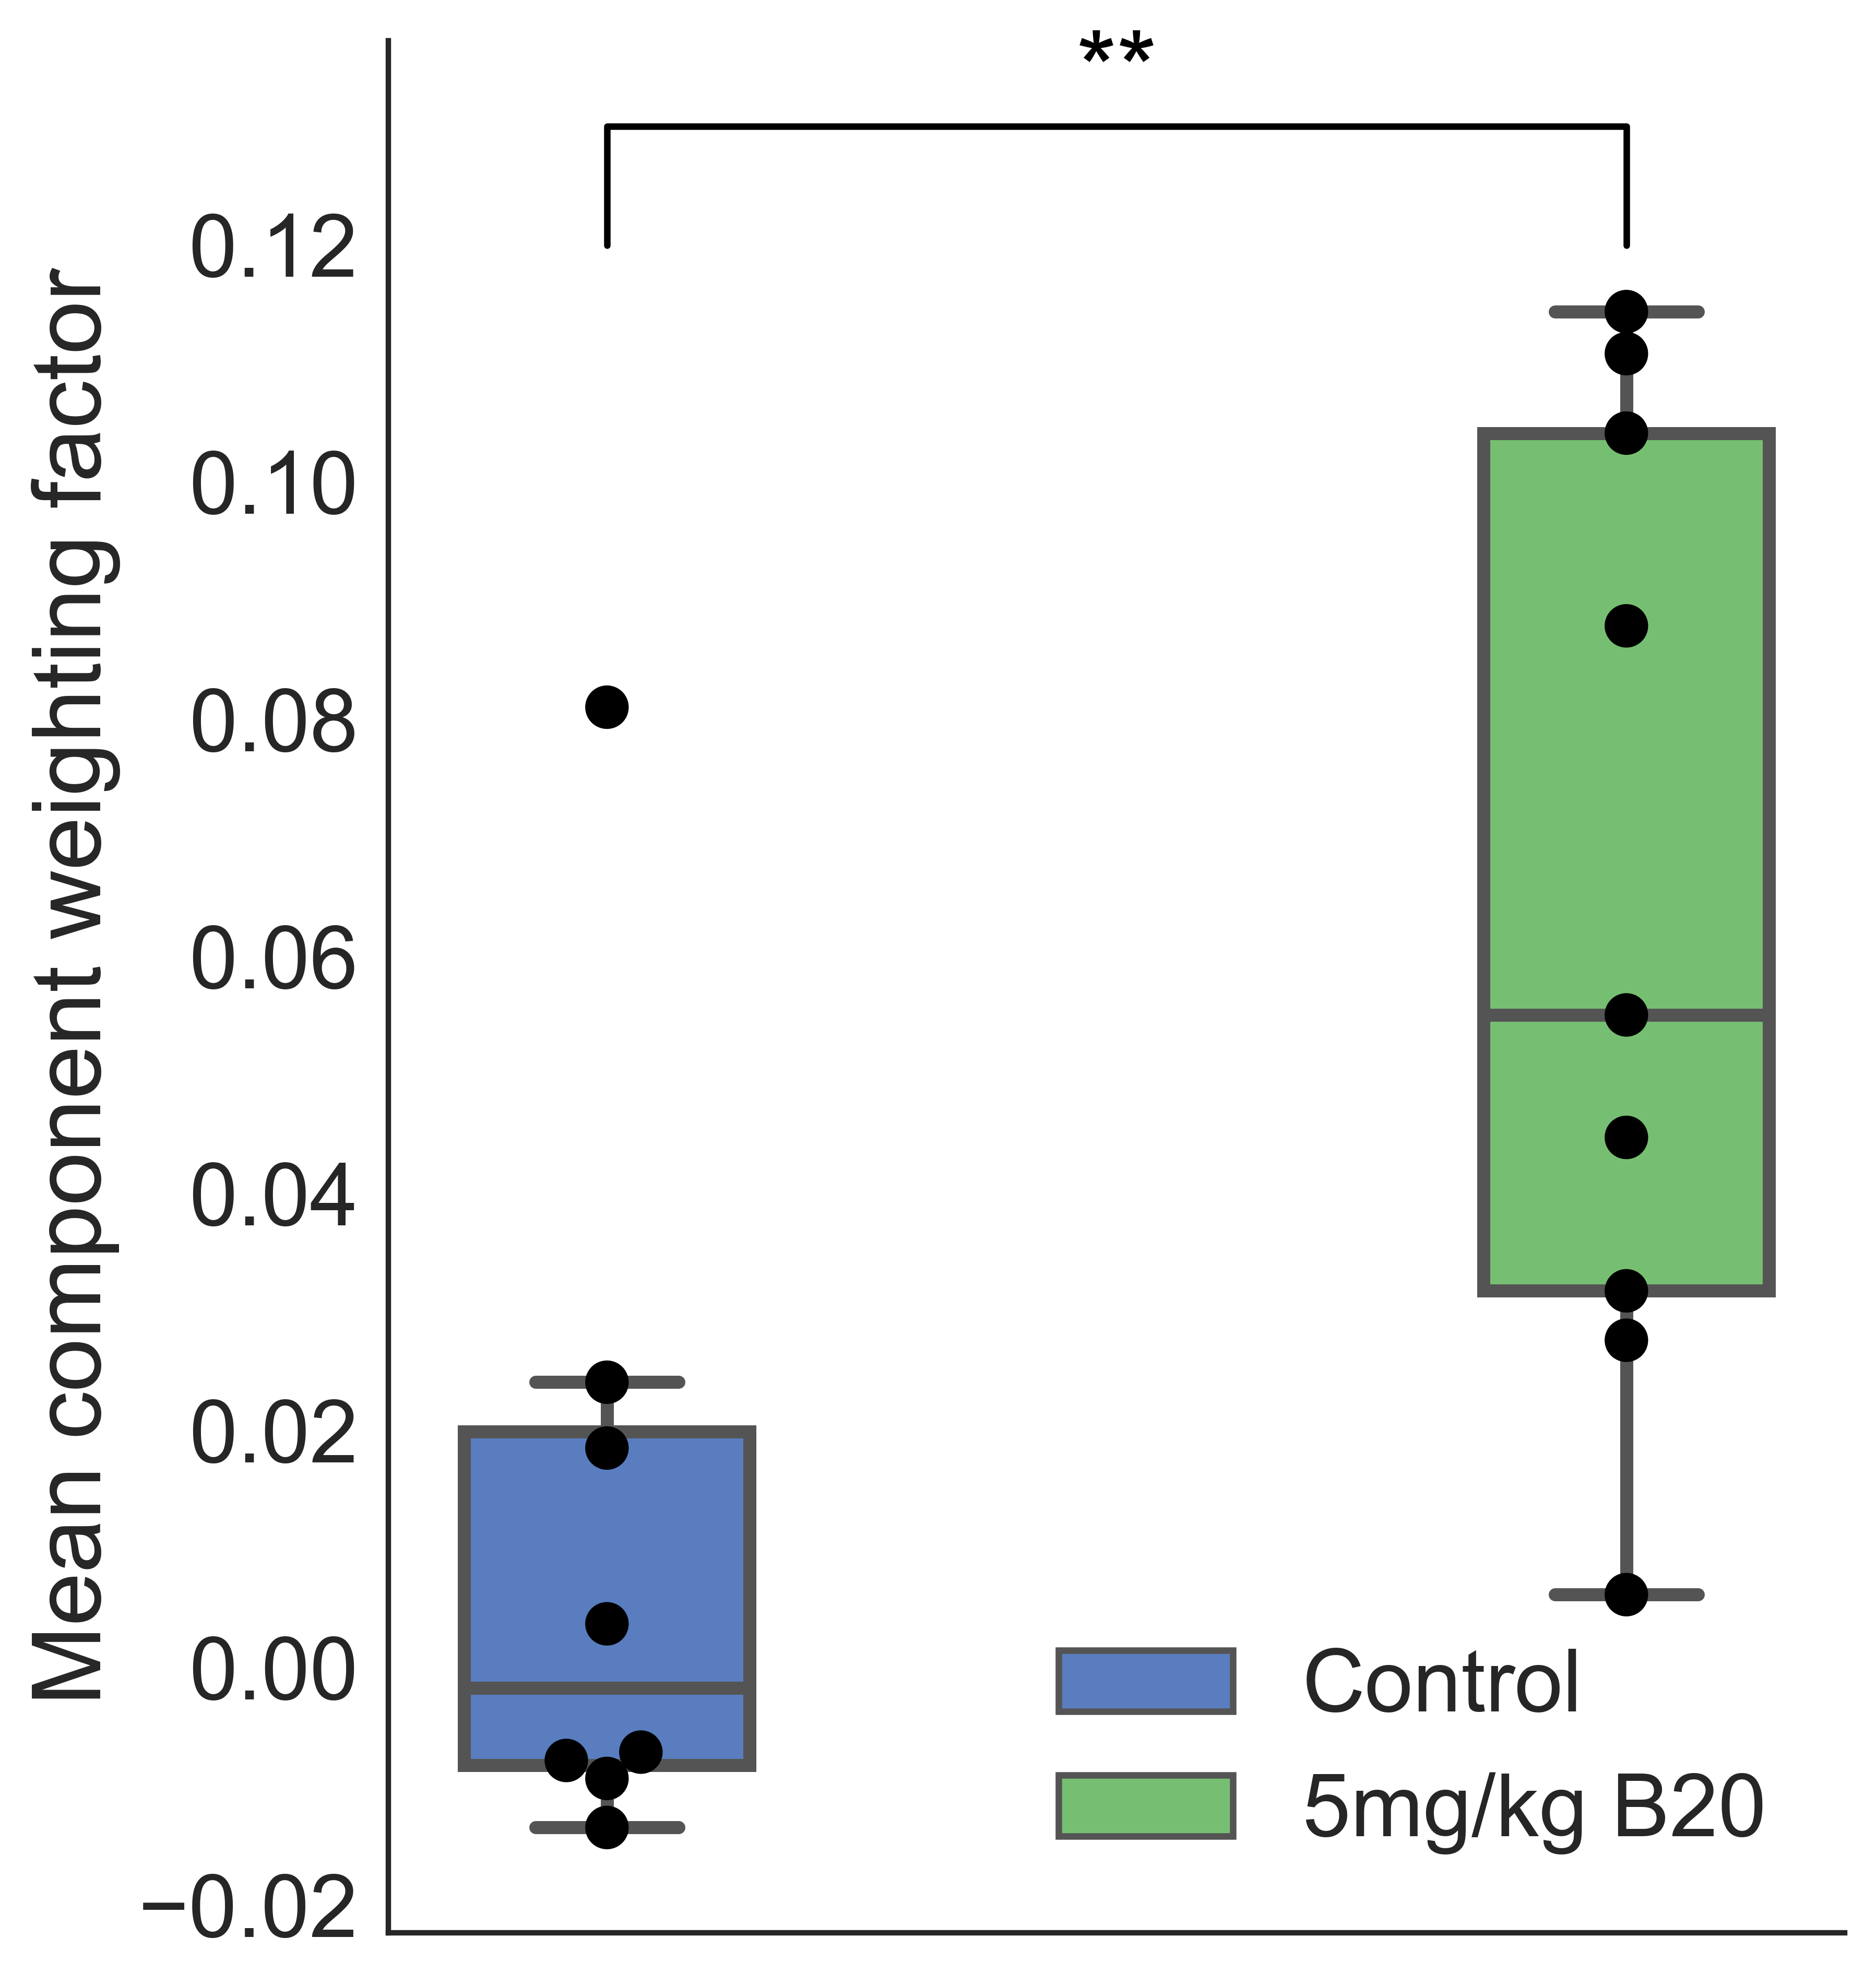
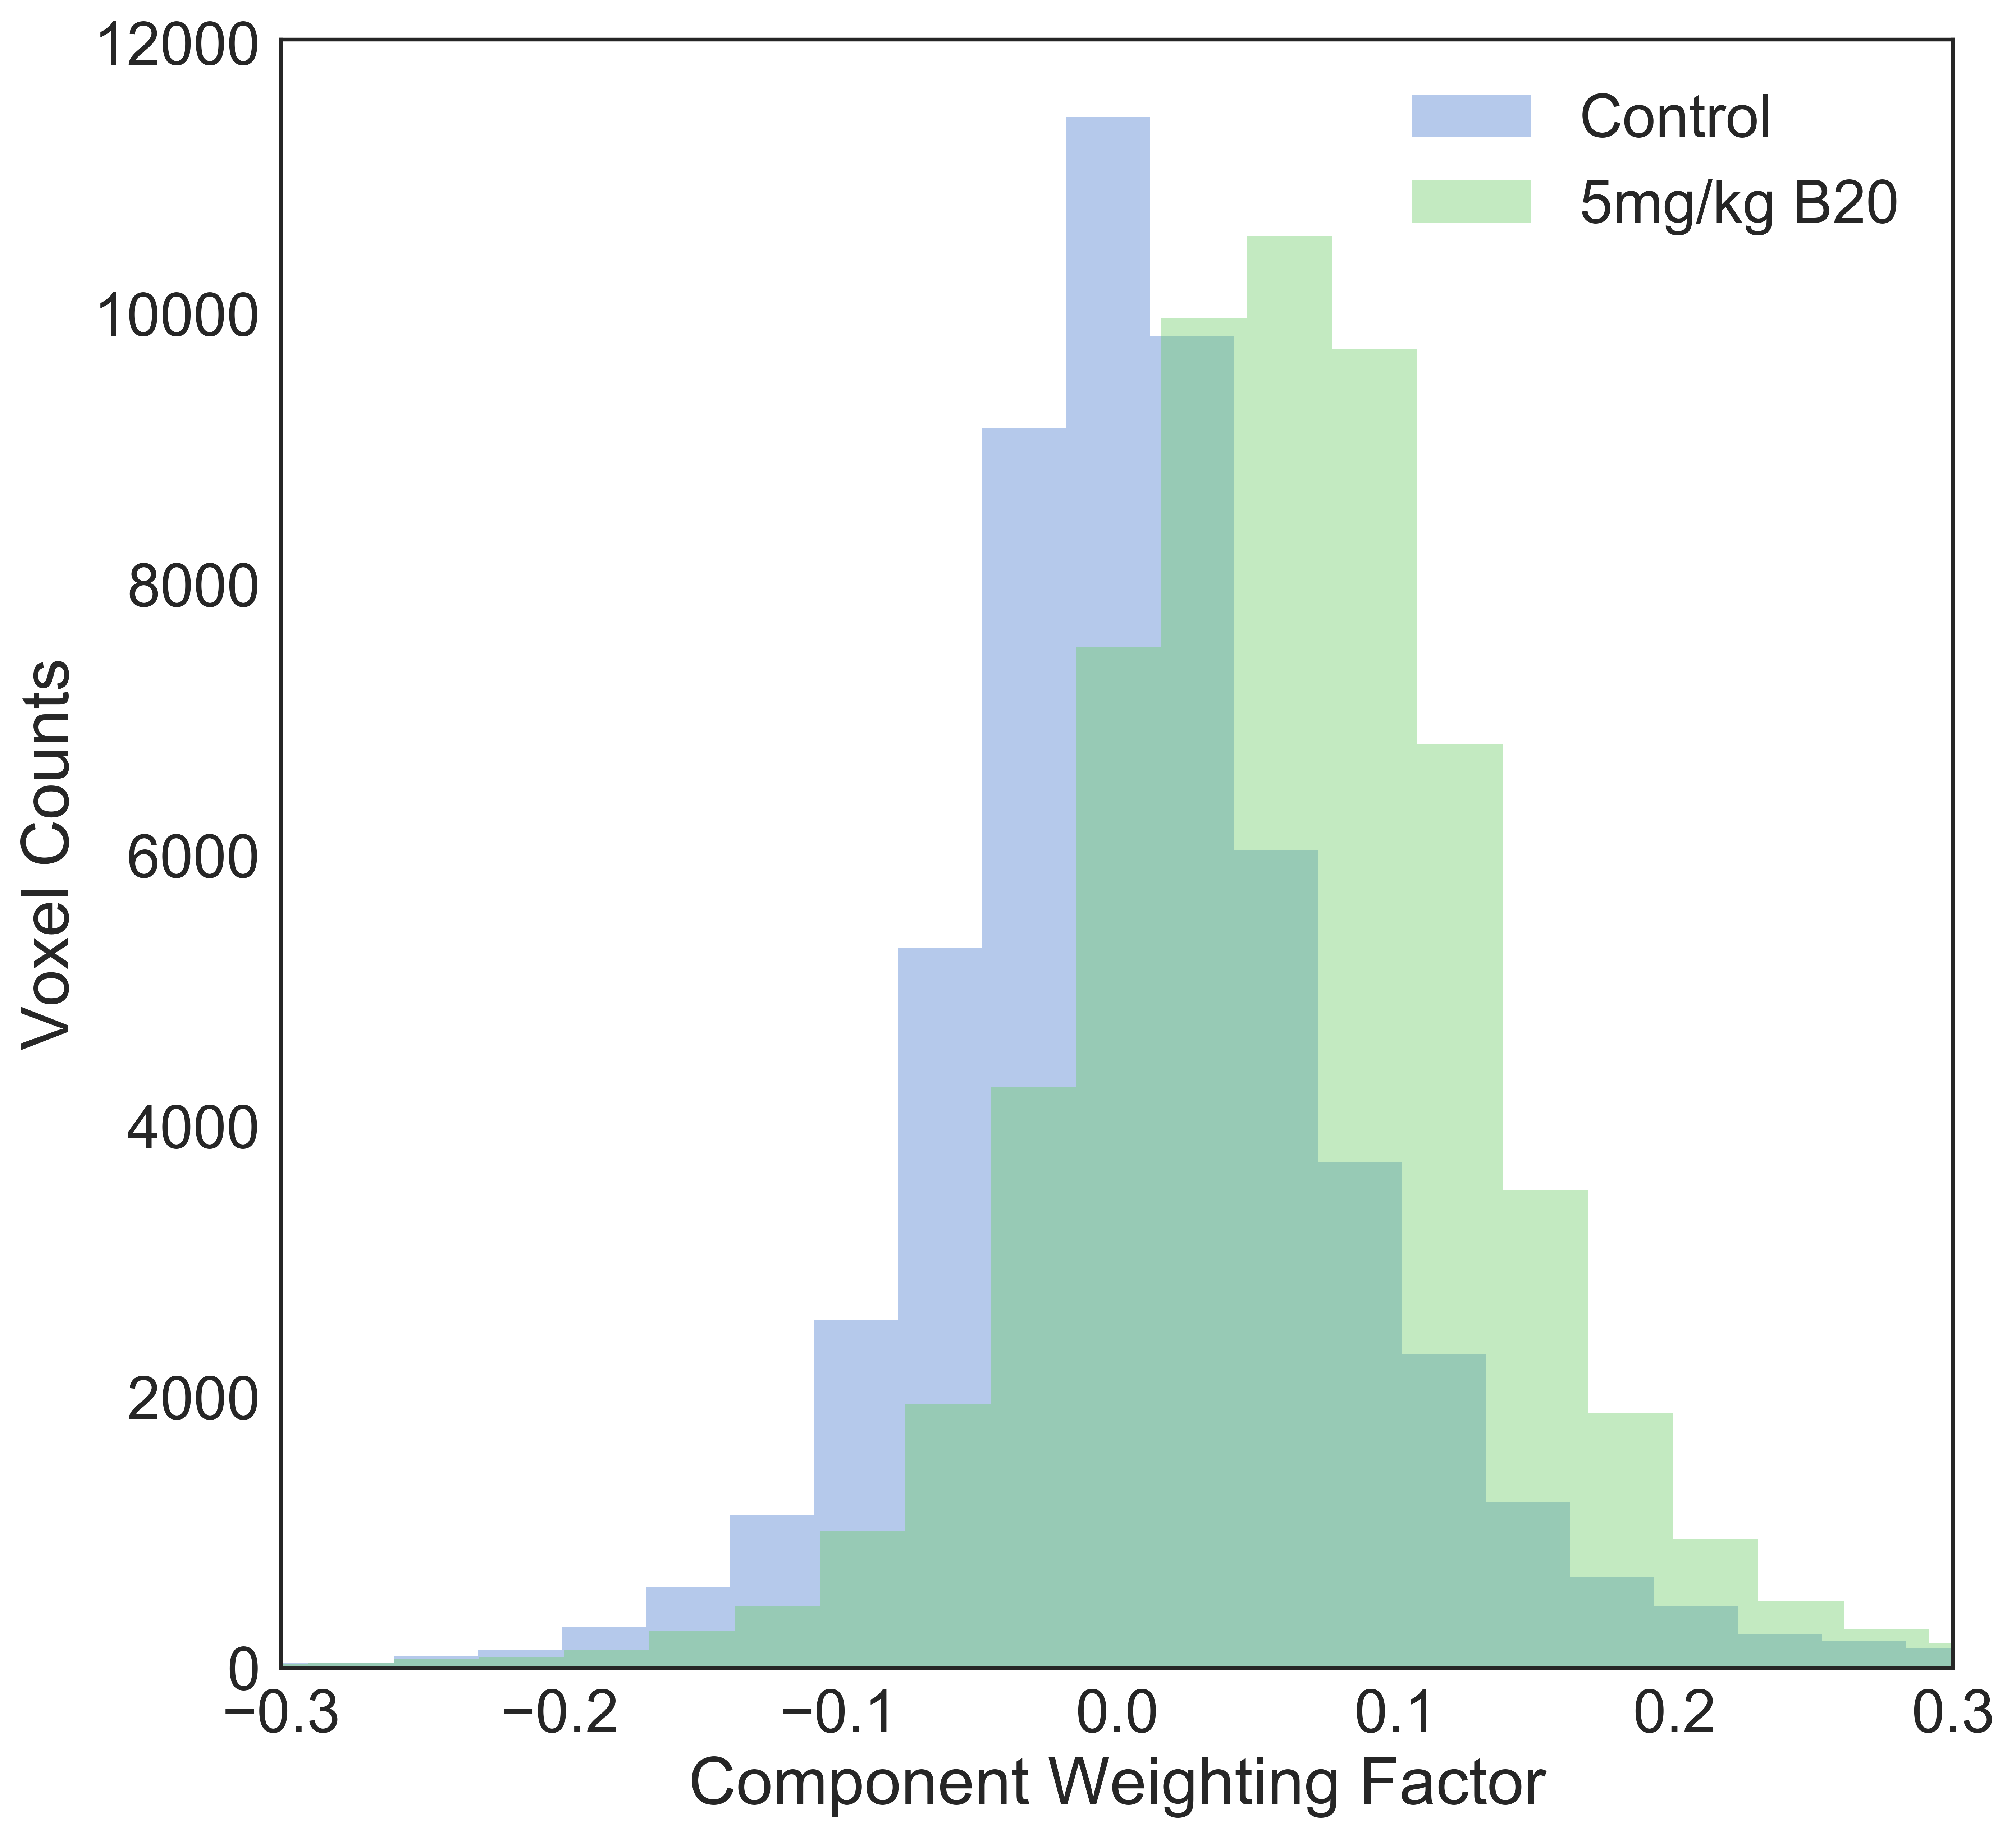
Analysis: Cohort data for groupICA was constructed by concatenating all 16 slices from the 17 subjects together in the z-dimension. The deflation-based FastICA (python package scikit.sklearn v0.17.1) was used to analyze the data. To ensure the cyclic behavior of the T1W signal intensity corresponding to the gas challenge appeared in only one component, number of independent components was set to 9. Upon selection of the oxygen enhancing component, reshaping the resultant weighting-factor maps to the original matrix size provided inter-subject comparable data. Final normalized dOE-MRI maps were obtained by dividing each pixel of the component map for each animal with the mean signal-intensity over time of the corresponding pixel in the dOE-MRI scan. Mean values are reported as a marker for tumour oxygenation with high values indicating increased oxygenation while negative values suggest decreased oxygenation or increased levels of hypoxia. A Welch’s t-test for unequal variances was conducted to assess the difference between the control and treated group and Hedge’s g was calculated to determine effect size.
Results and Discussion
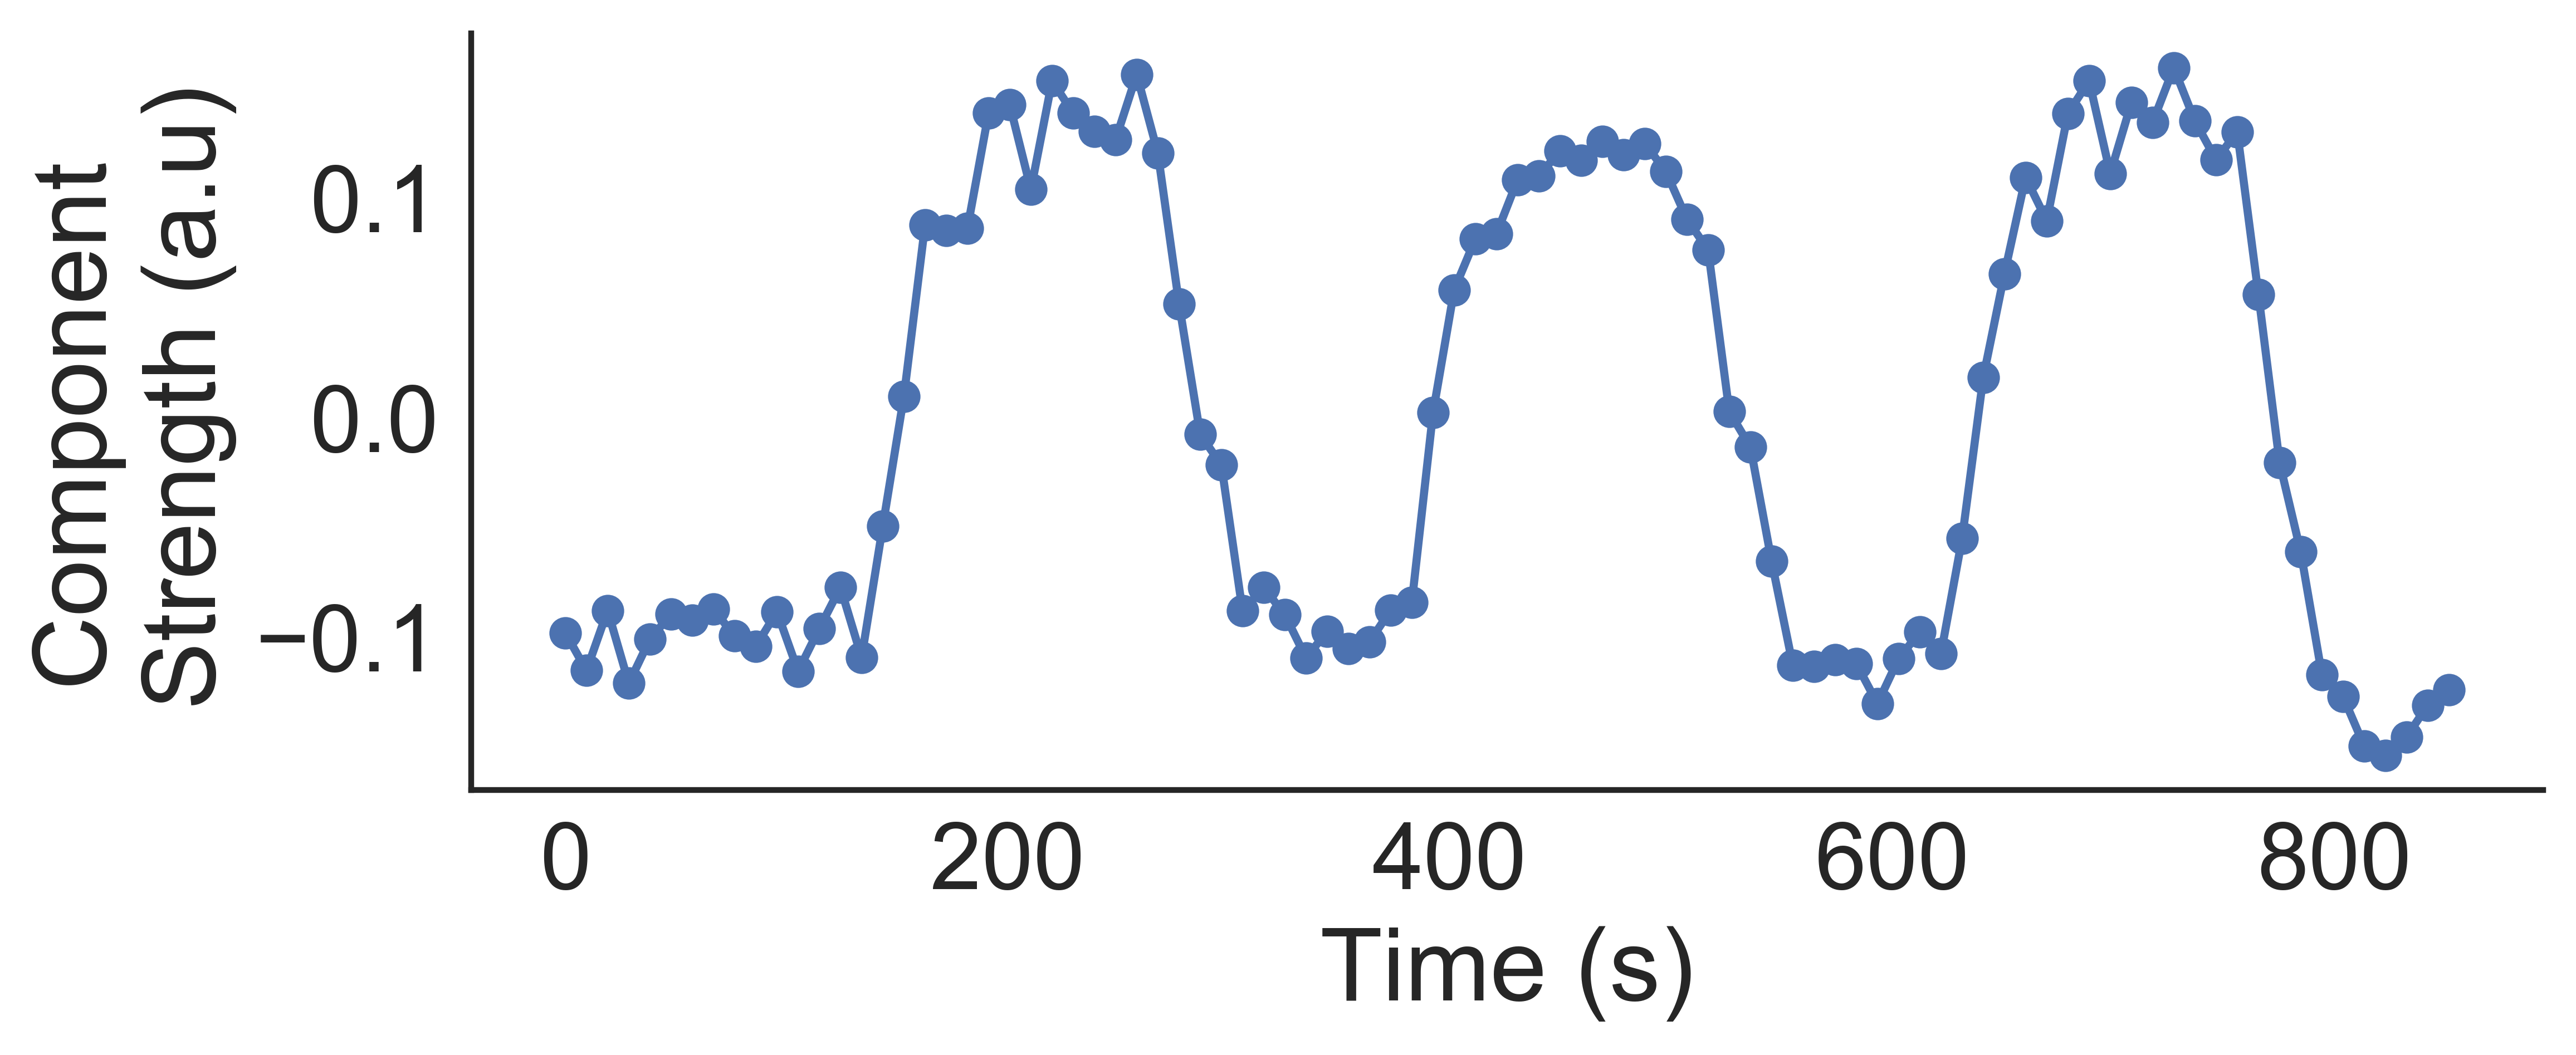
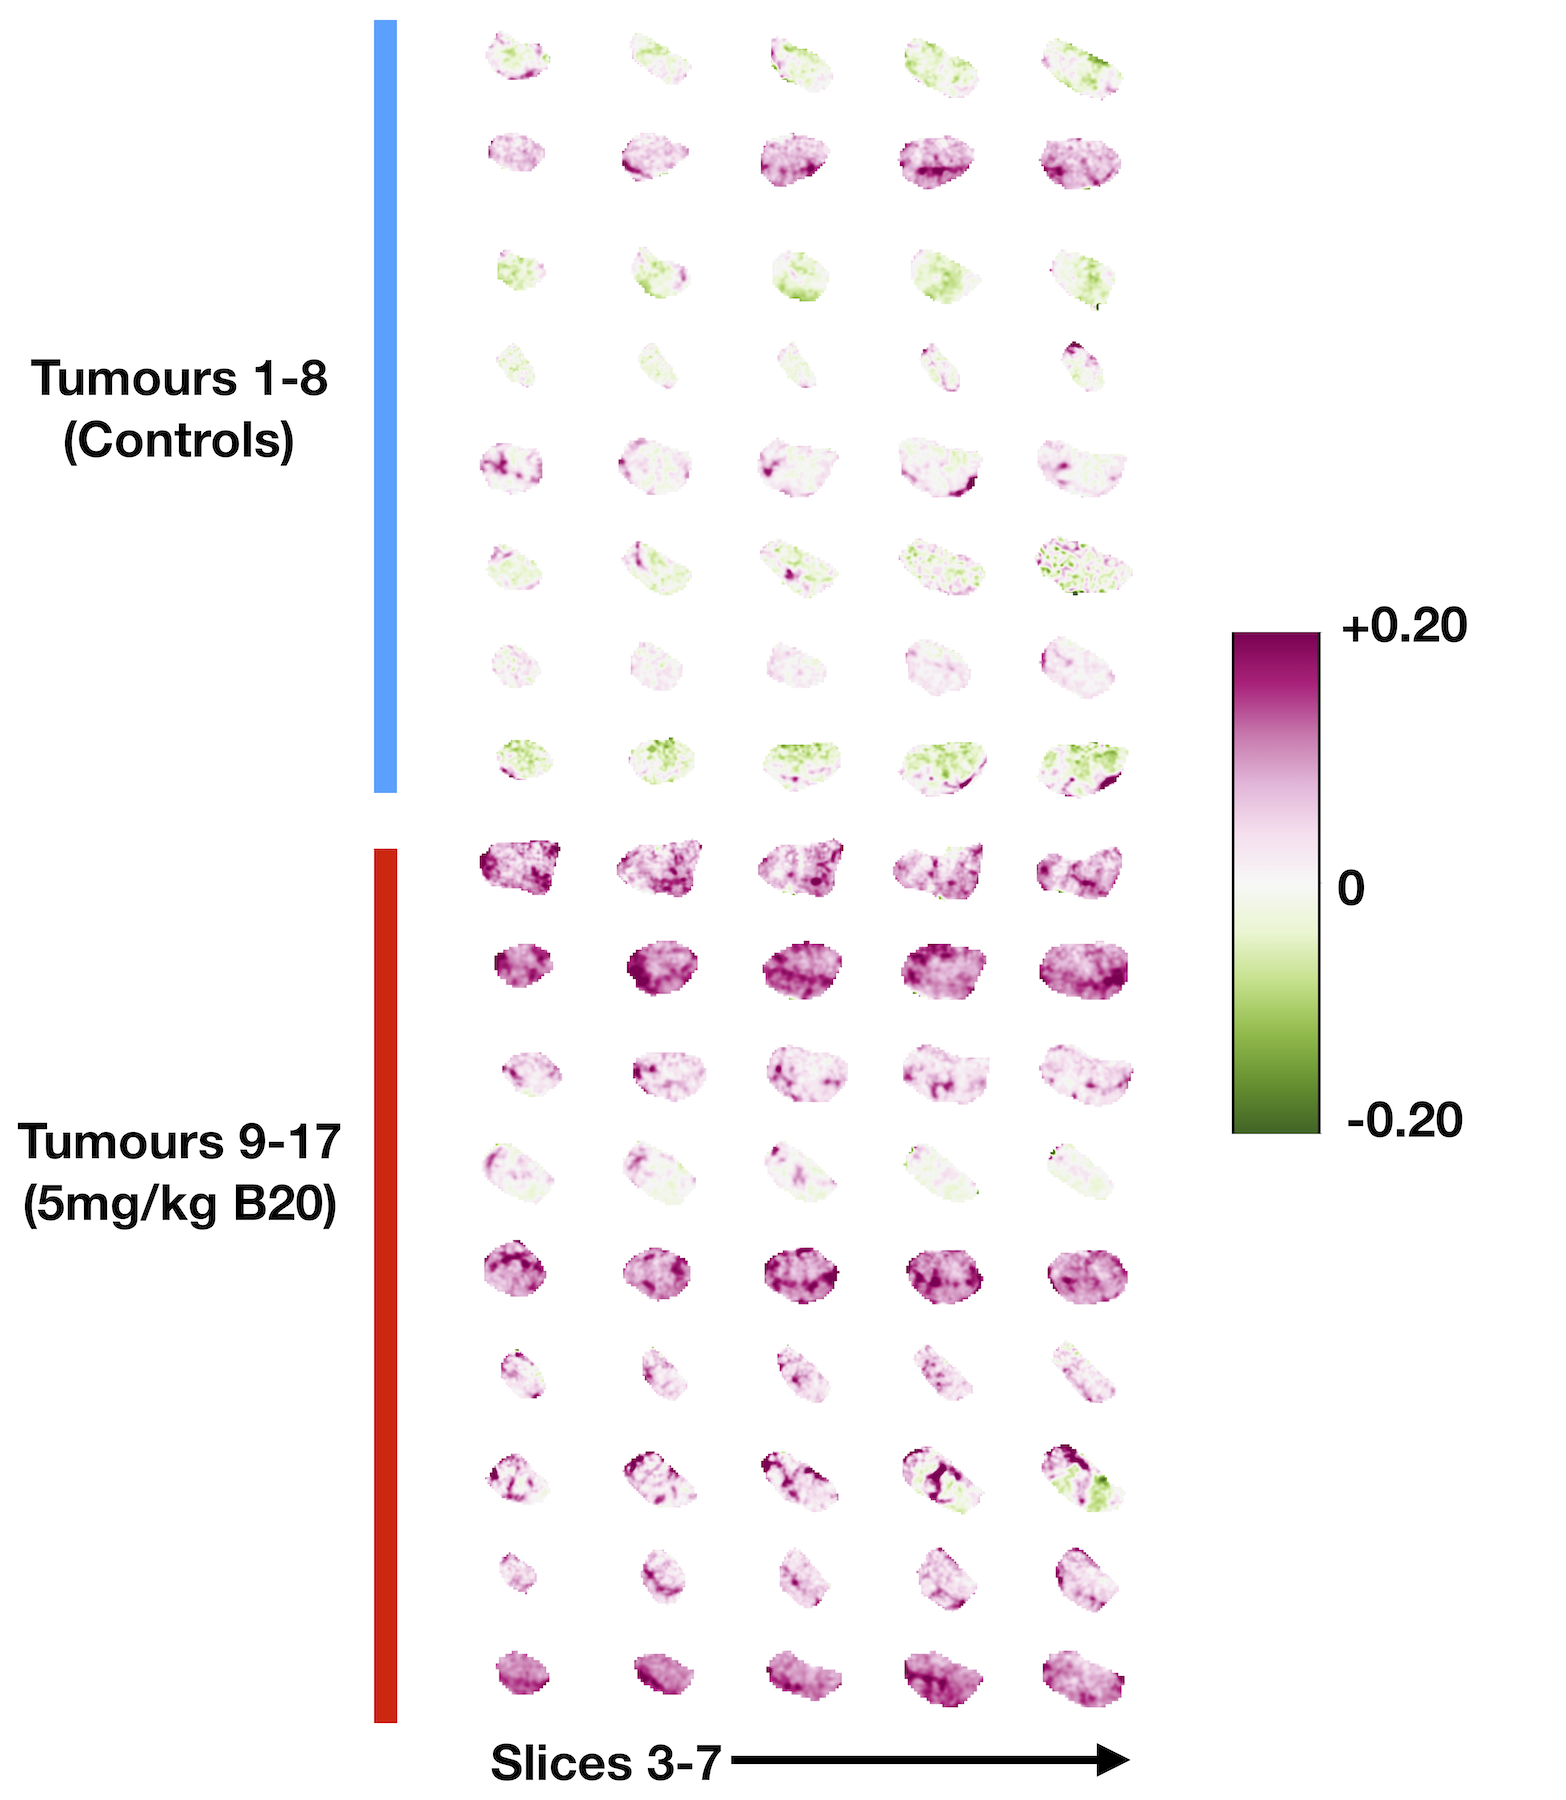
Application of ICA to the spatially concatenated data produced a single oxygen-enhancing component that matched the temporal pattern of the gas cycling paradigm (Figure 1). Corresponding dOE-MRI maps for all mice in a subset of slices are shown in Figure 2. The difference between mean oxygenation-related dOE-MRI component weight of the control group (µ=0.011+/-0.01) and the treated group (µ=0.06 +/-0.01) was statistically significant (p=0.008) and the effect size was large (Hedge’s g=1.56). Considerable intertumour heterogeneity was observed in the dOE-MRI maps, in both the control and treated groups (Fig. 2). VEGF-ablation through treatment with B20 ultimately has a vascular disrupting and anti-angiogenic effect, however a temporary phase of improved vessel function through the pruning of poorly functional vessels has been widely described[6]. Improved vascular function results in reduced hypoxia in these SCCVII tumors, an effect that is also detected using pimonidazole-labeling of hypoxic tissues for histological analysis. Analysis using groupICA presented an advantage in that the single extracted component from the group reflects cohort behaviour of all subjects with respect to that one common component; the contribution (component weight) of any individual voxel from each animal will be comparable between subjects. In contrast, component maps obtained from individual ICA are difficult to normalize and cannot be easily compared without resorting to techniques such as z-score maps or correlations.Conclusions
VEGF-ablation treatment of murine SCCVII tumours mediates an improvement in tissue oxygenation that can be described using dOE-MRI. These changes to the tumour microenvironment may be qualitatively described in parameter maps, or quantitatively compared using groupICA.Acknowledgements
This work was supported by NSERC and CIHR.References
[1] Moosvi, F., Baker, J. H. E., Yung, A., Kozlowski, P., Minchinton, A. I., & Reinsberg, S. A. (2018). Fast and sensitive dynamic oxygen-enhanced MRI with a cycling gas challenge and independent component analysis. Magnetic Resonance in Medicine. http://doi.org/10.1002/mrm.27584
[2] O'Connor, J. P. B., Boult, J. K. R., Jamin, Y., Babur, M., Finegan, K. G., Williams, K. J., et al. (2016). Oxygen-Enhanced MRI Accurately Identifies, Quantifies, and Maps Tumor Hypoxia in Preclinical Cancer Models. Cancer Research, 76(4), 787–795. http://doi.org/10.1158/0008-5472.CAN-15-2062
[3] Hyvärinen, A., & Oja, E. (2000). Independent component analysis: algorithms and applications. Neural Networks, 13(4-5), 411–430.
[4] Calhoun, V. D., Liu, J., & Adali, T. (2009). A review of group ICA for fMRI data and ICA for joint inference of imaging, genetic, and ERP data. NeuroImage, 45(1 Suppl), S163–72. http://doi.org/10.1016/j.neuroimage.2008.10.057
[5] O'Connor, J. P. B., Jackson, A., Parker, G. J. M., Roberts, C., & Jayson, G. C. (2012). Dynamic contrast-enhanced MRI in clinical trials of antivascular therapies. Nature Reviews Clinical Oncology, 9(3), 167–177. http://doi.org/10.1038/nrclinonc.2012.2
[6] Jain, R. K. (2005). Normalization of tumor vasculature: an emerging concept in antiangiogenic therapy. Science (New York, N.Y.), 307(5706), 58–62. http://doi.org/10.1126/science.1104819
Figures