0501
Multi-Parametric MRI assessment of pulsed focused ultrasound treated pancreas tumor1Department of Radiology, University of Washington, Seattle, WA, United States, 2Applied Physics Laboratory, University of Washington, Seattle, WA, United States, 3Division of Gastroentrology, University of Washington, Seattle, WA, United States, 4Department of Medicine, Stanford, Stanford, CA, United States
Synopsis
Pancreatic ductal adenocarcinoma (PDA) is characterized by excessive levels of hyaluronan and collagen, resulting in a dense fibroinflammatory stroma that inhibits penetration of chemotherapeutic drugs into the tumor. Pulsed focused ultrasound (pFUS) treatment has shown promising results in disrupting the dense stroma and reducing the interstitial fluid pressure of PDA. The purpose of this study is to noninvasively assess response to pFUS treatments using quantitative MRI and to correlate the MRI results with histopathology data.
Introduction
Pancreatic ductal adenocarcinoma (PDA) is the fourth leading cause of cancer-related deaths in the United States [1]. The overall 5-year survival rate of PDA is only 8%. Advanced stage diagnosis, as well as the ineffectiveness of standard treatments contribute to the poor overall prognosis. Standard chemotherapeutic treatments are largely ineffective due to the robust desmoplastic stroma and resulting high interstitial fluid pressures characteristic of PDA. In a transgenic mouse model of PDA (KPC mouse), pulsed focused ultrasound (pFUS) therapy has been shown to disrupt the dense fibrotic stroma and increase the penetration of a chemotherapeutic [2]. A recent phase 1 clinical trial of pFUS in combination with chemotherapy, doubled median overall survival in patients with inoperable PDA versus chemotherapy alone [3]. As new promising treatments are developed, methods to assess treatment efficacy are a critical consideration. The purpose of this study was to implement non-invasive MRI methods to assess pFUS treatment effects for PDA.Methods
We used three mouse models of PDA including subcutaneous, orthotopic and transgenic KPC mice. The mice were imaged on a Bruker 14T Avance MR spectrometer (Bruker Corp., Billerica, MA) to assess response to pulsed focused ultrasound (pFUS) treatments (VIFU 2000 Alpinion Medical Systems; 475 W peak electric power, 1 millisecond pulse duration, 1 Hz, duty cycle 0.1%) or sham treatments. The focal spot was raster-scanned throughout the acoustically accessible volume of the tumor with a step size of 1 mm, and 60 pulses were delivered at each focal spot. Cavitation activity was recorded during treatment. Maps for T1 and T2 relaxation, apparent diffusion coefficient (ADC), magnetization transfer ratio (MTR), and chemical exchange saturation transfer (CEST) for the amide proton and glycosaminoglycan (gag) spectrum were generated. Images were collected 48 hours pre-pFUS and immediately post-pFUS therapy. Tumors were excised and prepared for histological and biochemical evaluation. Sections were stained with hematoxylin and eosin, Masson’s trichrome, picrosirius red, and immunohistochemistry for vessels (CD31) and hyaluronan (HA). Sulfated glycosaminoglycans (sGAG) and hyaluronan concentration was measured using standard biochemical techniques. Gag CEST imaging of chondroitin sulfate (CS) and sodium hyaluronate (HA) phantoms was performed to investigate effects seen in pancreas tumors and determine their relative contributions to the observed CEST signals.Results and Discussion
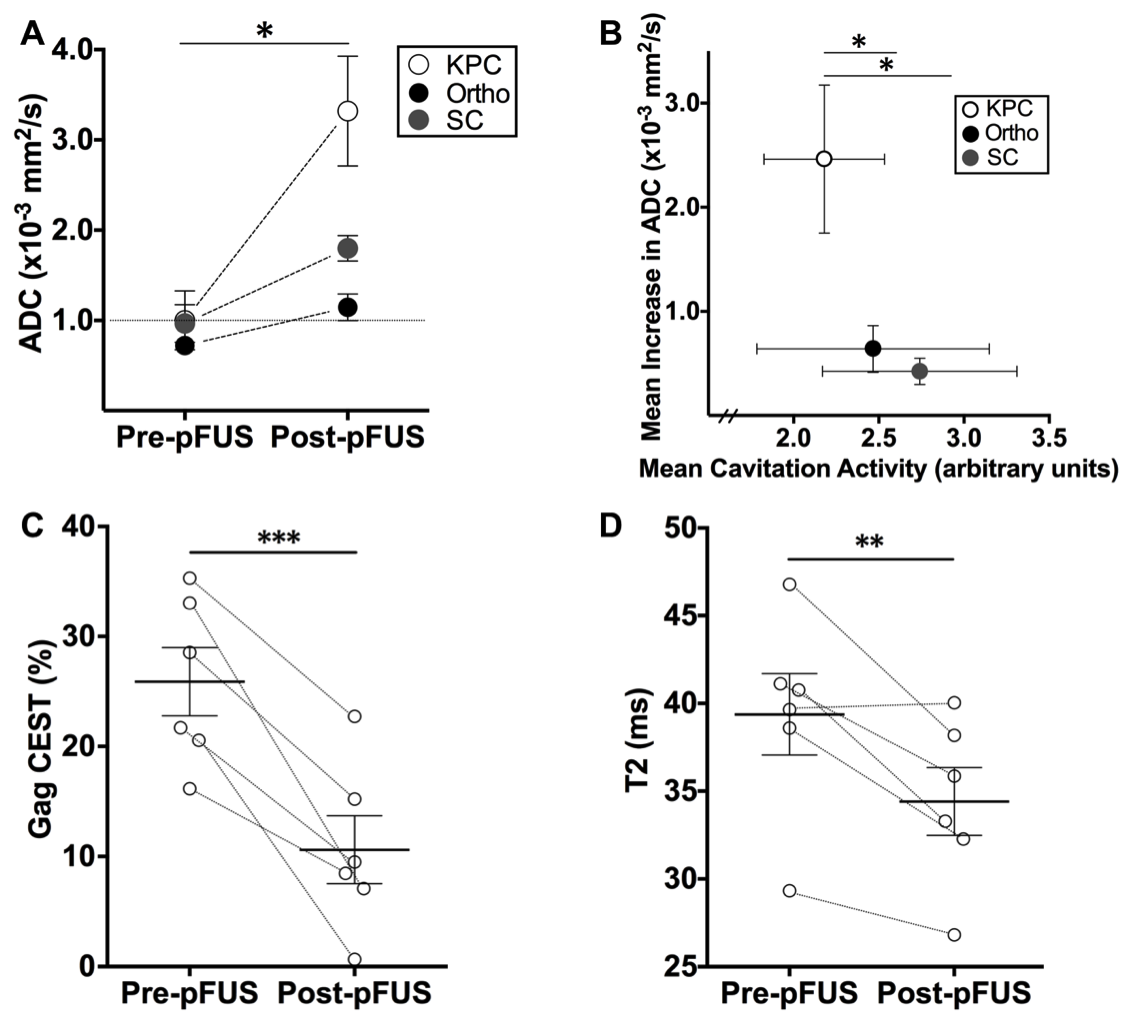
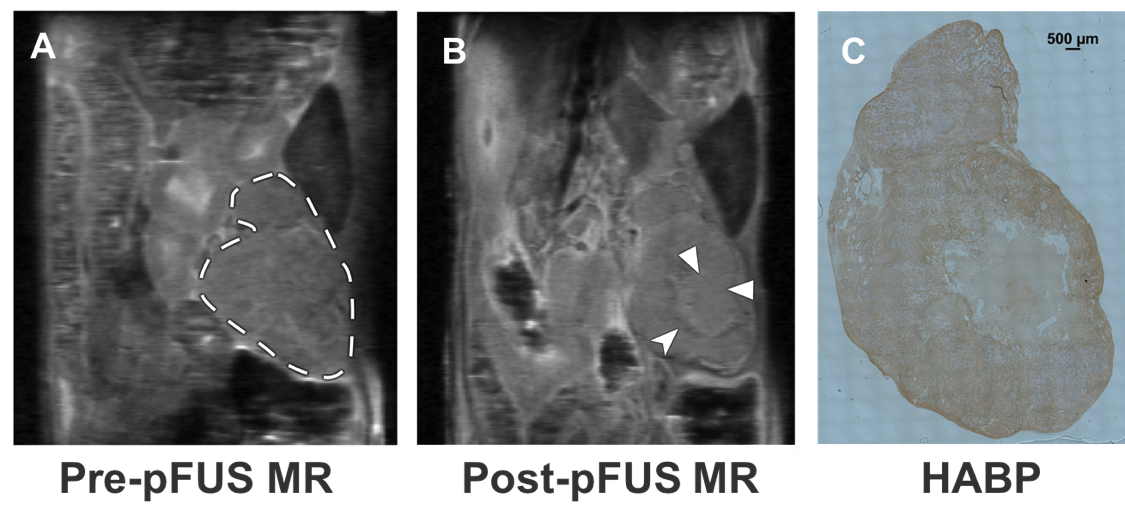
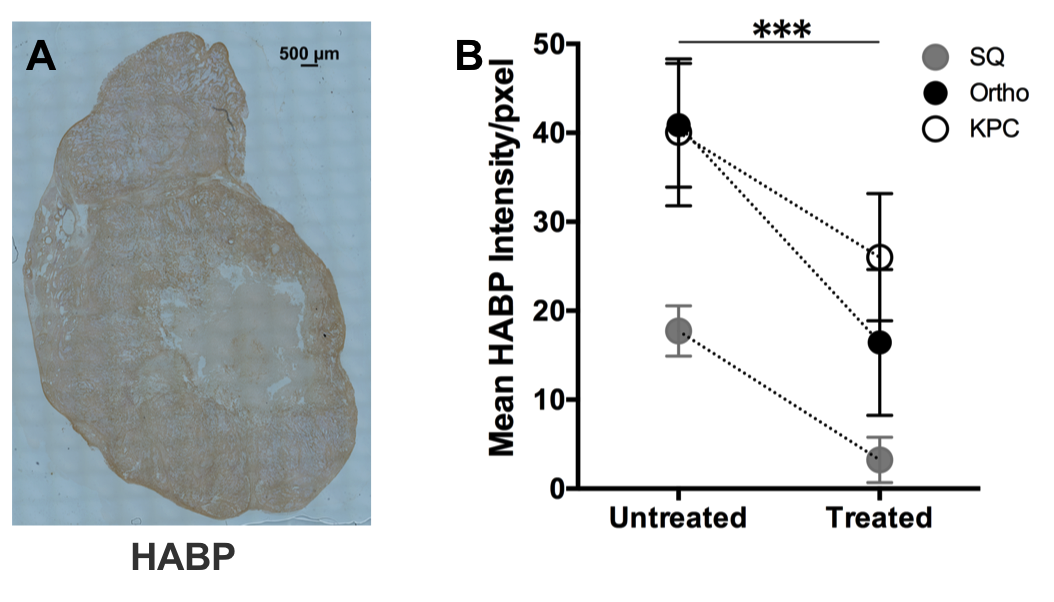
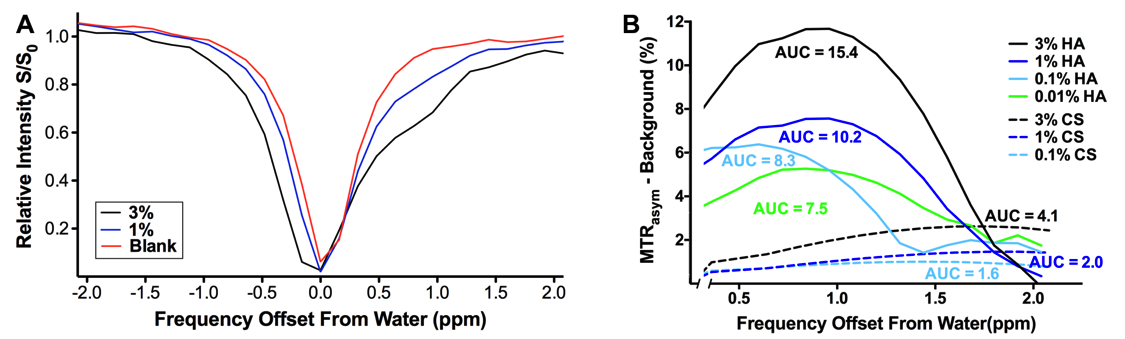
Cavitation activity was achieved in all three murine PDA models. Following pFUS treatment, mean high-b value ADC values increased significantly for all animal models, and this increase was most pronounced in the KPC model (10-3 mm2/s, errors = standard error from the mean; KPC: 1.00 ± 0.33 versus 3.32 ± 0.61, p = 0.01; Orthotopic: 0.72 ± 0.07 versus 1.15 ± 0.15, p = 0.02; Subcutaneous: 0.97 ± 0.21 versus 1.80 ± 0.14, p = 0.03) (Fig. 1A-B). Mean gag CEST (percentage) and T2 values (ms) decreased significantly post-treatment only for the KPC group (gag CEST: 25.89 ± 3.75 versus 11.20 ± 3.03, p = 7.9 x 10⁻⁷; T2: 39.38 ± 2.32 versus 34.41 ± 1.93, p = 0.02) (Fig. 1C-D). Mean MTR and amide CEST values increased significantly for the KPC group (MTR: 38.15 ± 4.17 versus 59.80 ± 1.46, p = 7.5 x 10⁻⁴; amide CEST: 10.37 ± 2.76 versus 24.89 ± 5.17, p = 0.01). Treated areas demonstrated predominantly isointense signal on proton density weighted images, in some instances with an associated peripheral ring of hypointense signal (Fig. 2B). Overall, there was no significant difference in mean tumor T1 relaxation time values. Parameters tested were otherwise not significantly changed post-pFUS treatment in all three murine PDA models. There were no significant differences in any parameters tested for the sham group animals. HA and sGAG tissue concentrations were found to be lower in all of the pFUS-treated animals versus sham-treatment control models, but these differences were not statistically significant. There was a significant decrease in HA in the pFUS treated area compared to tissue that was not disrupted by pFUS treatment for all animal models (Fig. 3). Phantom studies demonstrated a larger gag CEST signal was generated by HA than CS at every concentration tested (Fig. 4A-B).Conclusions
Variable changes in T1 relaxation, and significantly increased MTR and amide CEST signals post-pFUS treatment most likely represent sequelae of hyperacute hemorrhage from microcapillary vessels. Decreases in gag CEST and T2 relaxation may represent disruption of glycosaminoglycans and associated liberation of complexed water molecules from within the tumor stroma. Significant increase in ADC likely reflects increased diffusivity within the treated PDA tumors. T2 relaxation, gag CEST, and ADC may provide reliable quantitation for monitoring the therapeutic effect of pFUS for PDA.Acknowledgements
This Work was supported by NIH T32 Training Grant (5 T32 DK0072) and R01 Grants (CA154451, CA188654).References
1. Siegel RL, Miller KD, Jemal A. Cancer Statistics, 2017. CA Cancer J Clin 2017;67(1):7-30.
2. Li T, Wang YN, Khokhlova TD, D'Andrea S, Starr F, Chen H, et al. Pulsed High-Intensity Focused Ultrasound Enhances Delivery of Doxorubicin in a Preclinical Model of Pancreatic Cancer. Cancer Res 2015;75(18):3738-46.
3. Dimcevski G, Kotopoulis S, Bjanes T, Hoem D, Schjott J, Gjertsen BT, et al. A human clinical trial using ultrasound and microbubbles to enhance gemcitabine treatment of inoperable pancreatic cancer. J Control Release 2016;243:172-81.
Figures