0500
Dextran-based CEST MRI for detecting extradomain-B fibronectin in pancreatic cancer1Chemical and Biomolecular Engineering, Johns Hopkins University, Baltimore, MD, United States, 2Department of Radiology, Johns Hopkins University, Baltimore, MD, United States, 3Department of Oncology, Johns Hopkins University, Baltimore, MD, United States, 4F.M. Kirby Research Center for Functional Brain Imaging, Kennedy Krieger Institue, Baltimore, MD, United States
Synopsis
A dextran-peptide conjugate was developed for MR molecular imaging of pancreatic ductal adenocarcinoma (PDAC) through its overexpressed microenvironment biomarker, extradomain-B fibronectin (EDB-FN). Dextrans can be directly detected by chemical exchange saturation transfer (CEST) MRI without the need for radionuclide- or metallic labeling. In addition, large molecular weight dextran, dextran 10 (MW~ 10 kD), provides an approximately fifty times higher sensitivity per molecule than a single glucose unit. The potential of this highly biocompatible diamagnetic probe is demonstrated in a murine syngeneic allograft PDAC tumor model.
Introduction
Extradomain-B fibornectin (EDB-FN) is a splice variant of fibronectin and one of the most selective oncofetal antigens abundantly expressed in the extracellular matrix (ECM) of aggressive tumors1. EDB-FN selectively overexpresses in pancreatic ductal adenocarcinoma (PDAC), one of the most deadly cancers, but only negligibly expresses in normal pancreas and chronic pancreatitis2. Here, we aimed to develop a natural dextran-based chemical exchange saturation transfer (CEST) contrast agent for specifically and sensitively detecting EDB-FN, with the ultimate goal of using it as an effective MRI molecular imaging approach for early detection and screening of PADC.Materials and methods
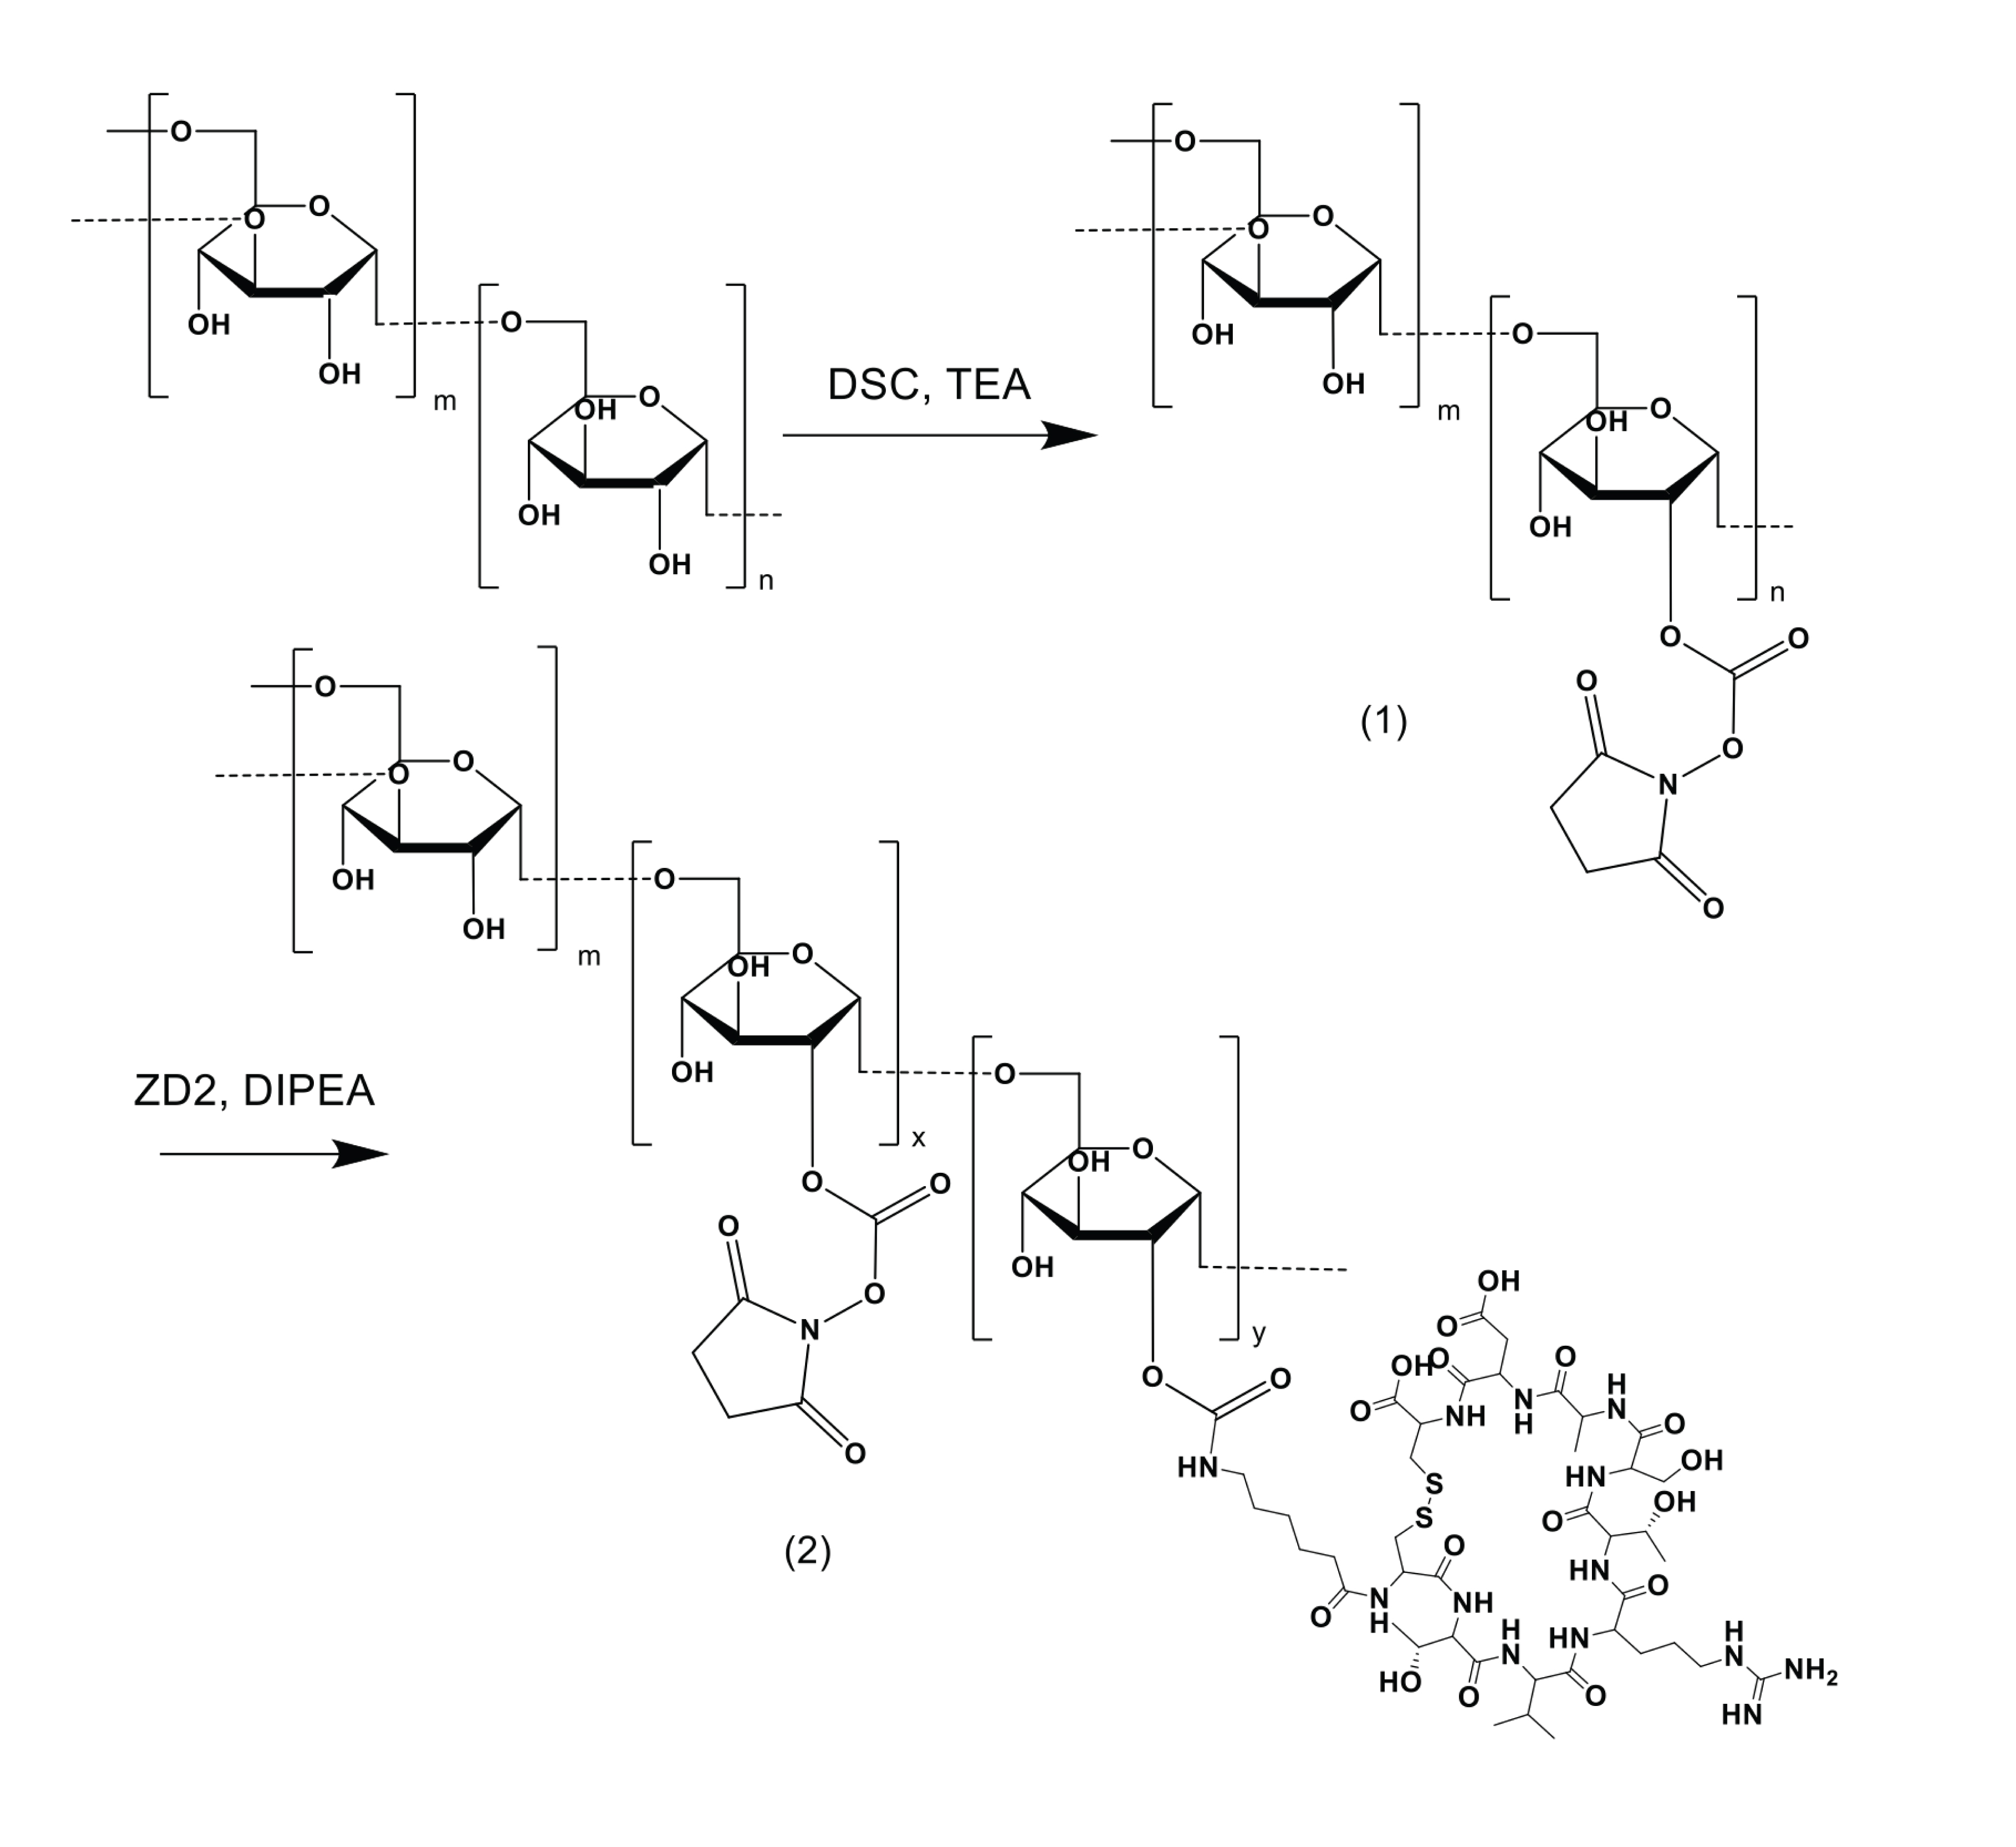
Synthesis. The EDB-FN-specific ZD2 peptide-conjugated dextran (abbr. Dex10-ZD2) was synthesized from dextran (MW= 10KDa, Sigma-Aldrich, abbr. dex10) and ZD2 peptide (Cys-Thr-Val-Arg-Thr-Ser-Ala-Asp-Cys)3 according to the route shown in Figure 1. In brief, ZD2 peptide extended with a flexible epsilon-aminocaproic acid residue (Acp) was synthesized using standard Fmoc-chemistry. Dex10 of 0.4*10-4 mole in DMSO (1.5 mL) was slowly added with 2.2*10-4 mole of N,N′-Disuccinimidyl carbonate (DSC, Sigmal-Aldrich) in 1 mL DMSO. Triethylamine (TEA) was then added and the mixture was stirred for 20 h at room temperature (RT). Dextran was precipitated by dropping the reaction mixture into cold acetone and centrifuging at 4000*g for 5 min to collect the activated dextran. Extended ZD2 peptide and the activated dextran were mixed in DMSO at the ratio of 3:1. Five equiv. of DIPEA was then added, and the mixture was stirred overnight at RT. The product was precipitated in acetone, collected by centrifugation and washed with acetone. The products in all steps were verified by NMR spectroscopy.
Animal model. The murine PDAC KPC cells were derived from KrasLSL.G12D/+; p53R172H/+; PdxCretg/+ (or KPC) mice. To form syngeneic allograft PDAC tumors subcutaneously, 1 million cells (in 200 µL) were subcutaneously injected to both flanks of C57BL/6J mice to form two tumors (to increase the success rate of tumor formation).
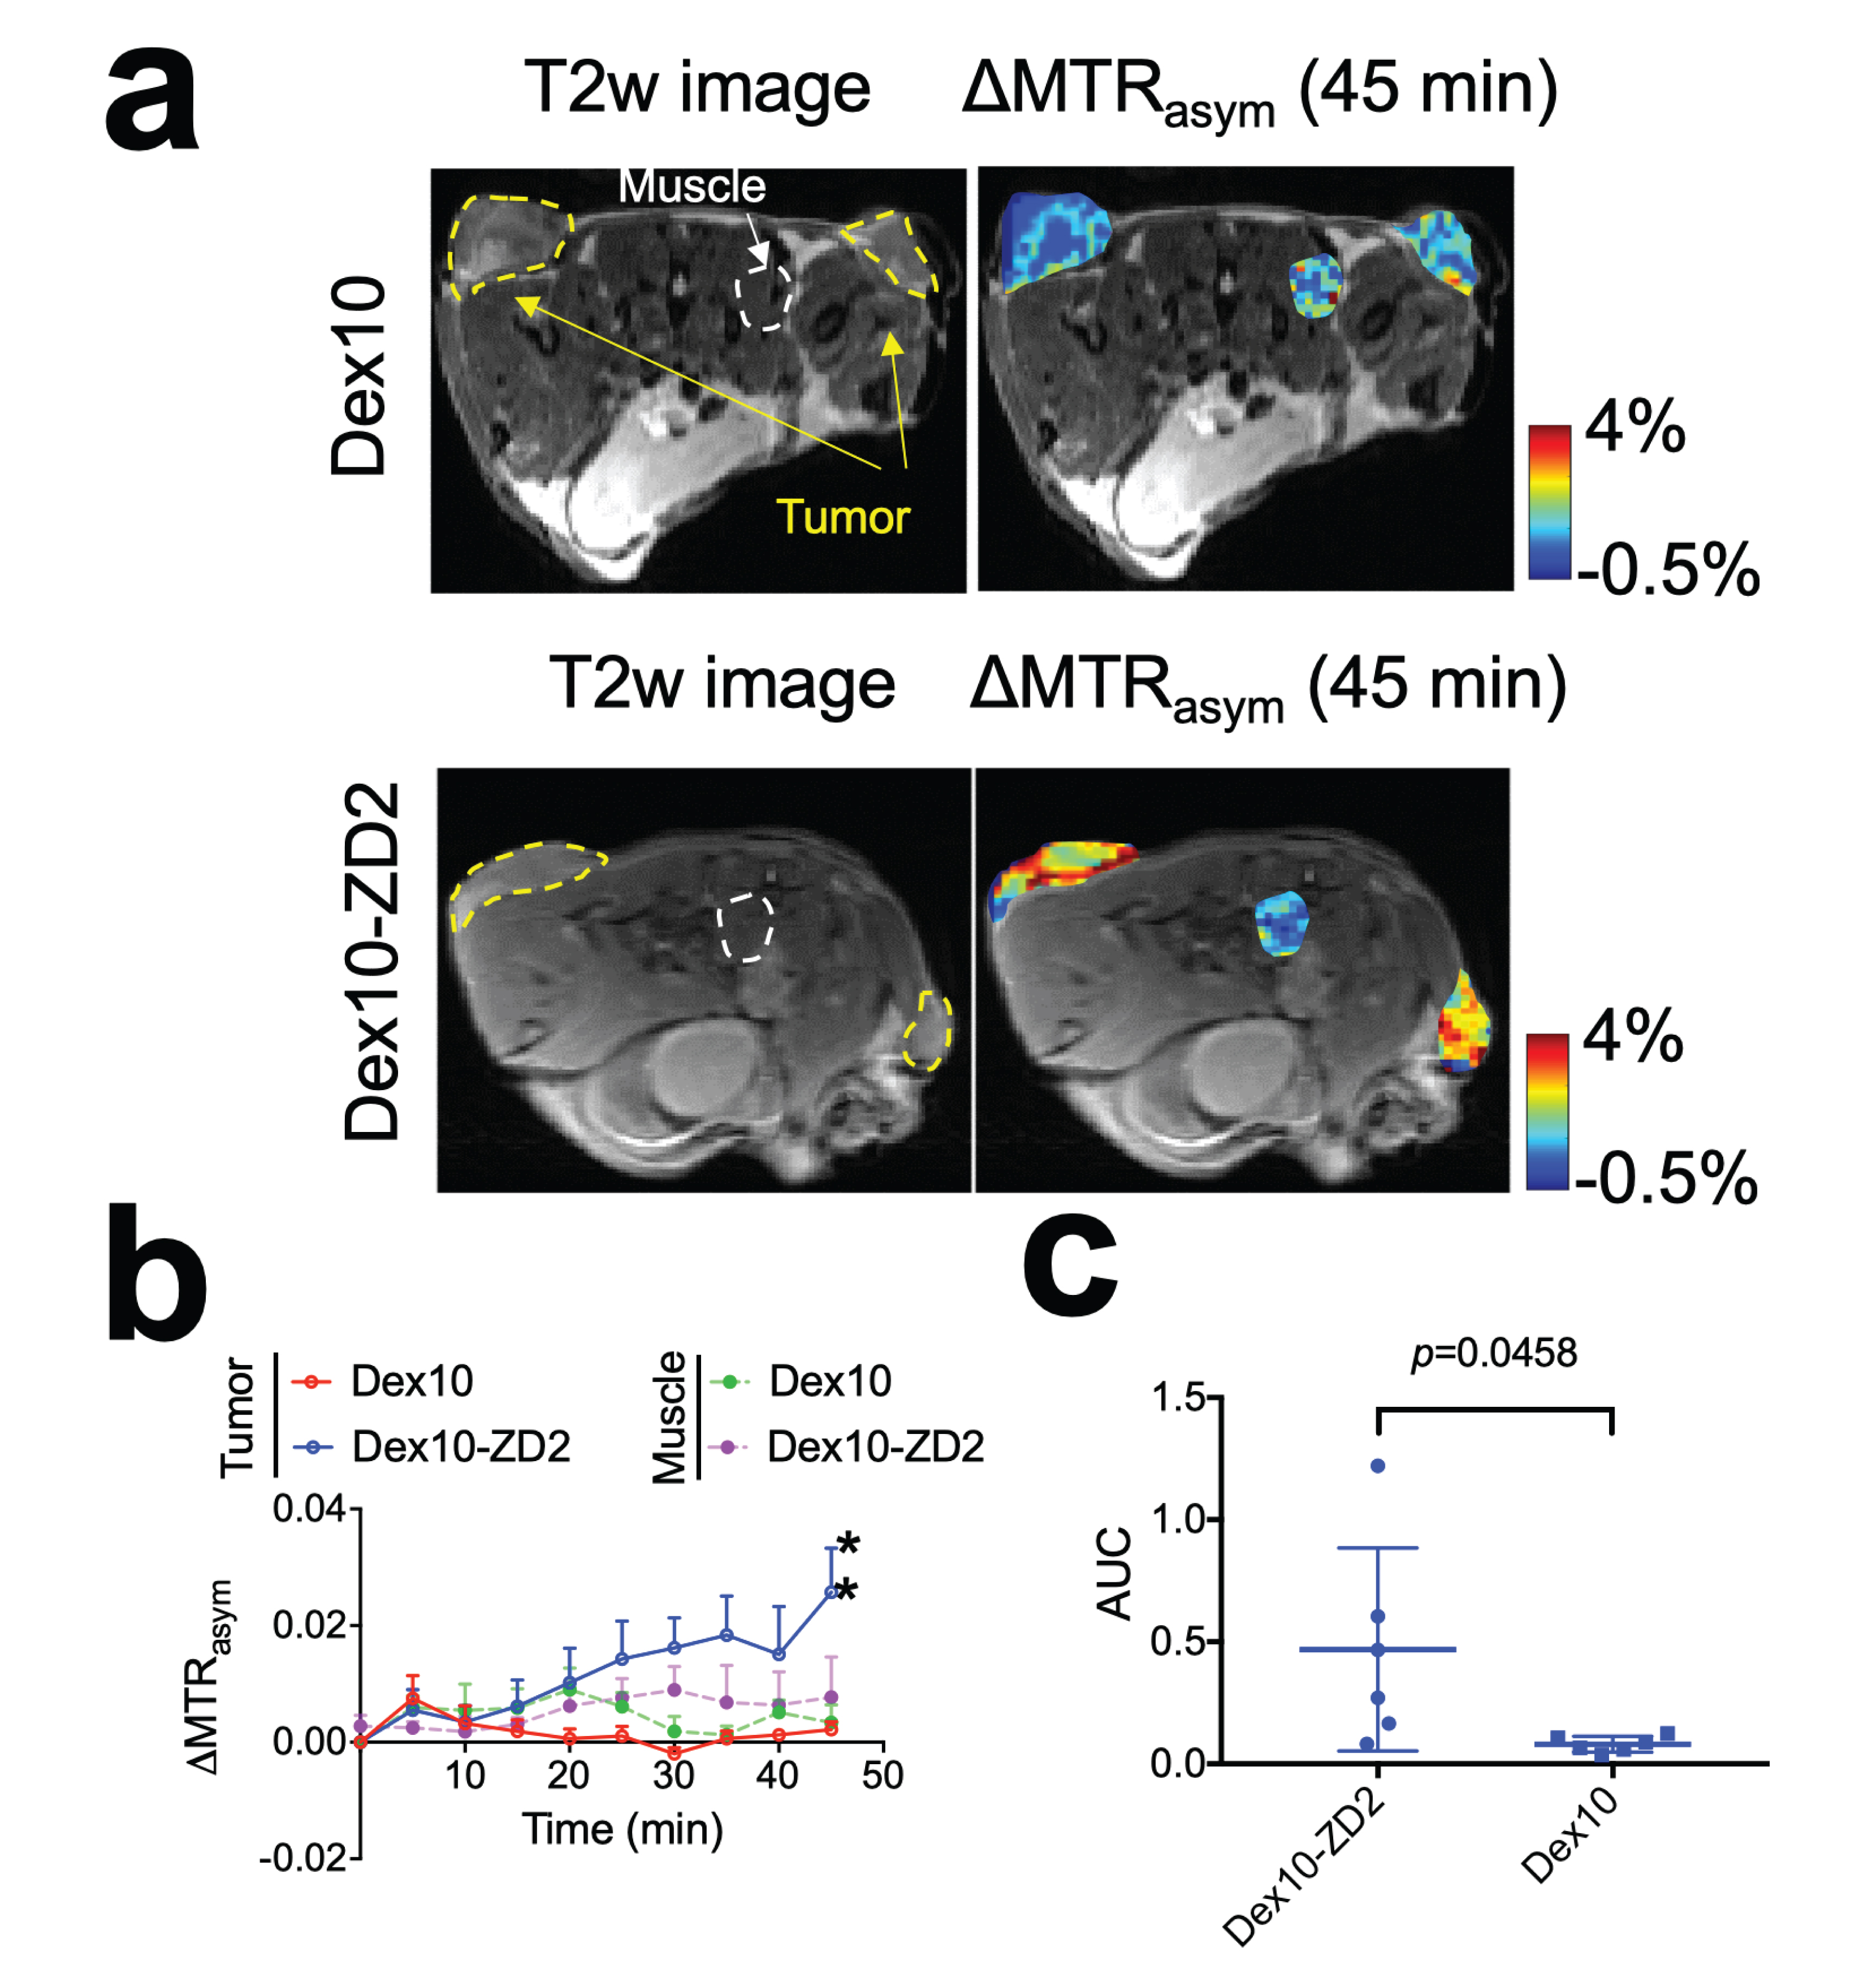
MRI. Mice (N=3, total number of tumors =6) were imaged on day 7 after inoculation using an 11.7 T Bruker Biospec horizontal scanner. CEST MRI was performed before and after the i.v. injection of 200 µL dex10 or dex10-ZD2 saline solution (500 mg/kg b.w), using parameters: B1= 1.8 µT, Tsat= 3 s, Δω = -3 to +3 ppm with a step size of 0.2 ppm. MTRasym=(S-Δω – S+Δω)/S0 was computed after the B0 correction using the WASSR method. ΔMTRasym (1 ppm) at each time point was calculated by MTRasym (t)- MTRasym (pre). Area-under-curve (AUC) value analysis based on ∆MTRasym time-course analysis of tumors from 15-45 min.
Results
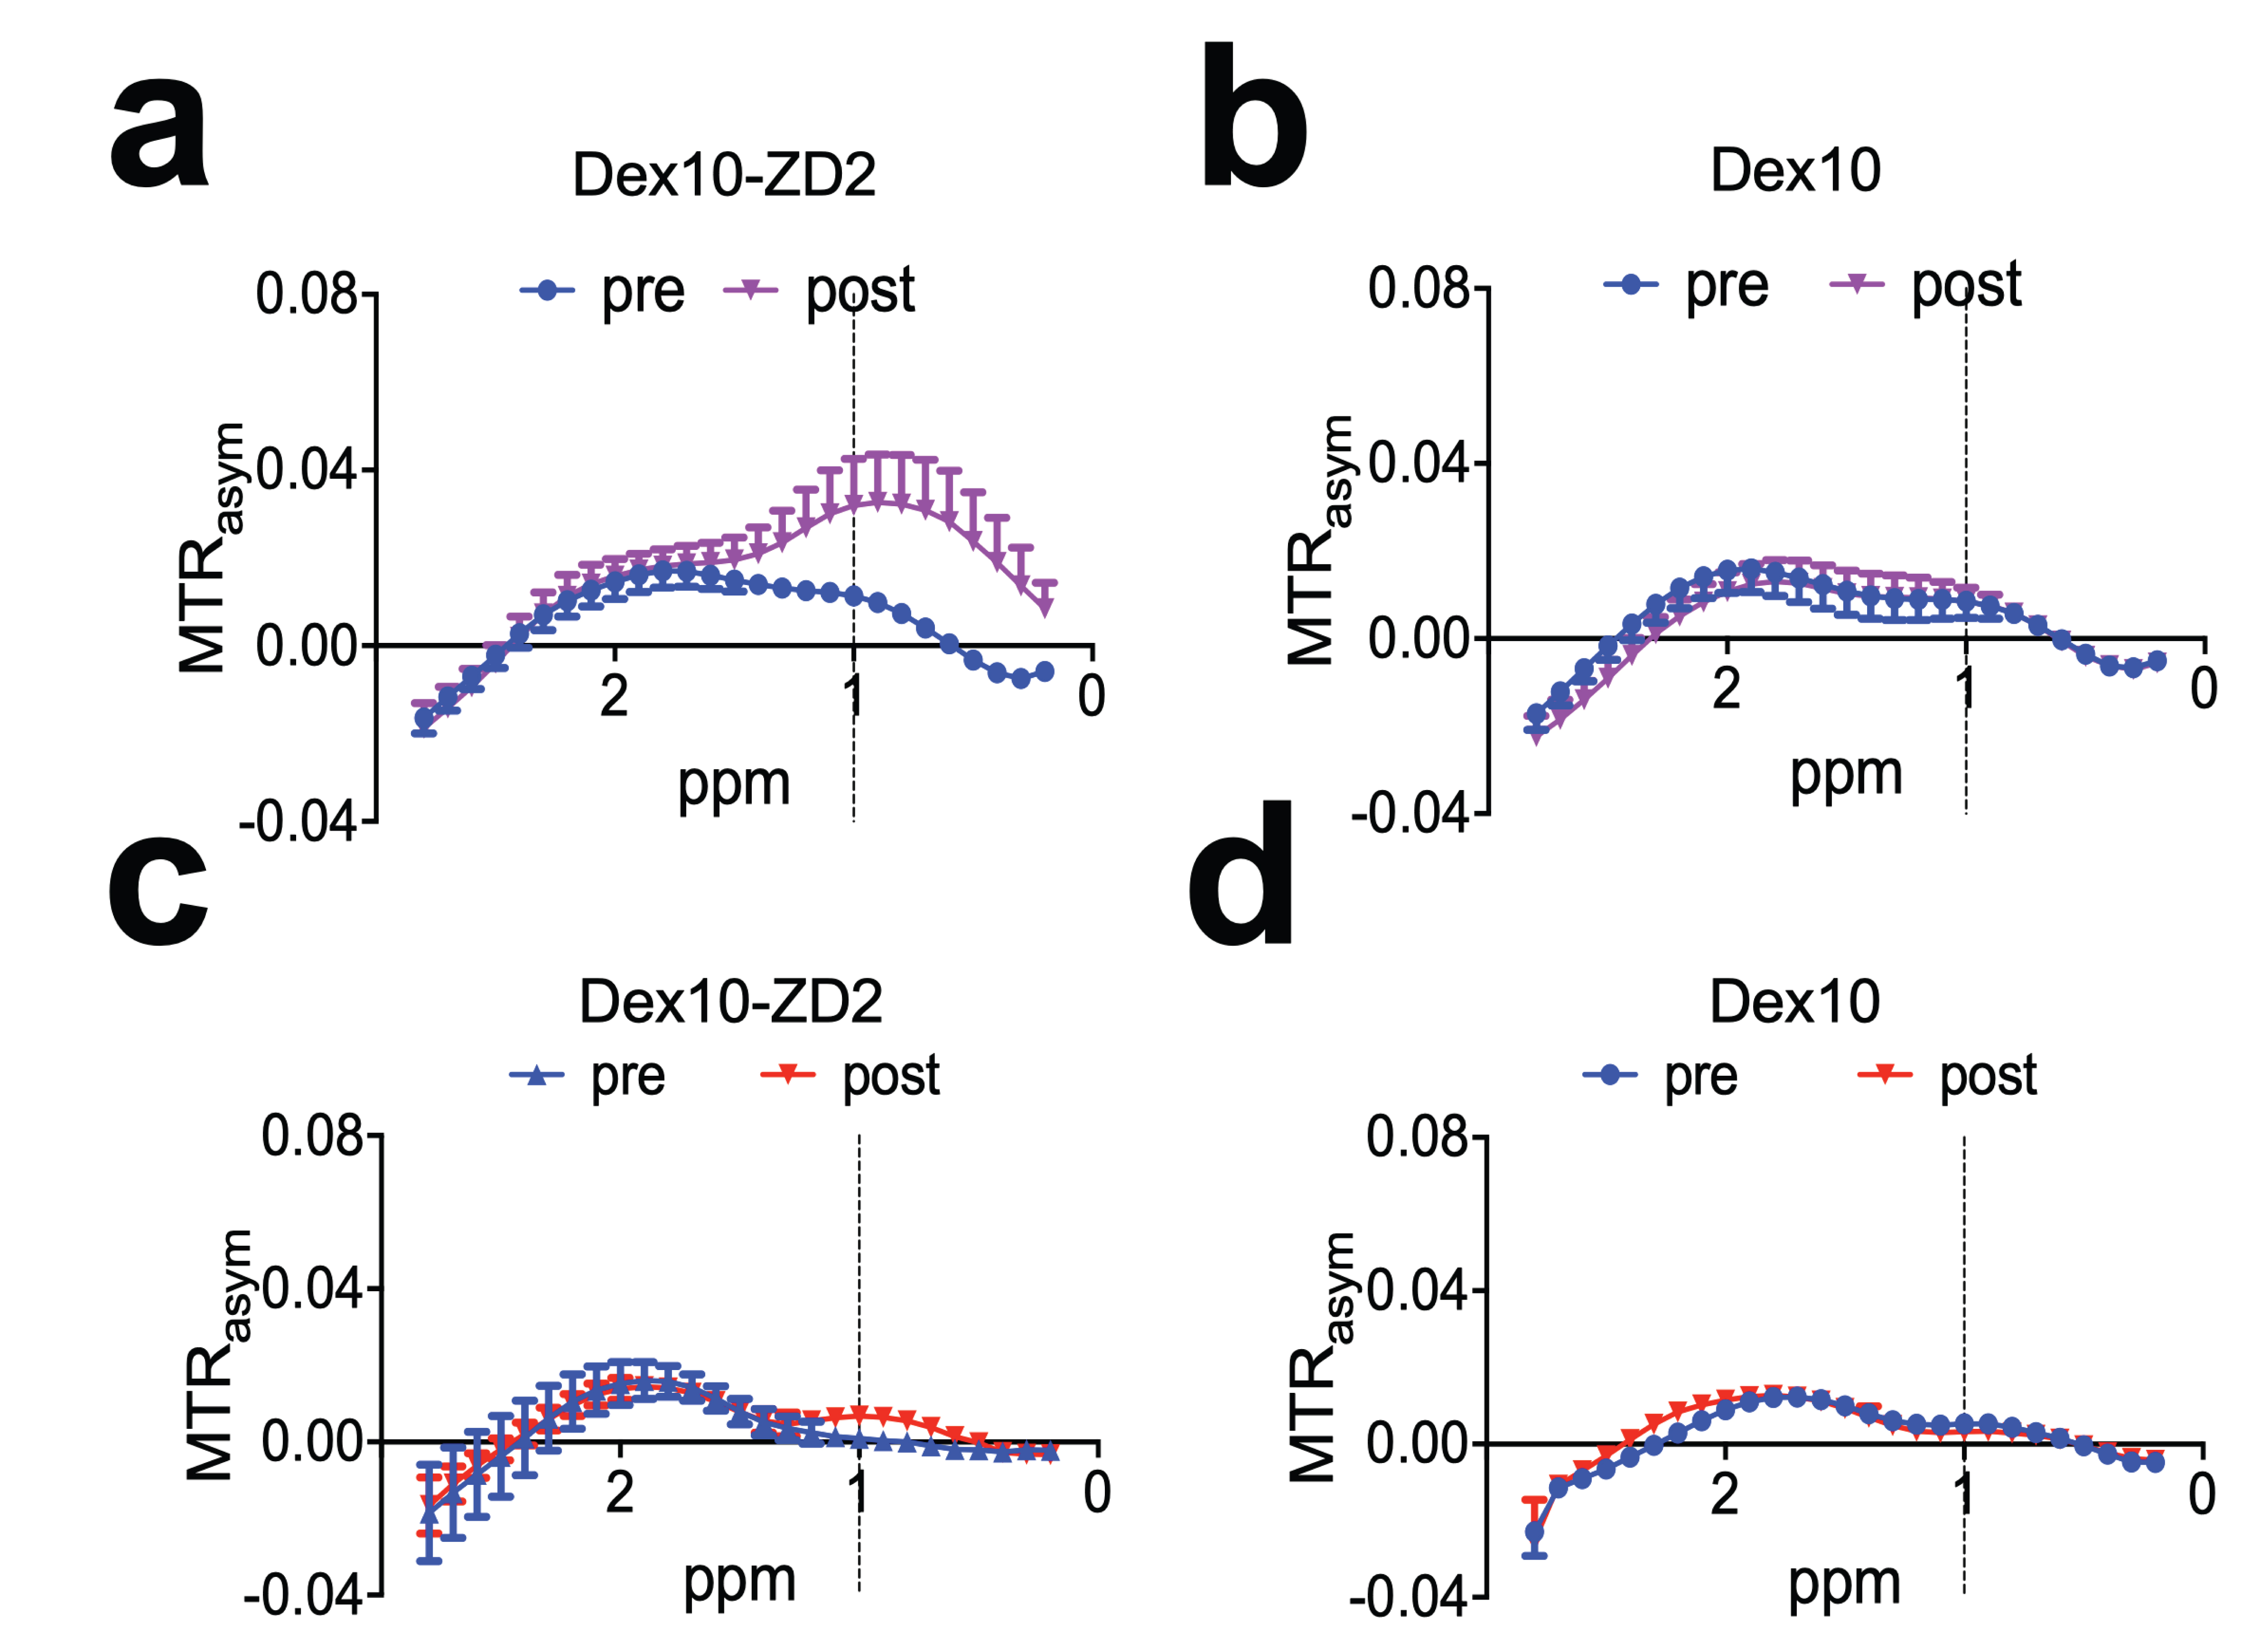
As shown in Figure 2, the injection of Dex10-ZD2 but not Dex10 (i.v. 500 mg/kg b.w.) resulted in a marked CEST MRI enhancement in the KPC tumors, exemplified by the 45 min post-contrast images shown in Figure 2a. The dynamic study (Figure 2b) revealed a similar CEST enhancement between the animals receiving Dex10 and Dex10-ZD2 at early time points (0-10 min), but a higher CEST enhancement in the tumors receiving Dex10-ZD2 than those receiving Dex10. At 45 minutes post-injection, a significant difference was observed, i.e. DMTRasym=2.6±0.8% and 0.2±0.1% for Dex10-ZD2 and Dex10 respectively (P=0.0117, N=6, two-tailed unpaired Student t-test). In contrast, muscle (internal reference) showed negligible CEST contrast enhancement at later time points after either injection. Then we used the area-under-curve analyses (AUC) between15 to 45 min post-injection to quantify the contrast enhancement due to the specific binding of Dex10-ZD2 to EDB-FN. Our results (Figure 2c) showed a significantly higher uptake of Dex10-ZD2 than Dex10 by the tumors (P<0.05, N=6, two-tailed unpaired Student t-test). Finally, ROI analyses showed a marked increase of CEST signal between 0-1.5 ppm in the tumors injected with Dex10-ZD2 (45 min post-injection) with the maximum occurred at around 0.9 ppm (Figure 3a). No significant enhancement can be seen neither in the tumors receiving Dex10 (Figure 3b) nor in the muscle (Figures 3c, 3d).Discussion
Instead of cell-surface receptors in PDAC, the present method is developed to detect the tumor microenvironment oncoprotein EDB-FN, which is more abundant and easier to access than tumor cell biomarkers. The imaging probe is designed using highly biocompatible, non-radioactive and non-metallic diamagnetic dextran, which contains abundant exchangeable hydroxyl protons, which can allow CEST MRI detection with a much higher sensitivity than small molecular MRI agents4,5.Conclusions
We developed a new CEST MRI agent for sensitive detection of the tumor microenvironment biomarker EDB-FN and demonstrated it in a murine PDAC model. This new agent consists of diamagnetic and biocompatible dextran and a targeting peptide. The biocompatibility and sensitivity of this new agent shows potential for a path to clinical translation.Acknowledgements
Supported by NIH grants R03EB021573, R01CA211087 and R21CA215860.References
1. Han, Z. & Lu, Z.R. Targeting Fibronectin for Cancer Imaging and Therapy. J Mater Chem B 5, 639-654 (2017).
2. Wagner, K., Schulz, P., Scholz, A., Wiedenmann, B. & Menrad, A. The targeted immunocytokine L19-IL2 efficiently inhibits the growth of orthotopic pancreatic cancer. Clin Cancer Res 14, 4951-4960 (2008).
3. Han, Z., et al. EDB Fibronectin Specific Peptide for Prostate Cancer Targeting. Bioconjugate Chem 26, 830-838 (2015).
4. Li, Y.G., et al. Characterization of tumor vascular permeability using natural dextrans and CEST MRI. Magn Reson Med 79, 1001-1009 (2018).
5. Liu, G.S., et al. A dextran-based probe for the targeted magnetic resonance imaging of tumours expressing prostate-specific membrane antigen. Nat Biomed Eng 1, 977-+ (2017).
Figures