0499
Increased fatty infiltration of individual extraocular muscles in myasthenia gravis and graves’ orbitopathy1Neurology and Radiology, CJ Gorter center for high field MRI, Leiden University Medical Center, Leiden, Netherlands, 2Ophthalmology and radiology, CJ Gorter center for high field MRI, Leiden University Medical Center, Leiden, Netherlands, 3Ophthalmology, Leiden University Medical Center, Leiden, Netherlands, 4Neurology, Leiden University Medical Center, Leiden, Netherlands, 5Radiology, CJ Gorter center for high field MRI, Leiden University Medical Center, Leiden, Netherlands
Synopsis
We explored the feasibility of 7 Tesla quantitative MRI for quantifying fat fraction and muscle volume of individual extraocular muscles in myasthenia gravis (MG) and Graves’ orbitopathy (GO) patients and healthy controls. The Dixon scans show a high reproducibility for individual extraocular muscles. The fat fractions are higher in MG and GO patients than in healthy controls. Quantitative MRI of individual extraocular muscles may provide a first step to understand the pathophysiology and pattern of muscle involvement of the eyes in MG and GO patients.
Purpose
To explore the feasibility of quantitative MRI in the assessment of fat fraction and volume of individual eye muscles in myasthenia gravis and Graves’ orbitopathy.Background
The auto-immune disease myasthenia gravis (MG) affects the neuromuscular junction and commonly starts with weakness of the extra-ocular muscles (EOMs), causing double vision. In Graves’ orbitopathy (GO) this diplopia develops as the result of inflammation and swelling of extraocular muscles.1 Assessment of structural changes by quantitative MRI of the individual EOMs could provide a first step to understand the pathophysiology and pattern of muscle involvement of the eyes of MG and GO patients.2 Since MRI of the EOMs is highly susceptible to artefacts and movements, especially in patients with EOM pathology, we aimed to study the feasibility of performing Dixon MR-Imaging of individual EOMs using a previously developed cued blinking paradigm3.Methods and materials
Seven healthy subjects (22-49 years, 56% male), 9 MG patients (28-71 years, 60% male) and 5 active GO patients (28-64 years, 43% male) were scanned on a 7 Tesla MRI (Philips Achieva), using a cued-blinking paradigm3 and the upper 16 elements of a 32-channel head-coil (Nova Medical). A 3-point Dixon scan was acquired (0.7x0.7x1.0mm3 resolution, TE/TR/FA:2.4ms/10ms/3°). In 7 MG patients and 5 healthy volunteers, a second Dixon scan was acquired (0.8x0.8x0.4 mm3 resolution, TE/TR/FA:2.4ms/10ms/3°). Scans were reconstructed with seven-peak reconstruction using the manufacturer’s software.
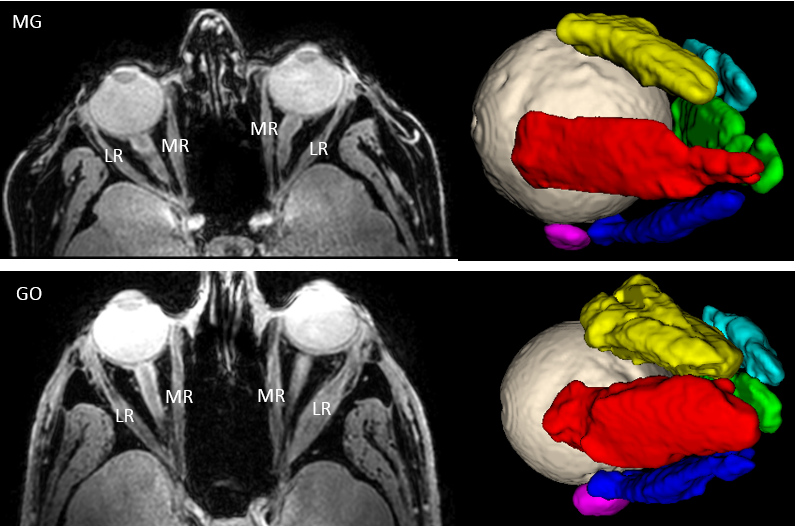
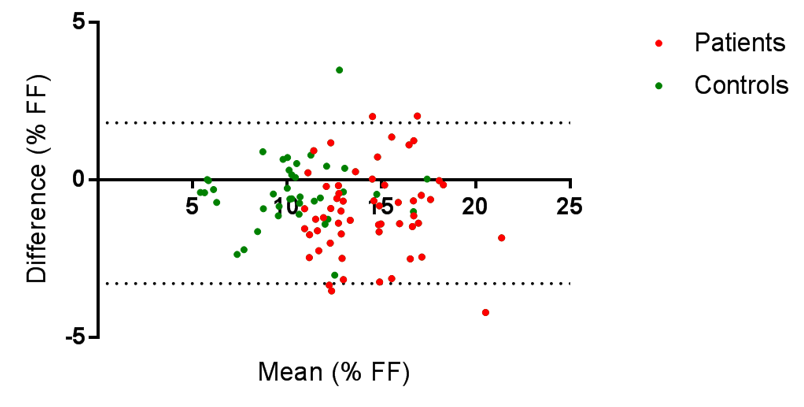
The EOMs were automatically 3D-segmented on the water image, using a seed-growing algorithm with a manually set threshold for each subject in ITK-SNAP4 (Figure 1). The fat fractions (FF) and the mean 3D-area of the EOM’s were determined using an in-house developed MATLAB script and eroded with one acquisition voxel. The level of agreement between the FF’s of the two Dixon scans was calculated for all participants. The FFs per EOM were compared in the two different DIXON scans using a Bland-Altman plot. Mean FFs and muscle volumes were compared using two-tailed t-tests.
Results
The scan protocol was well tolerated by all subjects. In one patient the second Dixon scan was excluded from the analysis due to motion artefacts. The level of agreement between the two Dixon scans was -0,9% [95% confidence interval(95%CI): -3,3%; 1,5%] for all participants. In the MG patient group the level of agreement were similar (1,0% [-3,7%; 1,7%]) (figure 2).
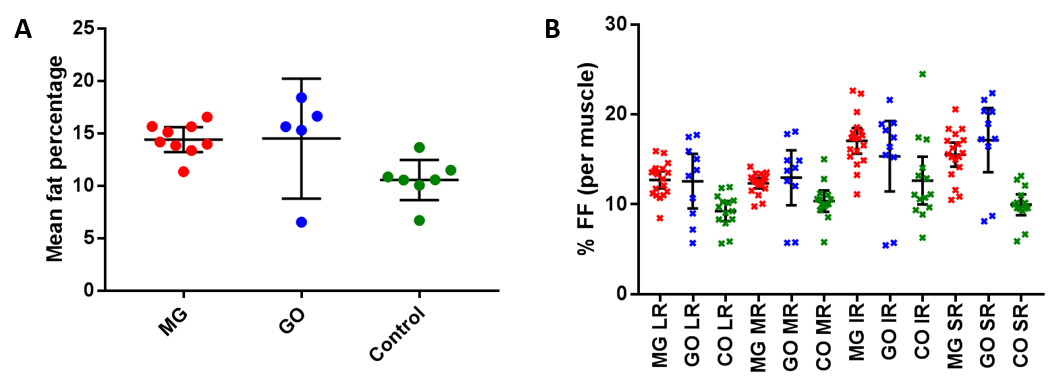
The mean FF of the EOMs in MG patients (14,4%; 95%CI 13,2-15,6) and GO patients (14,5%; 95%CI: 8,8-20,2) were higher than in healthy controls (10,6%; 95%CI: 8,6-12,5; p<0,001 for MG vs healthy controls).The difference in FF appeared to be highest in the superior and inferior rectus muscles (figure 3). The fatty infiltration seems to be generally located at the distal end of the muscle.
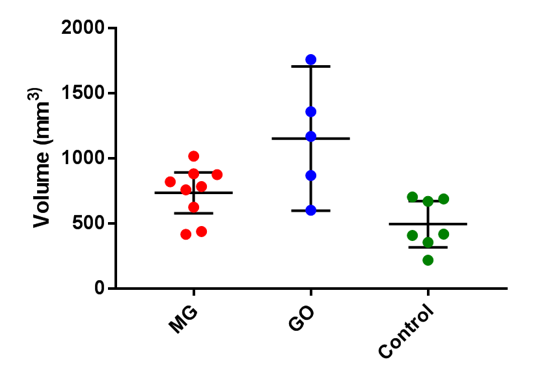
The mean muscle 3D-volumes of the four recti muscles were higher in GO patients(1.2 cm3; 95%CI: 0.6 cm3-1.7 cm3) than in MG patients (0.7 cm3; 95%CI: 0.6cm3-0.9 cm3) and healthy controls (0.5cm3; 95%CI: 0.3cm3-0.7cm3) (figure 4).
Discussion
Quantitative MRI is feasible for measuring FFs and muscle volumes of individual EOMs in MG and GO patients. The scan-to-scan reproducibility showed a measurement error of 2.5% in the FF, which is lower than the difference found between the patients and the controls (i.e ~4%). The difference of 1% in the FF between the two Dixon scans is most likely explained by the magnitude of erosion in both scans due to their different resolution.
Furthermore, the measured FFs of the EOMs were higher in MG and GO patients compared to the healthy controls and the muscle volumes were higher in the GO patients. While swollen EOMs are a common finding in GO patients5, the increase in FF in these active GO patients was surprising. Increased FF has been observed in late-stage GO patients6. In MG patients we expected to find muscle atrophy, due to a decrease in muscle activity, however muscle volumes were comparable to healthy controls. In addition, the increased FF observed in the EOMs of MG patients is not compatible with current knowledge about the pathophysiology of MG: auto-antibodies targeting the neuromuscular junction would be expected to cause inflammatory changes rather than fatty infiltration.
Conclusion
Quantitative MRI can provide structural information on individual extraocular muscles in patients with diseases causing diplopia, such as myasthenia gravis and Graves’ orbitopathy. Surprisingly, our results show increased fatty infiltration of the EOM’s of MG patients and increased muscle volumes in GO patients, highlighting the usefulness of quantitative MRI to investigate the pathophysiology and patterns of muscle involvement in the orbit.Acknowledgements
Martine Jager (Ophthalmology, LUMC, Leiden, Netherlands) for stimulating discussion.References
1. Rebecca S. Bahn, M.D., Graves’ Ophthalmopathy. N Engl J Med. 2010 Feb 25; 362(8): 726–738.
2. Mercuri E, Pichiecchio A, Allsop J, Messina S, Pane M, Muntoni F. Muscle MRI in inherited neuromuscular disorders: past, present, and future. J Magn Reson Imaging 2007;25:433-440.
3. Beenakker JWM, Rijn van GA, Luyten GPM et al. High-resolution MRI of uveal melanoma using a microcoil phased array at 7 T. NMR Biomed. 2013 (12):1864-1869.
4. Paul A. Yushkevich, Joseph Piven, Heather Cody Hazlett, Rachel Gimpel Smith, Sean Ho, James C. Gee, and Guido Gerig. User-guided 3D active contour segmentation of anatomical structures: Significantly improved efficiency and reliability. Neuroimage 2006 Jul 1;31(3):1116-28.
5. Nagy EV1, Toth J, Kaldi I, Damjanovich J, Mezosi E, Lenkey A, Toth L, Szabo J, Karanyi Z, Leovey A. Graves' ophthalmopathy: eye muscle involvement in patients with diplopia. Eur J Endocrinol. 2000 Jun;142(6):591-7.
6. Parmar H., Ibrahim M. Extrathyroidal manifestations of thyroid disease: thyroid ophthalmopathy. Neuroimaging Clin N Am. 2008 Aug;18(3):527-36.
Figures