0497
Behavioural intervention in myotonic dystrophy type 1 assessed by longitudinal MRI of skeletal muscles1Radiology and Nuclear Medicine, Radboud university medical center, Nijmegen, Netherlands, 2Neurology, Radboud university medical center, Nijmegen, Netherlands, 3Neuromuscular Reference Center, Henri Mondor university Hospital, Paris, France, 4Radiology, Henri Mondor university Hospital, Paris, France
Synopsis
A behavioural intervention, directed to increase physical activity, had a beneficial effect on lower extremity muscle function in patients with myotonic dystrophy type 1 (DM1). Here, we evaluated potential causes of the effect of this intervention with quantitative MRI in the 20 lower extremity muscles of 27 DM1 patients. We showed that it leads to a ~4% average increase in muscle mass, especially in healthy appearing muscle. Fat infiltration was not decelerated. Therefore, we conclude that some muscles in DM1 patients are trainable, preferably early on in the course of the disease.
Purpose
Myotonic dystrophy type 1 (DM1) is characterized by muscle degeneration resulting in progressive muscle weakness.1,2 Recently, we showed that a behavioural intervention, aimed to increase physical activity, significantly improved lower extremity muscle function in DM1 patients.3 Understanding the causes improving muscle function is essential to get insight in the trainability of muscles in DM1.4,5 This can studied by quantifying pathophysiological processes in muscles, like fat infiltration, atrophy, and oedema, with MRI.6 Therefore, we evaluated the effect of the behavioural intervention on fat infiltration and muscle mass in the 20 lower extremity muscles of 27 DM1 patients with a longitudinal quantitative MRI study.Material and Methods
Subjects
We included 27 DM1 patients, 14 patients were randomized to the behavioural intervention (age: 45±12 y, 7 male) and 13 to standard care (age: 45±13 y, 8 male). The intervention comprised 10 months cognitive behavioural therapy, optionally combined with graded exercise in addition to standard care.
Data collection
Lower extremity muscle function was assessed with a six-minute walking test (6MWT). Furthermore, all patients underwent an MRI scan (Siemens 3T) of the lower extremity at baseline and 10-month follow-up, using a spine/phased array coil combination.
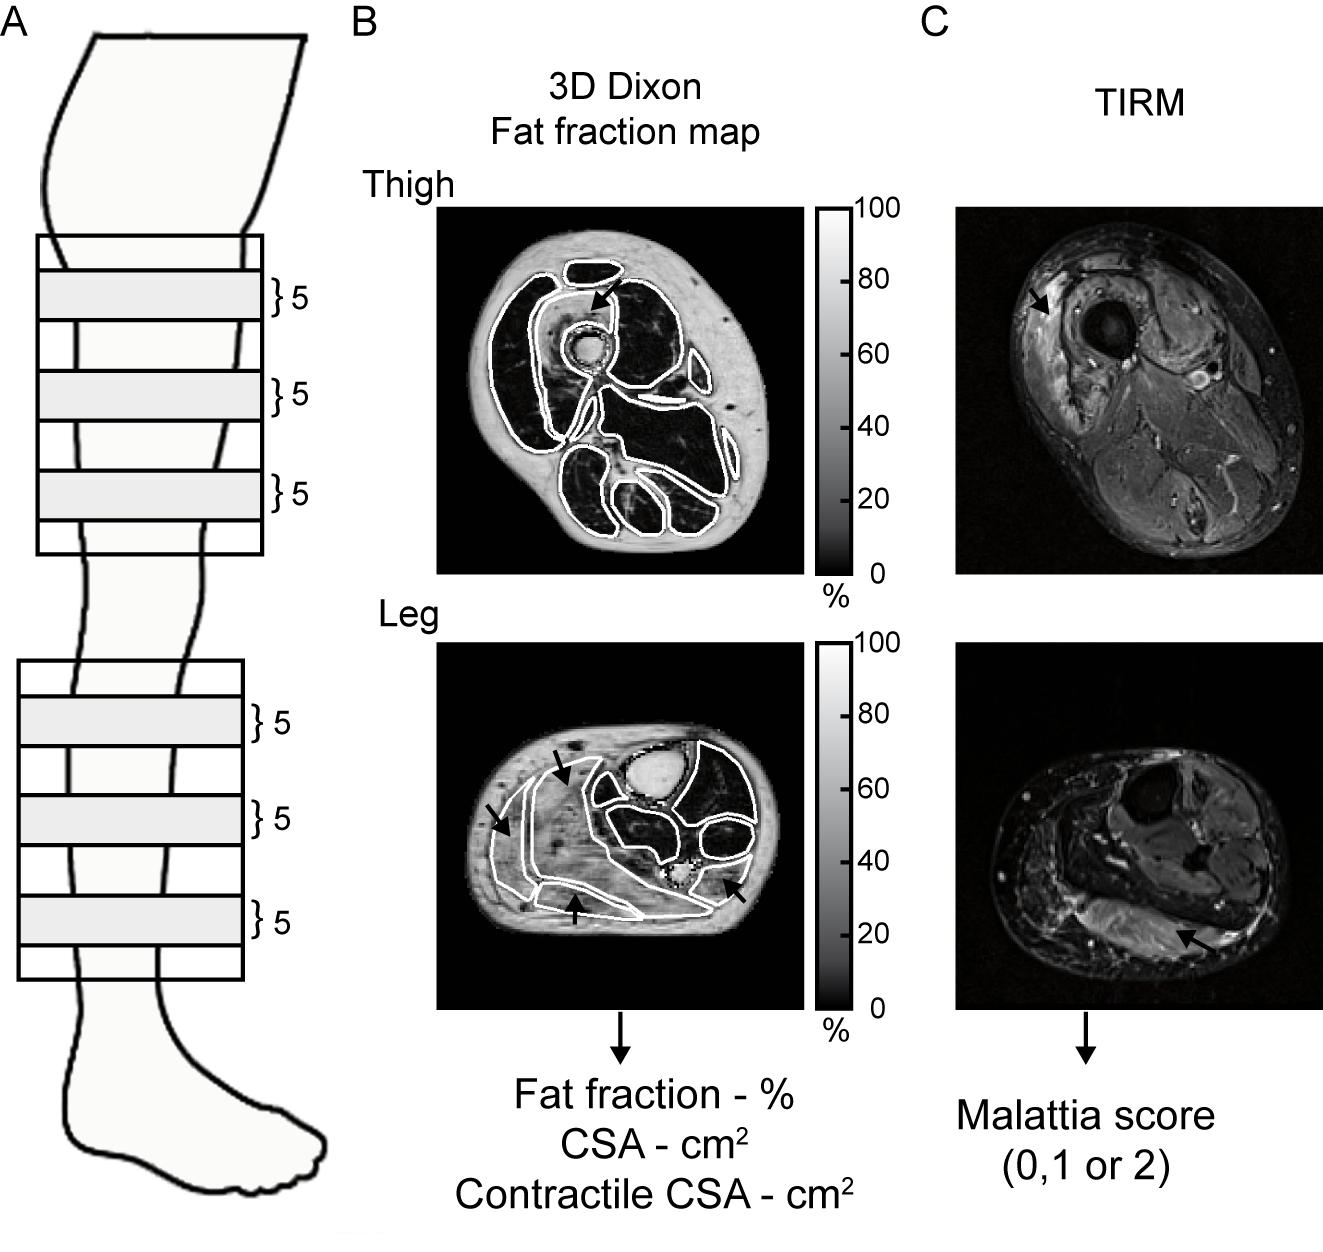
Water and fat images were acquired by a 3D Dixon sequence, either a 2pt-Dixon (TR/TE1/TE2: 10/2.45/3.675ms, FA: 3°, voxel size: 1x1x5mm3, slices: 32) or 3pt-Dixon (TE1/TE2/TE3: 2.31/3.68/5.07ms). A turbo inversion recovery magnitude (TIRM) sequence was applied to detect the presence of oedema (TR/TE: 4000/41ms, inversion time: 220ms, voxel size: 1x1x5mm3, slices: 27, slice gap: 0mm).
Post-processing
The fat and water images were processed to a fat fraction map (0-100% fat), on which the 20 muscles were manually delineated on five distal, middle and proximal slices (Fig.1A/B). For each muscle, fat fraction (FF) was calculated as the average over all voxels of these 15 slices. Furthermore, the cross-sectional area (CSA) was determined at a single slice; for the leg and thigh, the last slice were the flexor digitorum longus or biceps femoris short head was visible, respectively (Fig.1B). Contractile CSA (cCSA: CSA×(1-FF)) was calculated as a measure for remaining muscle tissue.
To assess changes over 10 months, we combined for each subject the individual muscle outcomes to a value for the lower extremity by taking the average over all muscle for FF and the sum of all muscles for CSA and cCSA. The within-group and between-group 10-month changes were assessed with paired-samples t-tests and independent-samples t-tests, respectively.
Thereafter, we performed an in-depth analysis on individual muscles to study whether the 10-month change depended on presence of fat infiltration and oedema at baseline. Muscles were defined as fat infiltrated (yes/no) with the fat fraction’s mean+2SD of healthy volunteers as threshold. Furthermore, muscles were categorized according to presence of oedema using the Malattia score on TIRM images (0,1,2), with 0 indicating no muscle signal abnormalities and 2 a high degree of abnormalities (Fig.1C).7 Statistical analysis was performed with a two-level linear mixed model, because muscles are nested within patients.
Results
Subject level
Changes in the 6MWT over 10 months differed significantly between groups (p=0.012) in favour of the intervention (intervention: +11±23m, standard care: -11±17m).
The MRI analysis showed no effect of the intervention on FF (p=0.558; Fig.2A). In both groups, FF increased over 10 months; 0.9%±1.0% (p=0.019) and 1.2%±1.2% (p=0.016) for the intervention and standard care, respectively. In contrast, the intervention group significantly increased their CSA (5.9±7.8cm2, p=0.029), and tended to increase cCSA (5.0±8.4cm2, p=0.093), while the standard care group had a non-significant decrease in CSA (-3.6±7.2cm2, p=0.125) and cCSA (-4.5±7.2cm2, p=0.096) (Fig.2B/C). These 10-month changes in CSA and cCSA differed significantly between the groups, p=0.007 and p=0.017, respectively (Fig.2B/C).
Individual muscle level
Compared to non-fat infiltrated muscles, those that were fat infiltrated at baseline showed a significant different change in FF, and CSA after 10 months in the intervention group (p<0.001, p=0.021, respectively; Fig.3). CSA increased more and FF increased less in non-fat infiltrated muscles vs. fat infiltrated muscles. Furthermore, the increase in FF depended on the presence of oedema for the intervention (p<0.001), with a trend for the standard care group (p=0.088), while this was not observed for CSA (Fig.4).
Conclusion and Discussion
DM1 patients who received a behavioural intervention directed to optimize daily life gained ~4% of muscle mass over 10 months treatment, especially in healthy appearing muscle. We conclude that some muscles in DM1 patients are trainable, preferable early on in the course of the disease. Even though the behavioural intervention does not decelerate fat infiltration, it can counteract this fat infiltration by increasing muscle mass sufficiently to achieve a positive clinical effect.Acknowledgements
We would like to thank all subjects for participating in this study. The OPTIMISTIC consortium is thanked for their critical remarks on the data analysis and interpretation. In addition, we would like to thank Barbara Janssen for help with the MRI protocol.References
1. Chau A, Kalsotra A. Developmental insights into the pathology of and therapeutic strategies for DM1: Back to the basics. Dev. Dyn. 2015. p. 377–390.
2. Meola G, Cardani R. Myotonic dystrophies: An update on clinical aspects, genetic, pathology, and molecular pathomechanisms. Biochim Biophys Acta - Mol Basis Dis; 2015;1852:594–606.
3. Okkersen K, Jimenez-Moreno C, Wenninger S, et al. Cognitive behavioural therapy with optional graded exercise therapy in patients with severe fatigue with myotonic dystrophy type 1: a multicentre, single-blind, randomised trial. Lancet Neurol. 2018;4422:1–10.
4. Hammarén E, Kjellby-Wendt G, Lindberg C. Muscle force, balance and falls in muscular impaired individuals with myotonic dystrophy type 1: A five-year prospective cohort study. Neuromuscul Disord.; 2015;25:141–148.
5. Gagnon C, Petitclerc E, Kierkegaard M, Mathieu J, Duchesne E, Hebert LJ. A 9-year follow-up study of quantitative muscle strength changes in myotonic dystrophy type 1. J Neurol; 2018;265:1698–1705.
6. Carlier PG, Marty B, Scheidegger O, et al. Skeletal Muscle Quantitative Nuclear Magnetic Resonance Imaging and Spectroscopy as an Outcome Measure for Clinical Trials. J Neuromuscul Dis. 2016;3:1–28.
7.Malattia C, Damasio MB, Madeo A, et al. Whole-body MRI in the assessment of disease activity in juvenile dermatomyositis. Ann Rheum Dis. 2014;73:1083–1090.
Figures