0495
Quantification of water T1 and fat fraction in inclusion body myositis using MR fingerprinting with water and fat separation (MRF-WF)1NMR Laboratory, Institute of Myology, NIC, Paris, France, 2NMR Laboratory, CEA, DRF, IBFJ, MIRCen, Paris, France
Synopsis
We evaluated the accuracy of MR fingerprinting with water and fat separation (MRF-WF) in 22 patients with inclusion body myositis and investigated the potential of water T1 for monitoring disease activity in this inflammatory myopathy characterized by a combination of inflammatory and myodegenerative features. FF and B1 values derived from MRF-WF were highly correlated to reference values and we observed a significant relationship between water T1 and water T2 in the patients. MRF-WF may represent a competitor to the multi-component fitting of MSME data, or to the IDEAL-CPMG method to simultaneously extract biomarkers of disease progression and activity in neuromuscular diseases.
Introduction
Quantitative T1 mapping might represent an appealing alternative to water T2 (T2H2O) maps for monitoring disease activity in neuromuscular disorders (NMDs), knowing it has been extensively validated to monitor inflammation, necrosis or fibrosis in myocardial tissues1. Nevertheless, none of the T1 mapping sequences optimized for cardiac applications is able to separate the contribution of water and fat protons. Even more, when directly applied to fatty infiltrated skeletal muscles, a “global” T1 value would mainly reflect the degree of intramuscular fat and the other underlying processes previously mentioned would largely be hidden. Recently, we proposed an MRF sequence which separates water and fat (MRF-WF), allowing simultaneous estimation of the apparent B1, water T1 (T1H2O) and fat fraction (FF) in skeletal muscles2. In this study, we evaluated the accuracy of the different MRF-WF variables in patients suffering from inclusion body myositis (IBM). We also investigated the potential of T1H2O for monitoring disease activity in this idiopathic inflammatory myopathy characterized by a combination of inflammatory and myodegenerative features3.Method
NMR experiments were carried out on a 3T clinical scanner (PRISMAFit, Siemens) on 22 patients with IBM (10 men, mean age = 64.9±9.3 years old) in the legs and thighs. The body coil was used for RF transmission and a set of flexible matrix coils for signal reception.
The MRF-WF sequence was acquired with a 1400 radial spokes FLASH echo train following non-selective inversion and a golden angle sampling scheme. The echo time (TE), repetition time (TR) and prescribed flip angle (FA) were varied throughout the acquisition2. Other sequence parameters were: BW = 790 Hz/px, FOV = 350 mm2, resolution = 1x1mm2, slice thickness = 8 mm, Tacq = 10s/slice, 5 slices. For each slice, 175 images were reconstructed using view sharing and a compressed sensing algorithm with total variation regularization in both space and time dimensions4. The bi-component fitting previously proposed2 was applied to generate T1H2O, FF and apparent transmit field (B1) maps from the MRF-WF signals. For all subjects, reference B1 maps were derived from an XFL sequence5, (TE/TR = 1.78/4750 ms, flip angle = 8°). Reference FF was quantified using the standard 3pt-Dixon method6 on a GRE sequence at 3 different TE (TE1/TE2/TE3/TR = 2.75/3.95/5.15/10 ms). Finally, T2H2O maps were obtained by fitting the signal decay of a multi-slice multi-spin echo (MSME) sequence (17 echoes from 9.5 ms to 165.5 ms, TR = 3000 ms, nominal flip angles =90/180°) with a tri-exponential model7 that takes into account both water and fat components in the muscle tissue.
All variables were measured in regions of interest manually drawn in the different muscles in 5 slices at the thigh and leg levels.
Results
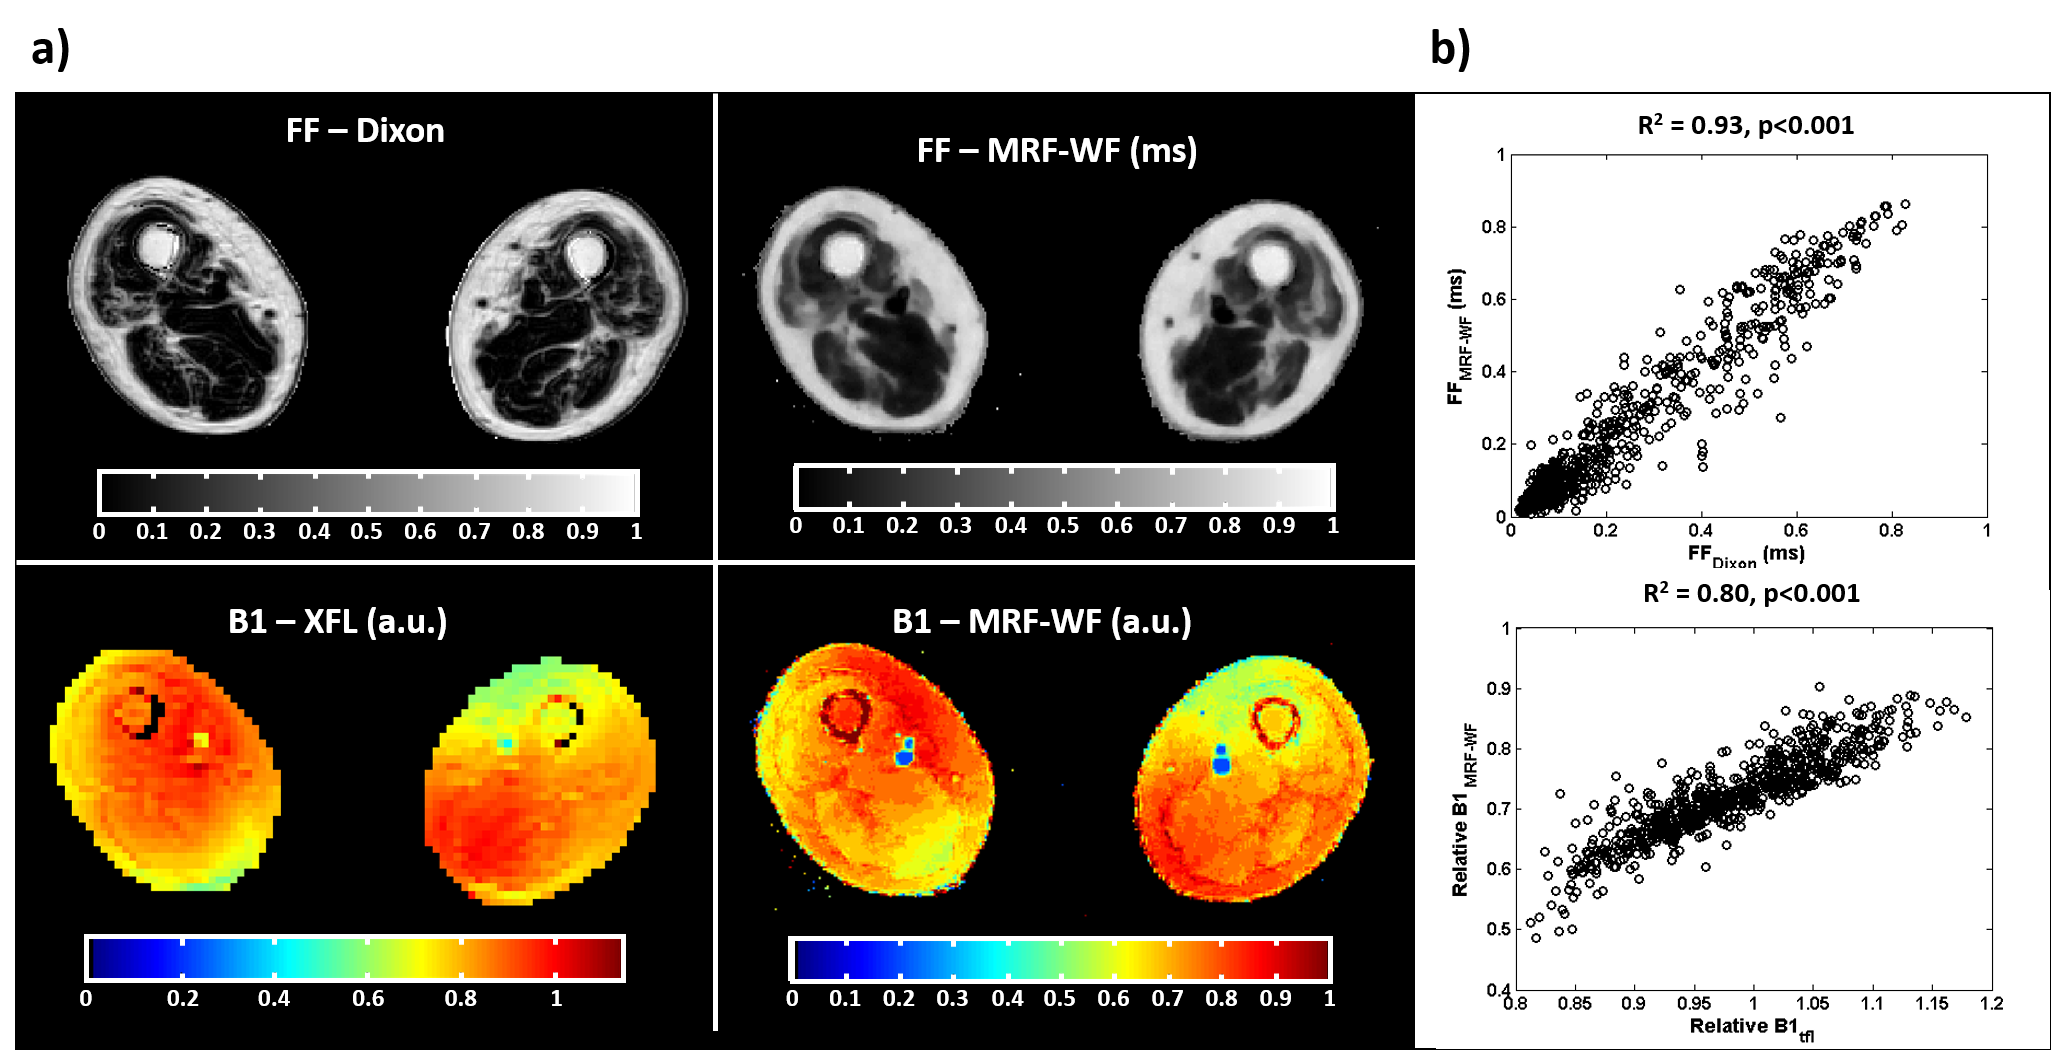
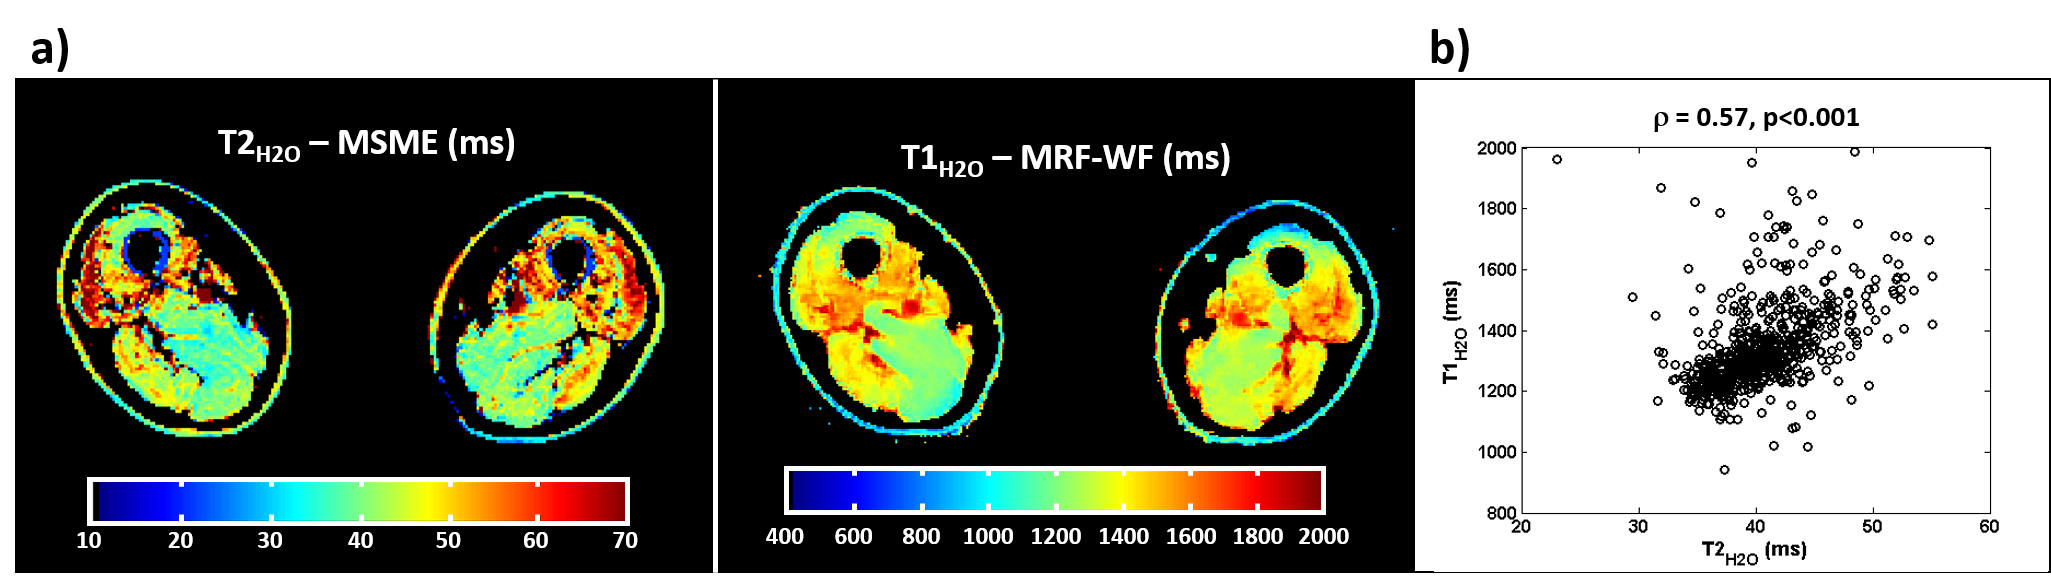
Figure 1-a exhibits representative FF and B1 maps obtained on a 60 y.o. patient using the reference techniques (Dixon and XFL) and MRF-WF at one slice level in the thighs. On this patient, the quadriceps as well as sartorius and gracilis muscles presented mild fatty infiltrations, which were retrieved on the FF map derived from MRF-WF. Both B1 maps looked very similar and exhibited the standard transmit field inhomogeneity pattern generally observed at the thigh level at 3T. On the whole patient cohort, FF and B1 values derived from MRF-WF were highly correlated to the reference values (Pearson correlation, R2 = 0.93 and 0.80, respectively, p<0.001, figure 1-b). The T2H2O map derived from MSME and the T1H2O map obtained by MRF-WF exhibited similar features, with higher values in the quadriceps, as well as in the biceps femoris (figure 2-a). We observed a significant relationship between T1H2O and T2H2O values over the whole group of patients (Spearman correlation, ρ = 0.57, p<0.001, figure 2-b).Discussion & Conclusion
In this study, we demonstrated that the MRF-WF sequence allowed to derive accurate FF and apparent B1 values in patients with fatty infiltrated muscles. Previous studies have already shown increased T2H2O values in the skeletal muscles of IBM patients8. However, to the best of our knowledge, this is the first time a significant relationship between T1H2O and T2H2O was demonstrated in patients with muscle lesions such as in IBM. This observation is not surprising since high T2H2O values are probably caused by an increased correlation time of the water molecules; and this effect would have similar consequences on T1H2O. Given the ultra-short acquisition time and the millimeter in plane resolution achieved by our MRF-WF sequence, it could represent a competitor to the multi-component fitting of MSME data7,9, or to the IDEAL-CPMG method10 to simultaneously extract biomarkers of disease progression and activity in NMDs.Acknowledgements
No acknowledgement found.References
1- Germain P, El Ghannudi S, Jeung M-Y, Ohlmann P, Epailly E, Roy C, Gangi A. Native T1 mapping of the heart - a pictorial review. Clinical Medicine Insights. Cardiology 2014; 8:1–11.
2- Marty B, Carlier PG. Quantification of water T1 and fat fraction in skeletal muscle tissue using an optimal MR fingerprinting radial sequence (MRF-WF). Proc. ISMRM 2018, #0818.
3- Needham M, Mastaglia FL. Sporadic inclusion body myositis: A review of recent clinical advances and current approaches to diagnosis and treatment. Clinical Neurophysiology 2016; 127:1764–1773.
4- Marty B, Coppa B, Carlier PG. Monitoring skeletal muscle chronic fatty degenerations with fast T1-mapping. Eur. Radiol. 2018 Nov; 28(11); 4662-4668.
5- Amadon A, Cloos MA, Boulant N, Hang M-F, Wiggins CJ, Fautz H-P. Validation of a very fast B1-mapping sequence for parallel transmission on a human brain at 7T. Proc. ISMRM 2012, #3358.
6- Glover GH, Schneider E. Three-point Dixon technique for true water/fat decomposition with B0 inhomogeneity correction. Magn. Reson. Med. 1991; 18:371–83.
7- Azzabou N, Loureiro de Sousa P, Caldas E, Carlier PG. Validation of a generic approach to muscle water T2 determination at 3T in fat-infiltrated skeletal muscle. J. Magn. Reson. Imaging 2015; 41:645–53.
8- Yao L, Yip AL, Shrader JA, Mesdaghinia S, Volochayev R, Jansen AV, Miller FW, Rider LG Magnetic resonance measurement of muscle T2, fat-corrected T2 and fat fraction in the assessment of idiopathic inflammatory myopathies. Rheumatology 2016; 55:441-449
9- Marty B, Baudin P-Y, Reyngoudt H, Azzabou N, Araujo ECA, Carlier PG, de Sousa PL. Simultaneous muscle water T2 and fat fraction mapping using transverse relaxometry with stimulated echo compensation. NMR Biomed. 2016; 29:431–43.
10- Janiczek RL, Gambarota G, Sinclair CDJ, Yousry TA, Thornton JS, Golay X, Newbould RD. Simultaneous T₂ and lipid quantitation using IDEAL-CPMG. Magn. Reson. Med. 2011; 66:1293–302.
Figures