0492
On the magnetic field dependence of deuterium metabolic imaging (DMI)Robin A de Graaf1, Arjan D Hendriks2, Dennis W Klomp2, Chathura Kumaragamage1, Dimitri Welting2, Catalina S Arteaga de Castro2, Peter B Brown1, Scott McIntyre1, Terence W Nixon1, Jeanine J Prompers2, and Henk M De Feyter1
1Yale University, New Haven, CT, United States, 2University Medical Center Utrecht, Utrecht, Netherlands
Synopsis
Deuterium metabolic imaging (DMI) is a novel, MR-based method to spatially map metabolism. DMI has been shown to provide robust and sensitive maps of cerebral glucose metabolism in healthy volunteers and patients with brain tumors. Here the magnetic field dependence of DMI in terms of sensitivity and resolution is investigated. Using RF coils sized for animal and human studies on magnetic fields ranging from 4T to 11.7T, a supralinear magnetic field dependence of the DMI sensitivity is established. The increased sensitivity of DMI at 7T compared to 4T allows the acquisition of human brain DMI at a 1 mL spatial resolution.
Introduction
Deuterium metabolic imaging (DMI) is a novel MR-based method to spatially map metabolism [1]. The technical simplicity and robustness of DMI, together with the range and affordability of relevant deuterated substrates gives DMI high clinical potential. The applicability of DMI can be further cemented by maximizing its detection sensitivity. DMI is based on the detection of deuterium (2H), a quadrupolar nucleus with a small gyromagnetic ratio. The low 2H Larmor frequency, together with the field independent T1 and T2 relaxation constants, predicts a near-quadratic magnetic field dependence of the SNR. Here the magnetic field dependence of DMI is investigated for a range of MR systems and RF coils in order to understand the possibilities on clinical MR systems and predict the potential gains achievable at 7T.Methods
All studies were performed on 4T (Bruker), 7T (Philips) and 11.7T (Bruker) MR systems with single-turn RF surface coils tuned for 2H (26.2 MHz, 45.9 MHz and 76.7 MHz at 4T, 7T and 11.7T, respectively) and sized for animal (Ø 30 mm, 4T and 11.7 T) or human (Ø 80 mm, 4T and 7T) studies. MR system noise figures and loaded and unloaded coil Q values were measured. 2H MRS was performed with a pulse-acquire pulse sequence (TR = 333 ms) extended with phase-encoding gradients for 3D DMI (11 x 11 x 11 matrix over 220 x 220 x 220 mm for human studies and 13 x 13 x 13 matrix over 39 x 39 x 39 mm for animal studies). SNR was determined as the natural abundance 2H water signal integral (0.2 kHz integration width) divided by the RMS spectral noise level. The magnetic field dependence of the 2H SNR was modeled as SNR ~ B0n, whereby n = [1 … 2]. The spatial and spectral resolution of DMI on human brain at 4T and 7T was investigated between 50 and 115 min following oral administration of [6,6’-2H2]-glucose (0.75 g/kg).Results
Fig. 1 shows the magnetic field dependence of the 2H natural abundance water signal on rat brain post-mortem. For identical-sized RF coils (Ø 30 mm) the SNR at 11.7T is ~6.5 - 8.0x higher than at 4T, corresponding to a near-quadratic magnetic field dependence (B0n, with n ~1.7 - 1.9). Fig. 2 shows the magnetic field dependence of the 2H natural abundance water signal on human brain in vivo. The SNR at 7T is ~2.3x higher than at 4T (n = 3), corresponding to a supralinear magnetic field dependence (B0n, with n ~ 1.5). The average line widths in the 8 mL DMI volumes at 4T and 7T were 11.0 +/- 2.6 Hz (or 0.42 +/- 0.1 ppm) and 16.3 +/- 2.3 Hz (or 0.36 +/- 0.05 ppm), respectively. Fig. 3 summarizes DMI data acquired on human brain following the oral administration of [6,6’-2H2]-glucose. At a nominal spatial resolution of 8 mL (20 x 20 x 20 mm) the DMI data at 4T and 7T appear comparable, although the spectral resolution at 7T is clearly higher than at 4T. At a 1 mL resolution the 4T DMI data become unreliable (Fig. 3E/F), whereas the 2.3x SNR increase at 7T leads to a recognizable 2H spectral signature (Fig. 3G/H).Conclusions
The sensitivity of deuterium metabolic imaging (DMI) has a strong dependence on the magnetic field strength with near-quadratic (n ~ 1.7 - 1.9) and supralinear (n ~ 1.5) dependencies for RF coils suitable for animal and human studies, respectively. The near-quadratic field dependence and limited coil loading indicate that RF coil noise dominates the overall noise level for small coils. For human-sized RF coils the sample noise becomes more important, thereby pushing the magnetic field dependence into the supralinear regime. In addition to the increased sensitivity, higher magnetic fields greatly benefit from the increased spectral dispersion and resolution due to the favorable T2 and T2* relaxation times. With optimized, high-density phased array receivers, the acquisition of whole-brain DMI at a nominal spatial resolution of 1 mL is a realistic goal at 7T.Acknowledgements
This research was supported by NIH grant R01- EB014861 and the James S. McDonnell Foundation.References
[1] H. M. De Feyter, K. L. Behar, Z. A. Corbin, R. K. Fulbright, P. B. Brown, S. McIntyre, T. W. Nixon, D. L. Rothman, R. A. de Graaf, Deuterium metabolic imaging (DMI) for MRI-based 3D mapping of metabolism in vivo, Sci. Adv. 2018; 4 : eaat7314Figures
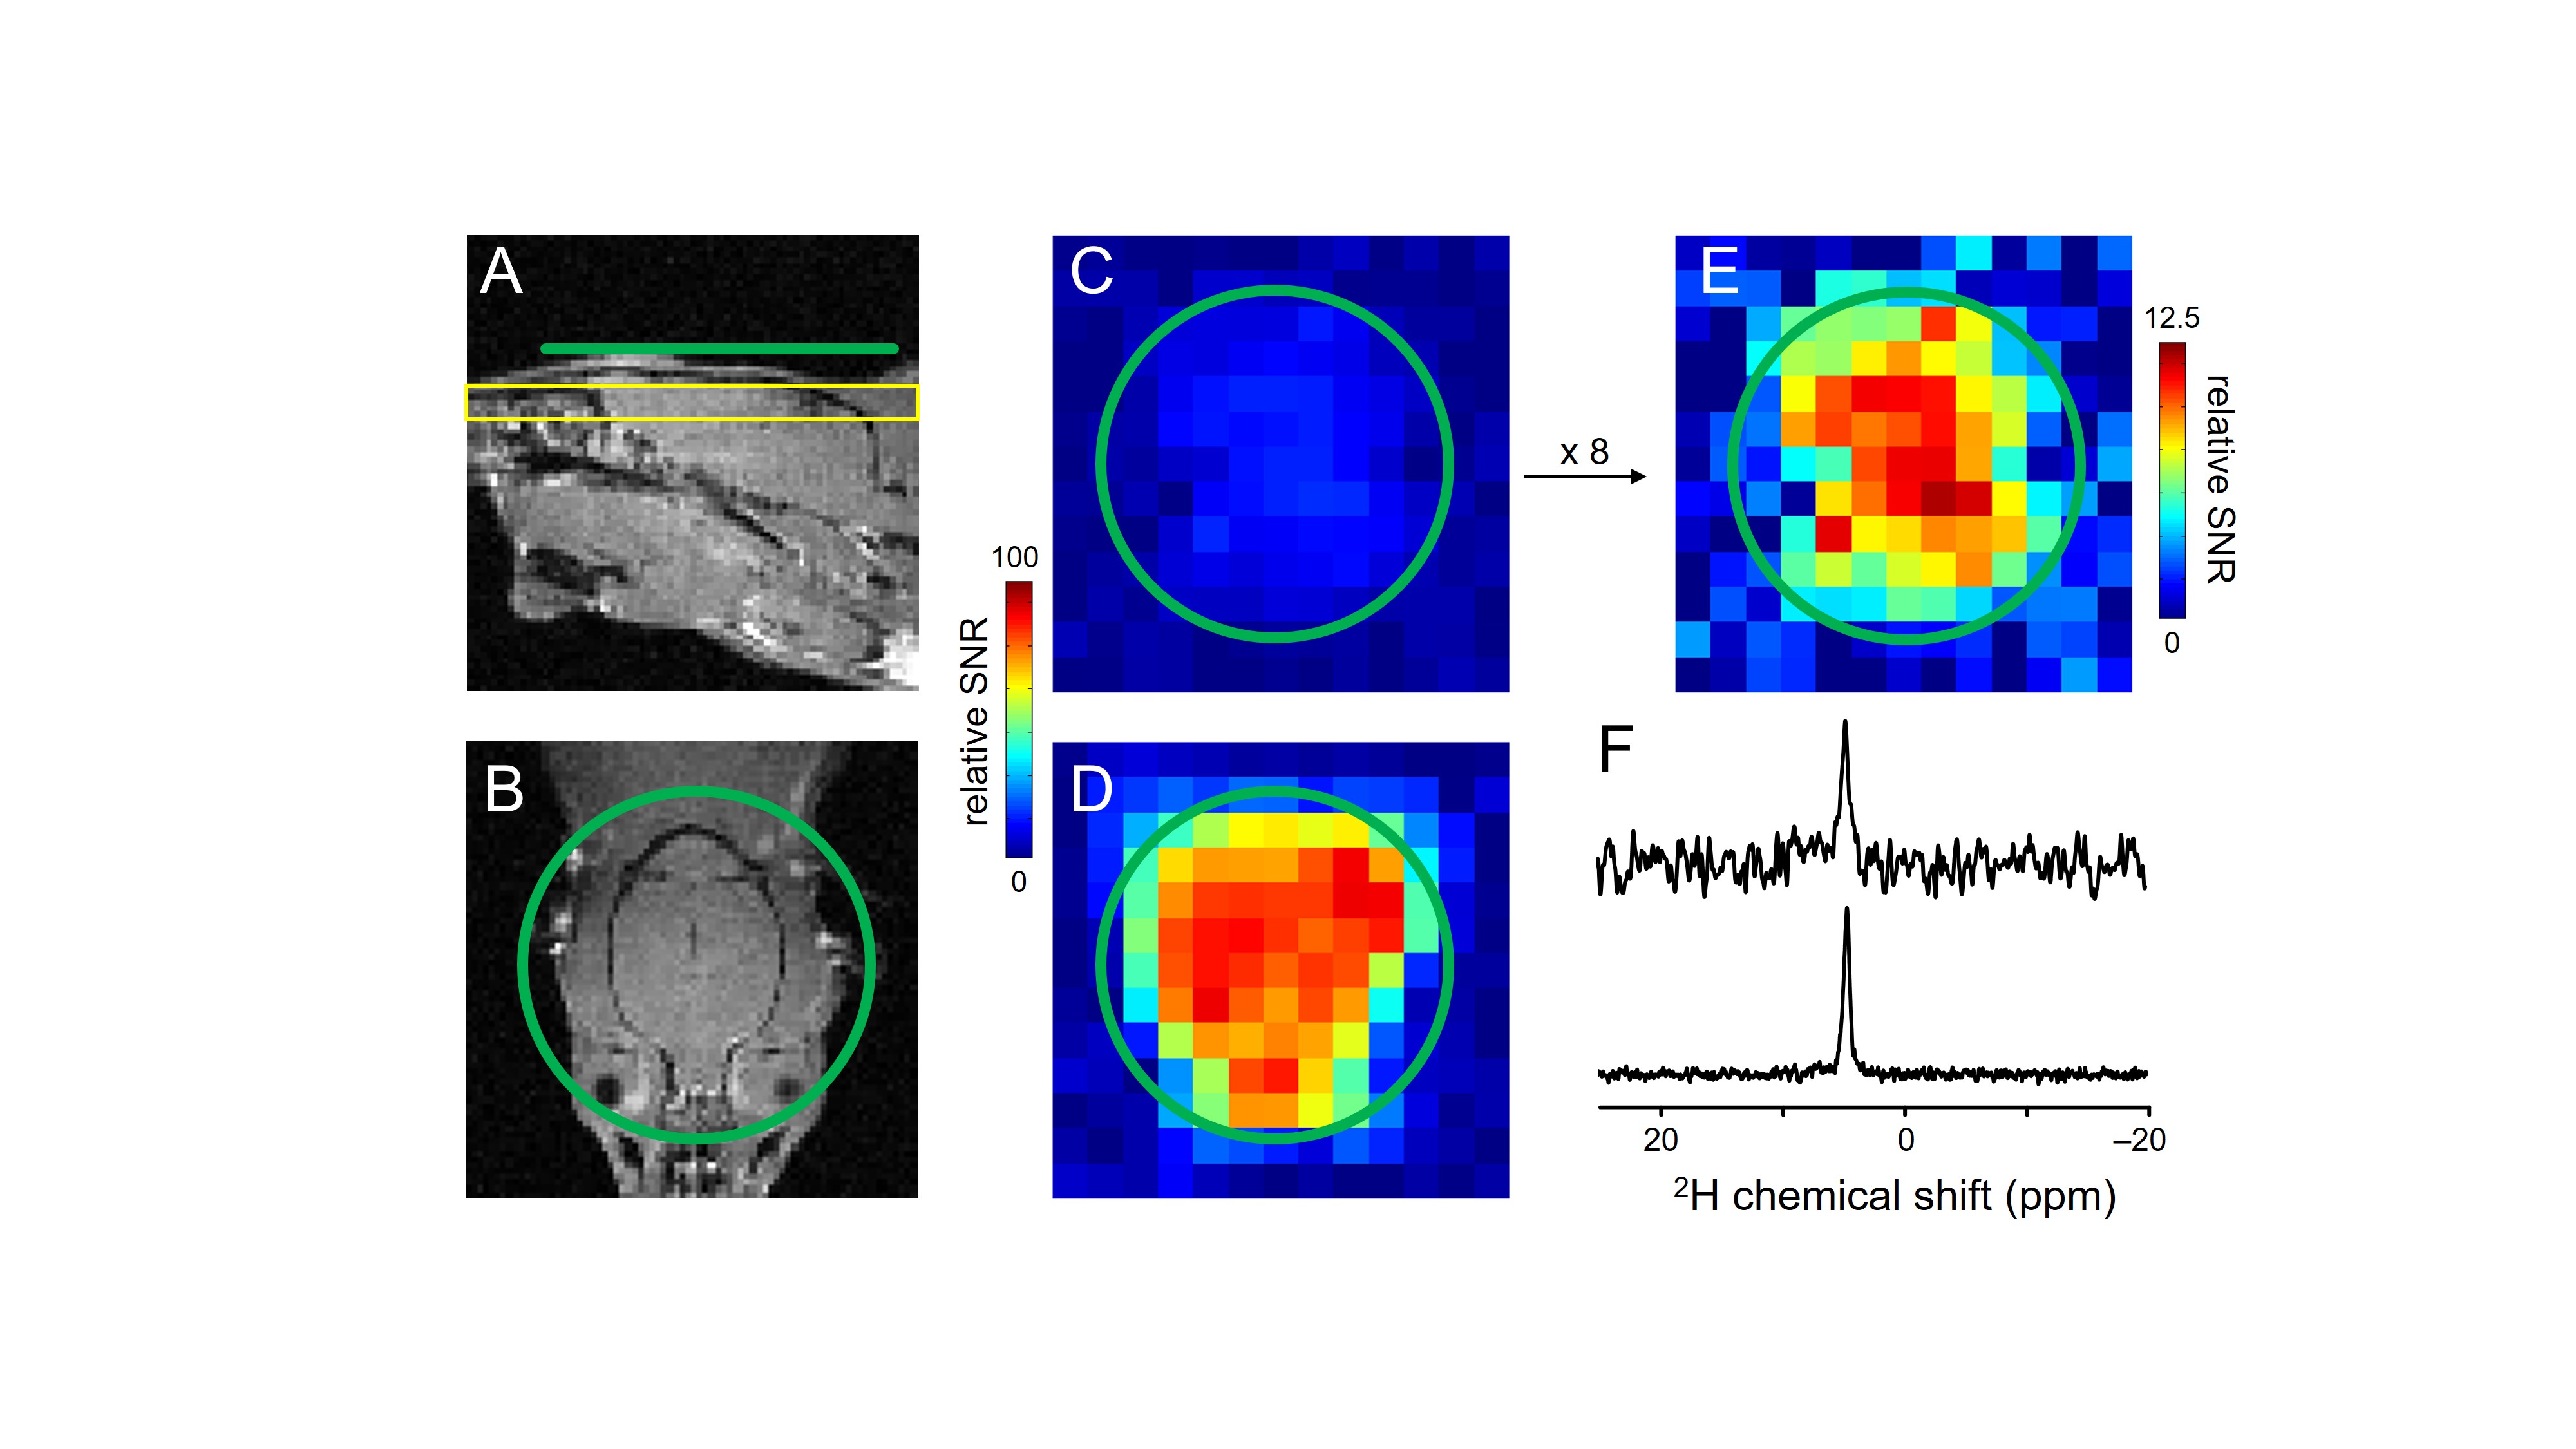
Figure 1: DMI sensitivity on rat brain post-mortem at 4T and 11.7T. (A, B) Anatomical
MRI showing the approximate surface coil position (green, Ø 30 mm). (C-E)
Sensitivity maps of natural abundance water from the position shown in (A,
yellow slice) at (C, E) 4T and (D) 11.7T. (C) and (E) are identical, except for
an 8x vertical scale increase. (F) Representative DMI spectra (27 μL)
from 4T (top) and 11.7T (bottom).
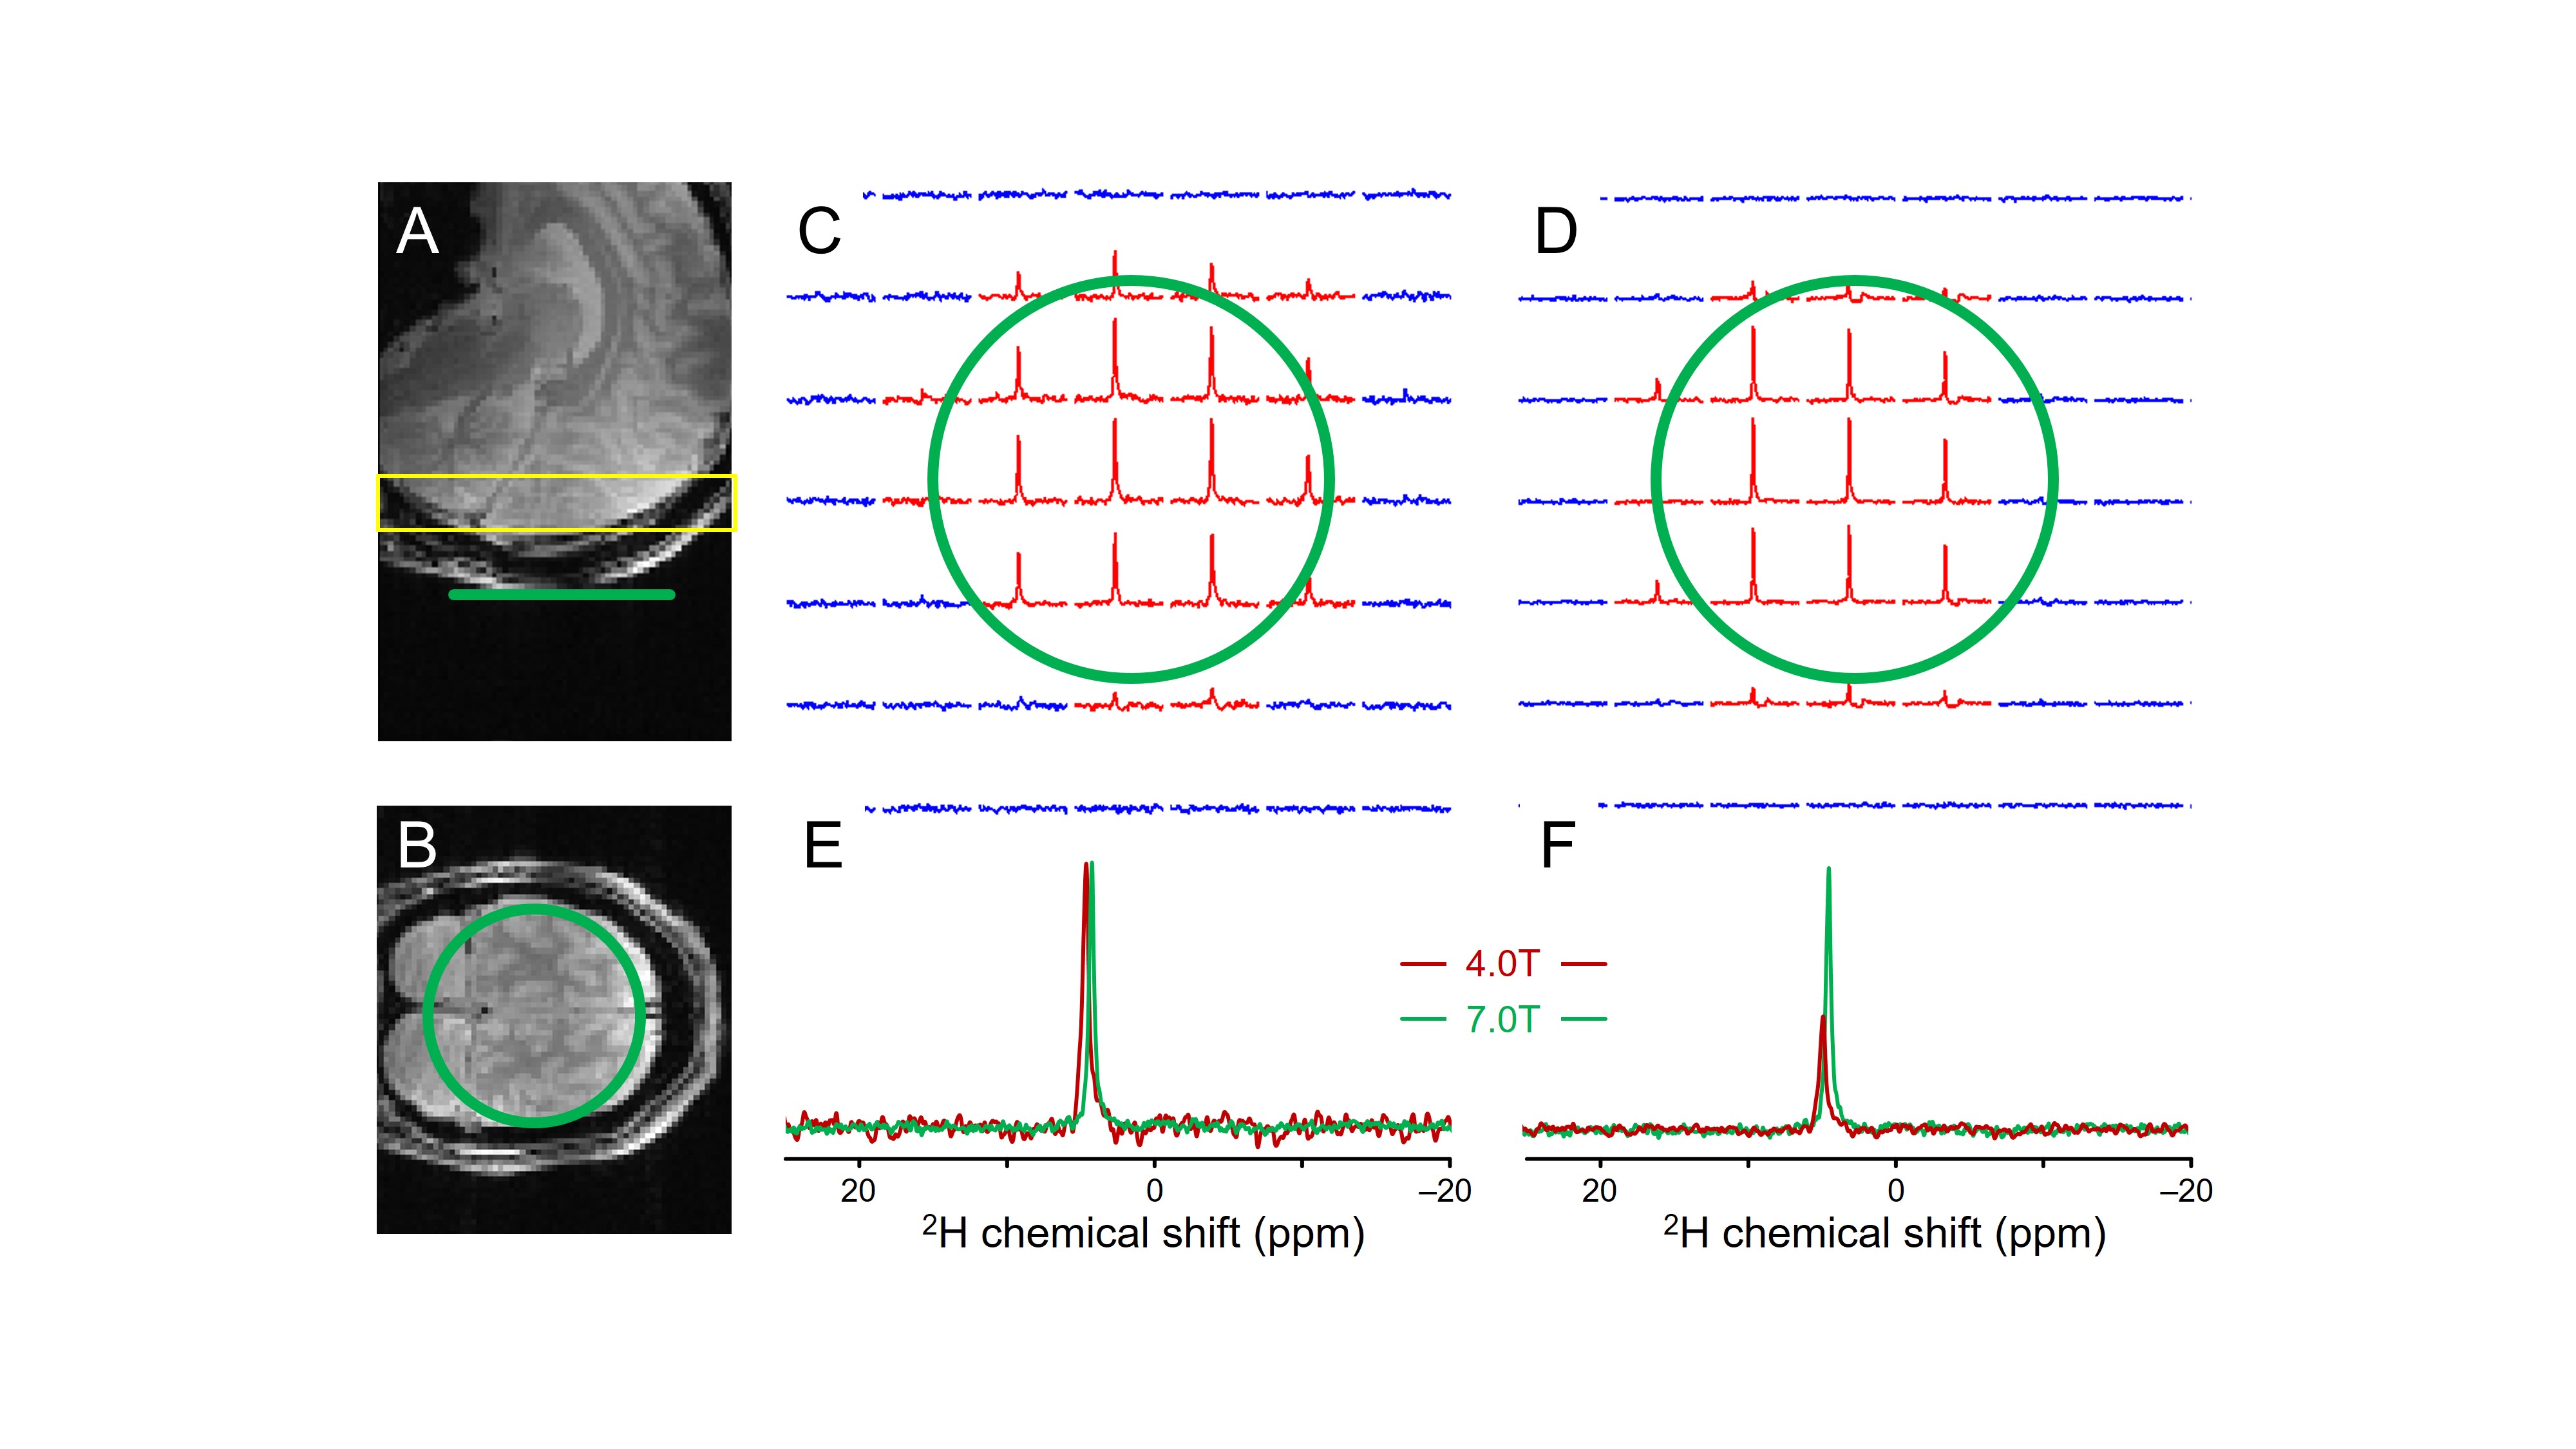
Figure 2: DMI sensitivity on human brain in
vivo at 4T and 7T. (A, B) Anatomical MRI showing the approximate surface
coil position (green, Ø 80 mm). (C, D) DMI maps of natural abundance water from
the position shown in (A, yellow slice) at (C) 4T and (D) 7T (8 mL, 30 min). Only
the inner 7x7 grid from a total 11x11x11 grid is shown. (E, F) Representative
DMI spectra from 4T (red) and 7T (green) scaled for (E) equal peak height and
(F) equal noise level.
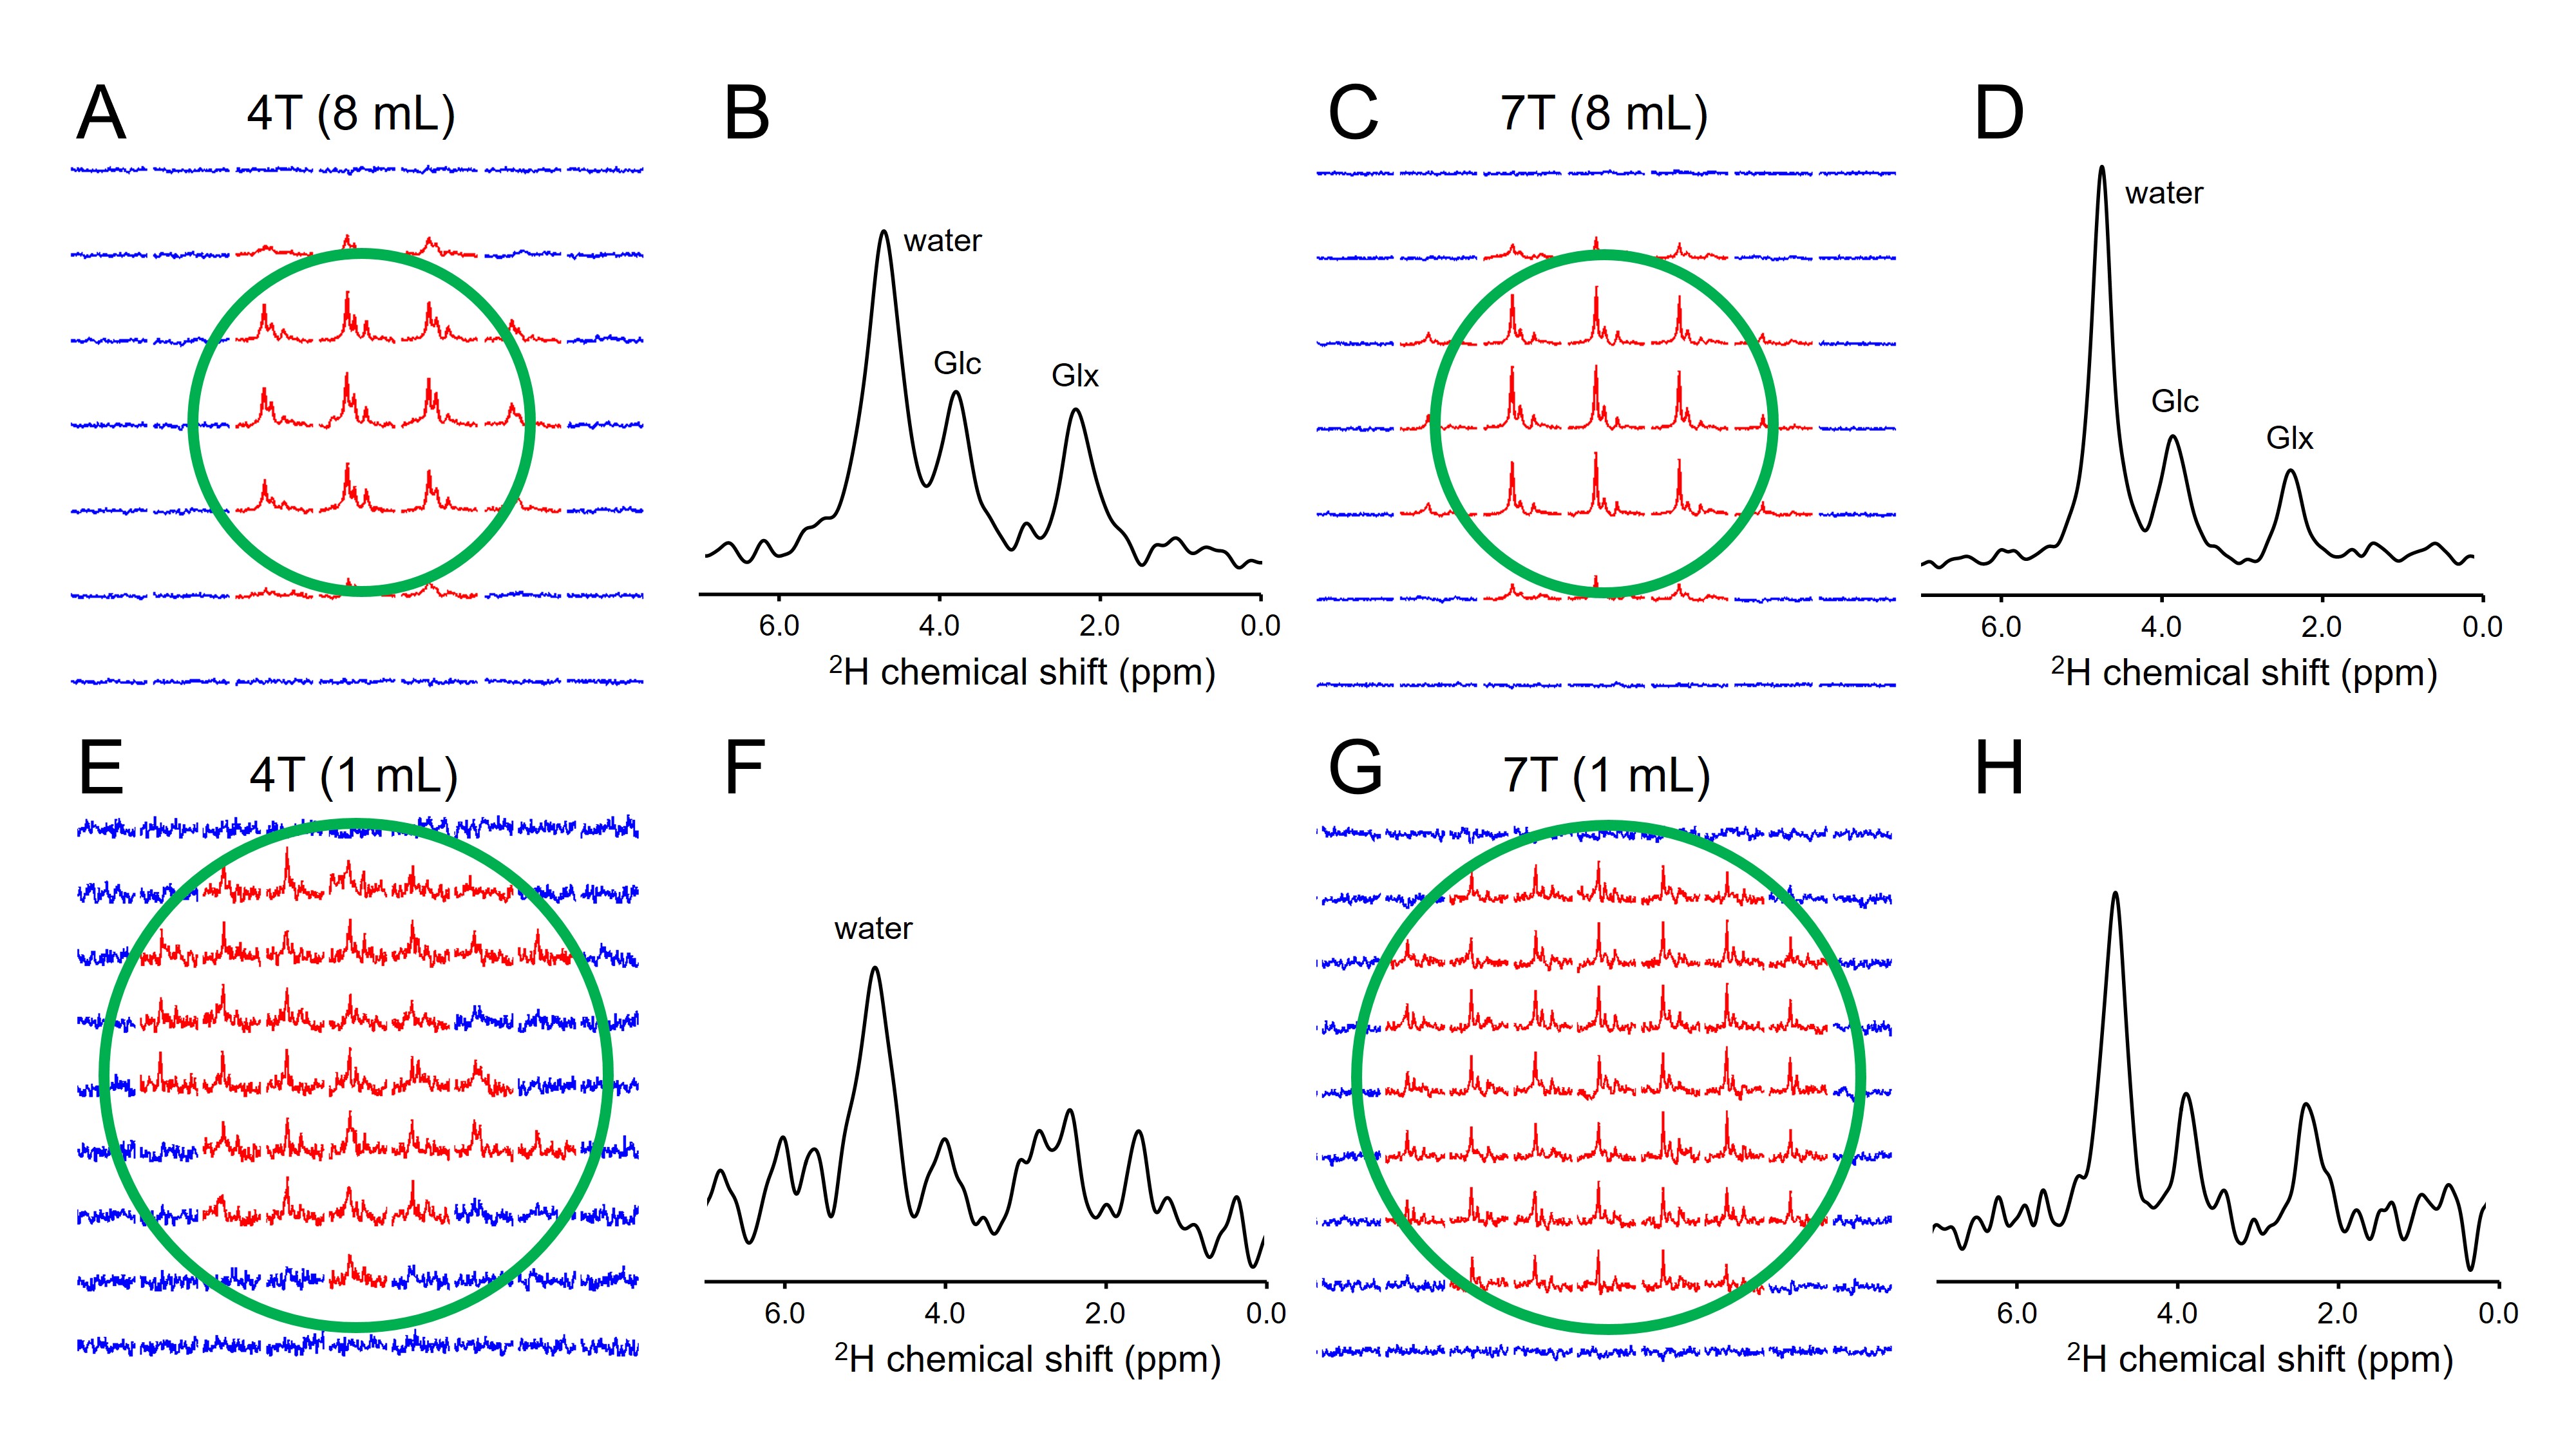
Figure 3: DMI on human brain following oral administration of [6,6’-2H2]-glucose.
(A, C) DMI and (B, D) representative spectra from (A) 4T and (C) 7T acquired
50-80 min after glucose administration at an 8 mL resolution. (E, G) DMI and
(F, H) representative spectra from (E, F) 4T and (G, H) 7T acquired 85-115 min
after glucose administration at a 1 mL resolution.