0490
bSSFP vs SSFP acquisitions of 7Li MRI at 7T: Comparison of sensitivity and quantification accuracy1CEA, NeuroSpin, Gif-sur-Yvette, France, 2Siemens Healthineers, Erlangen, Germany, 3Hôpital Fernand Widal, Paris, France, 4Hôpital Albert-Chenevier, Créteil, France, 5Neurology, RWTH Aachen University Hospital, Aachen, Germany, 6INSERM UMRS-1144, Hôpital Fernand Widal, Paris, France
Synopsis
3D 7Li SSFP and balanced SSFP approaches have been compared by acquiring both datasets from seven euthymic bipolar disorder (BD) patients at 7T. Quantification was performed using the phantom replacement approach accounting for global T1 and T2 relaxation effects. With both methods, heterogeneous brain Li distributions were observed with marked differences in the eyes notably. However, strong correlations between averaged apparent lithium concentrations could be established across all BD patients. While the bSSFP approach is a viable and practical option for 7Li MRI, a more realistic quantification pipeline should be considered in the future.
Introduction
Lithium (Li) is the first-line mood stabilizer to treat bipolar disorder (BD) patients [1]. However, its mechanisms of action and transport across the blood-brain barrier remain poorly understood. 7Li MRI is the only non-invasive method to determine brain Li concentrations and regional distribution [2-6]. In this study, we aimed at mapping the cerebral Li distribution in euthymic BD patients treated with lithium salts (with or without co-medication) for more than 2 years. For comparison, we acquired sequentially two lithium 3D images: a UTE SSFP with Twisted Projection Imaging (TPI) k-space sampling and a balanced SSFP sequence with Cartesian k-space sampling. For both acquisitions, a phantom replacement approach was used for quantification accounting for global T1 and T2 relaxation effects [7-8].Materials
Seven euthymic BD patients were recruited from the Paris “Centre Expert Bipolaire”. All were diagnosed with BD, type I or II. After providing written and informed consent, patients were scanned at 9 AM, 12 hours after their last lithium intake (Li2CO3 dosage ranging from 800 to 1400mg/day). 7Li MRI acquisitions were performed on a 7T Magnetom scanner (Siemens Healthineers) with a dual-resonance 1H/7Li RF birdcage coil (Rapid Biomedical). In addition to an anatomical T1-weighted image and a B0 map, two 3D 7Li images were acquired each for 24 minutes, first using an UTE SSFP TPI sequence [9] (TE/TR = 0.3/200ms, FA=20°, 1769 projections, linear fraction of 50%, 352 points per spoke, 10.6 ms readout duration, 15 mm isotropic resolution), the second using a bSSFP sequence [10] (TE/TR= 2.5/5ms, FA=30°, 1024 excitations, 365Hz/pixel, 15mm isotropic resolution). Global T1 and T2 relaxation times were estimated from non-localized MR spectra acquired from our first BD patients using the progressive saturation technique [11] (TR ranging from 0.4 to 20s) and by varying the echo-time (TE ranging from 30 to 120ms). Non-Cartesian reconstruction was made using a homemade Python gridding algorithm [12]. The quantification was realised via a phantom replacement approach ( 50 mmol/L LiCl phantom ) with correction for the differential T1/T2 weighting using the respective signal equations for b-SSFP:
$$S=\frac{{M_0 * (E_2*(1-E_1)*sinα)^{1/2}}}{{(1-(E_1-E_2)*cosα-E_1*E_2)}} $$ [10]
And SSFP :
$$S= M_0 * tan(α/2)*(1-(E_1-cosα)*r) $$ with $$r=\frac{1-E_2^2}{ (1- E1*cosα)^2 - E_2^2(E1-cosα)^2}$$ [13]
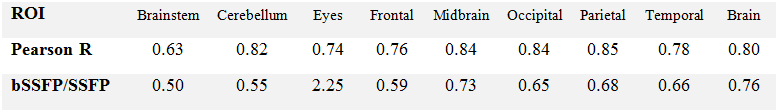
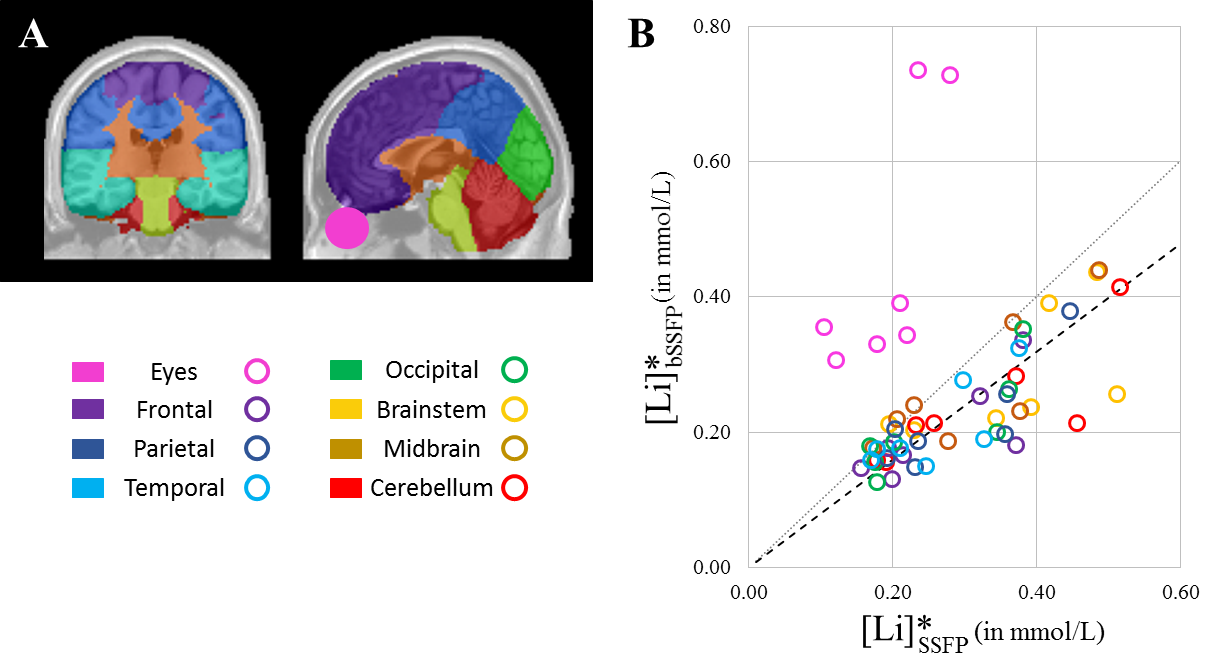
After apparent Li concentration ([Li]*) maps were aligned with their respective T1-weighted anatomical reference, all images were interpolated and co-registered into the MNI-152 space provided by SPM [14] to evaluate the average concentrations over eight regions-of-interest (ROI): the frontal, parietal, temporal and occipital lobes, the brainstem, eyes, midbrain region and cerebellum. Those masks (Fig. 2A) were defined with a combination of probabilistic atlases provided by FSL [15], in particular the MNI and Harvard-Oxford atlases.
Results
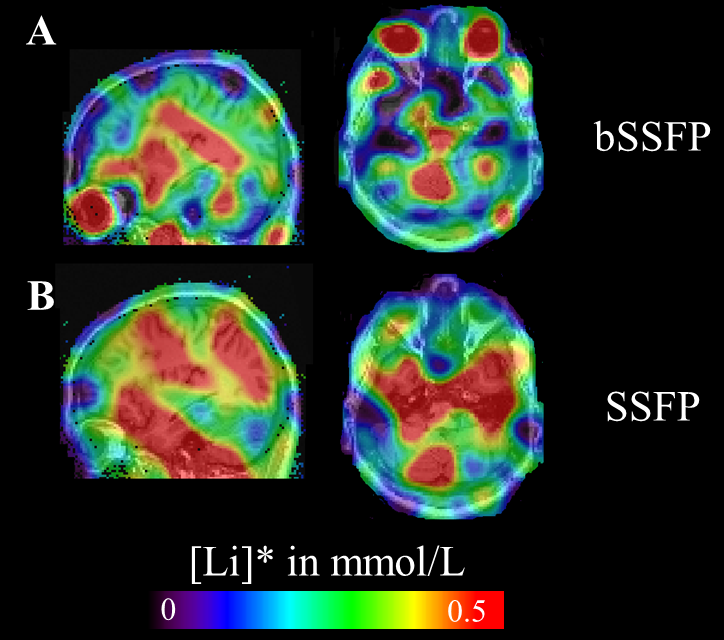
Non-localized T1mono, T2mono, T2f and T2s of cerebral Li7 were estimated at 3950, 63, 13 and 80 ms respectively, which is consistent with previous estimations [16-17]. As illustrated by Figure 1, both SSFP and bSSFP 7Li MRI acquisitions exhibited sufficient SNR to detect and map brain lithium, with normalized SNR ($SNR = nSNR * Voxel * [Li] * Time1/2 $) evaluated at 3.0 × 10⁶ mol−1 min–1/2 for the SSFP and 2.3 × 10⁶ mol−1 min–1/2 for the b-SSFP sequence leading to sensitivity thresholds of about 0.02 and 0.03 mmol/L. As previously reported [18-19], brain lithium distributions were heterogeneous with significant differences in apparent lithium concentrations amidst our seven volunteers. Although bSSFP and SSFP lithium maps differ considerably, strong correlations could be established between their average apparent Lithium concentractions across BD patients (Table 1). The most striking differences were found in the eyes, with the bSSFP sequence displaying larger apparent concentrations (Fig2B).Discussion
While UTE SSFP or SPGR sequences using non-Cartesian k-space sampling approaches are becoming the gold standard method for 23Na MRI, the bSSFP sequence constitutes a viable alternative in terms of sensitivity but also due to practical reasons, as few clinical research centers have access to more advanced k-space trajectories. However, this modest comparative study reveal some of the pitfalls one faces when attempting quantification of lithium concentrations when assuming global, mono-exponential relaxation times in signal equations. First, one should consider a more realistic quantification pipeline accounting for the different relaxation times in the CSF (such as the eyes) and tissular brain areas. Indeed, by considering much longer relaxation times of (bulk) lithium (e.g. T1/T2~12000/400 ms), one can estimate that our [Li]* concentrations are overestimated by a factor of 2 with the bSSFP sequence and underestimated by a mere 20% with the SSFP sequence in the CSF, explaining the large discrepancy between both approaches. Additionally, an on-going simulation of both SSFP and bSSFP signals using the Louisville-Redfield formalism [20] hints at a underestimation using the bSSFP sequence of the fast-relaxing (bound) lithium signal, unlike the SSFP sequence thanks to its ultra-short echo-time.Acknowledgements
This work received financial support from the ‘Agence Nationale pour la Recherche’, grant ANR-14-CE15-0003 and from the ERPT equipment program of the Leducq Foundation.References
1. Baldessarini et al., Bipolar Disorders, 2006
2. Komoroski, NMR Biomed 2005 ;
3. Machado-Vieira et al., Acta Psychiatrica Scand, 2016
4. Renshaw et al., Man Reson Imaging 1988;
5. Komoroski et al., Li, NMR Biomed 2013 ;
6. Ramaprasad et al., Magnetic Reson Imag 2005 ;
7. Hanak et al., Toxicol Sci 2015;
8. Soher et al., Man Reson Med 1996;
9. Boada et al., Man Reson Med 1997;
10. Scheffler et al, Magn Resonance in Med, 2003
11. Freeman et al., Chem Physics 1971;
12. Jackson et al., IEEE Trans on Med Imaging 1991, Vol 10
13. Hanicke et al, Magn Resonance in Med, 2003
14. http://www.fil.ion.ucl.ac.uk/spm/
15. http://web.mit.edu/fsl_v5.0.8/fsl/doc/wiki/Atlases.html
16. Port et al, Journal of Magn Res, 2013
17. Komoroski et al, Magn Reson Med, 2004
18. Lee et al, Magn Reson in Med, 2012
19. Smith et al, Molecular Psychiatry, 2018
20. Madelin et al, Prog in Nuc Magn Res Spec, 2014
Figures