0489
Longitudinal structural change in skeletal muscle tissue of Duchenne muscular dystrophy patients based on 1H- and 23Na-MRI1Institute of Radiology, University Hospital Erlangen, FAU, Erlangen, Germany, 2NMR laboratory, Institute of Myology, Paris, France, 3NMR laboratory, CEA/DRF/IBFJ/MIRCen, Paris, France, 4Department of Pediatrics, Division Neuropediatrics, FAU, Erlangen, Germany
Synopsis
Duchenne muscular dystrophy (DMD) is a hereditary neuromuscular disease leading to progressive muscle wasting. Here, young DMD boys were examined twice within six months with a MRI protocol that included commonly used biomarkers such as fat fraction derived from the Dixon method and water T2 as well as 23Na MRI indices. Sodium anomalies were commonly observed and developed even in absence of fatty degenerative changes and water T2 increases over the observational period. Although limited in the small number of subjects, the data supports that 23Na could be used to characterize early dystrophic muscle alteration in a longitudinal fashion.
Introduction
DMD is caused by a mutation in the dystrophin gene leading to progressive muscle wasting during childhood and loss of ambulation by around 12 years 1,2. Muscle destruction is associated with inflammation, dysregulation of the ion homeostasis, and exhaustion of regenerative capacities, which leads ultimately to replacement of muscle by fatty-fibrotic tissue.
Quantitative MRI has been used to describe the natural history of the disease and has been suggested as an outcome measure in clinical trials for DMD. Most of these studies evaluated the fat fraction and the 1H transverse relaxation time (water T2) to assess disease severity and progression 3. As both methods have their limitations, there is a need to identify other MRI variables that may serve as potential early sensitive indicators of response to treatment. 23Na MRI has been previously proposed for follow up of DMD patients as they show a muscular Na+ overload 4,5. We examined the pathological alterations in the dystrophic muscle with a variety of different 1H and 23Na MRI methods. In the present study, young DMD boys were examined at baseline and after six months.
Materials & Methods
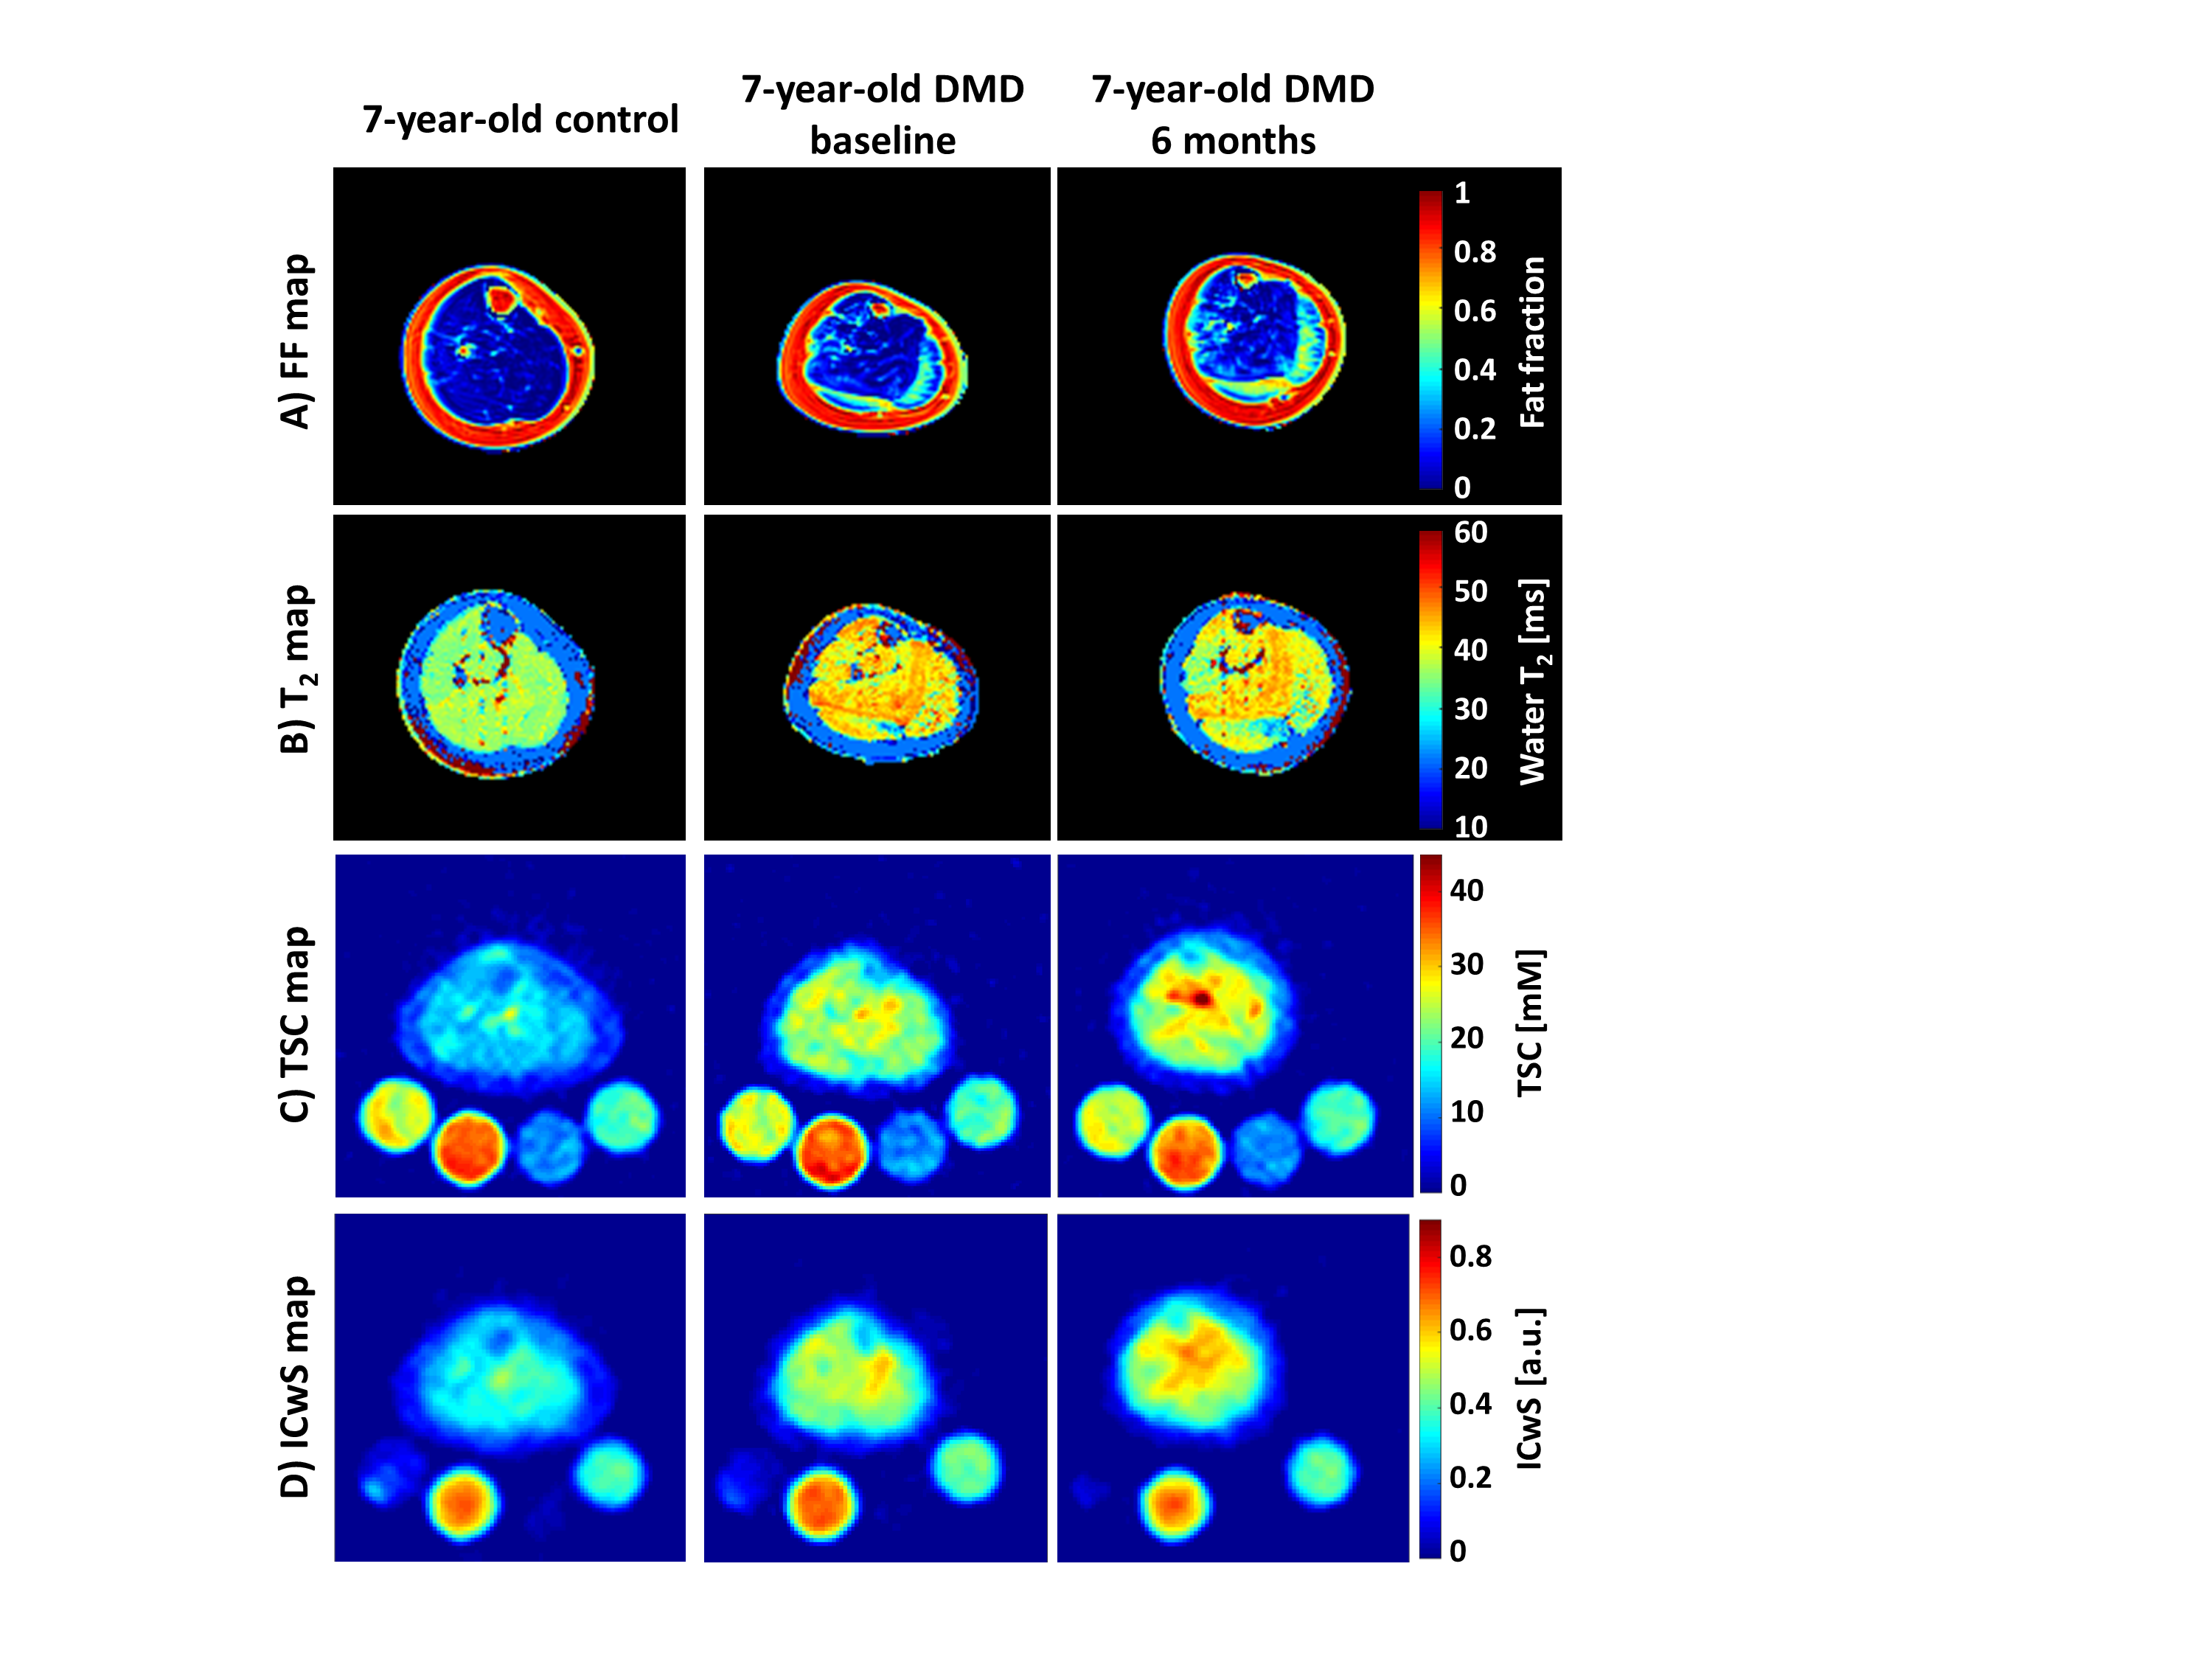
MRI of the right calf was performed in eleven DMD patients (age 8.3±2.3 years) and fourteen age-matched controls (age 9.5±2.1 years) on a 3T whole-body MR system (Magnetom Skyra, Siemens Healthcare). DMD boys were reexamined after six months (27.2±4.8 weeks). A 15-channel quadrature knee coil (Siemens) was used for 1H MRI and a single-tuned (23Na) volume knee coil (Stark Contrast) and NaCl references tubes with 5% Agarose for 23Na MRI. For water T2 determination, a multi-slice-multi-echo (MSME) sequence was acquired with the following parameters: TR 3000 ms, 32 echoes with TEs from 9.5 ms to 304, five slices with a 1.4x1.4 mm2 resolution, Tacqu 3 min 41 sec. Water T2 values were calculated based on a tri-exponential fitting procedure 6. Fat fraction (FF) was measured using a 3D 3-pt DIXON method: TR 10 ms, TEs 2.75/3.95/5.15 ms, FA 3°, 64 slices with a 1.3x1.3 mm2 resolution, total Tacqu 3 min 12 sec. Total tissue sodium concentration (TSC) was derived from an density-adapted 3D-radial UTE sequence acquired with the following parameters 7: TE/TR 0.3/50 ms, FA 80°, resolution 3x3x15 mm3, 8264 projections, Tacqu 6 min 53 sec. An inversion-recovery (IR) sequence was used to reduce 23Na-signal originating from unrestricted environments to achieve an intracellular weighted sodium signal (ICwS) 8: TE/TR 0.3/124 ms, TI 34 ms, FA 90°, resolution 4x4x20 mm3, 4760 projections, Tacqu 9 min 50 sec. ROIs were drawn on the gastrocnemius medialis (Gas.med.), soleus, tibialis posteroir (Tib. pos.), and tibialis anterior (Tib. ant.) muscles.Results
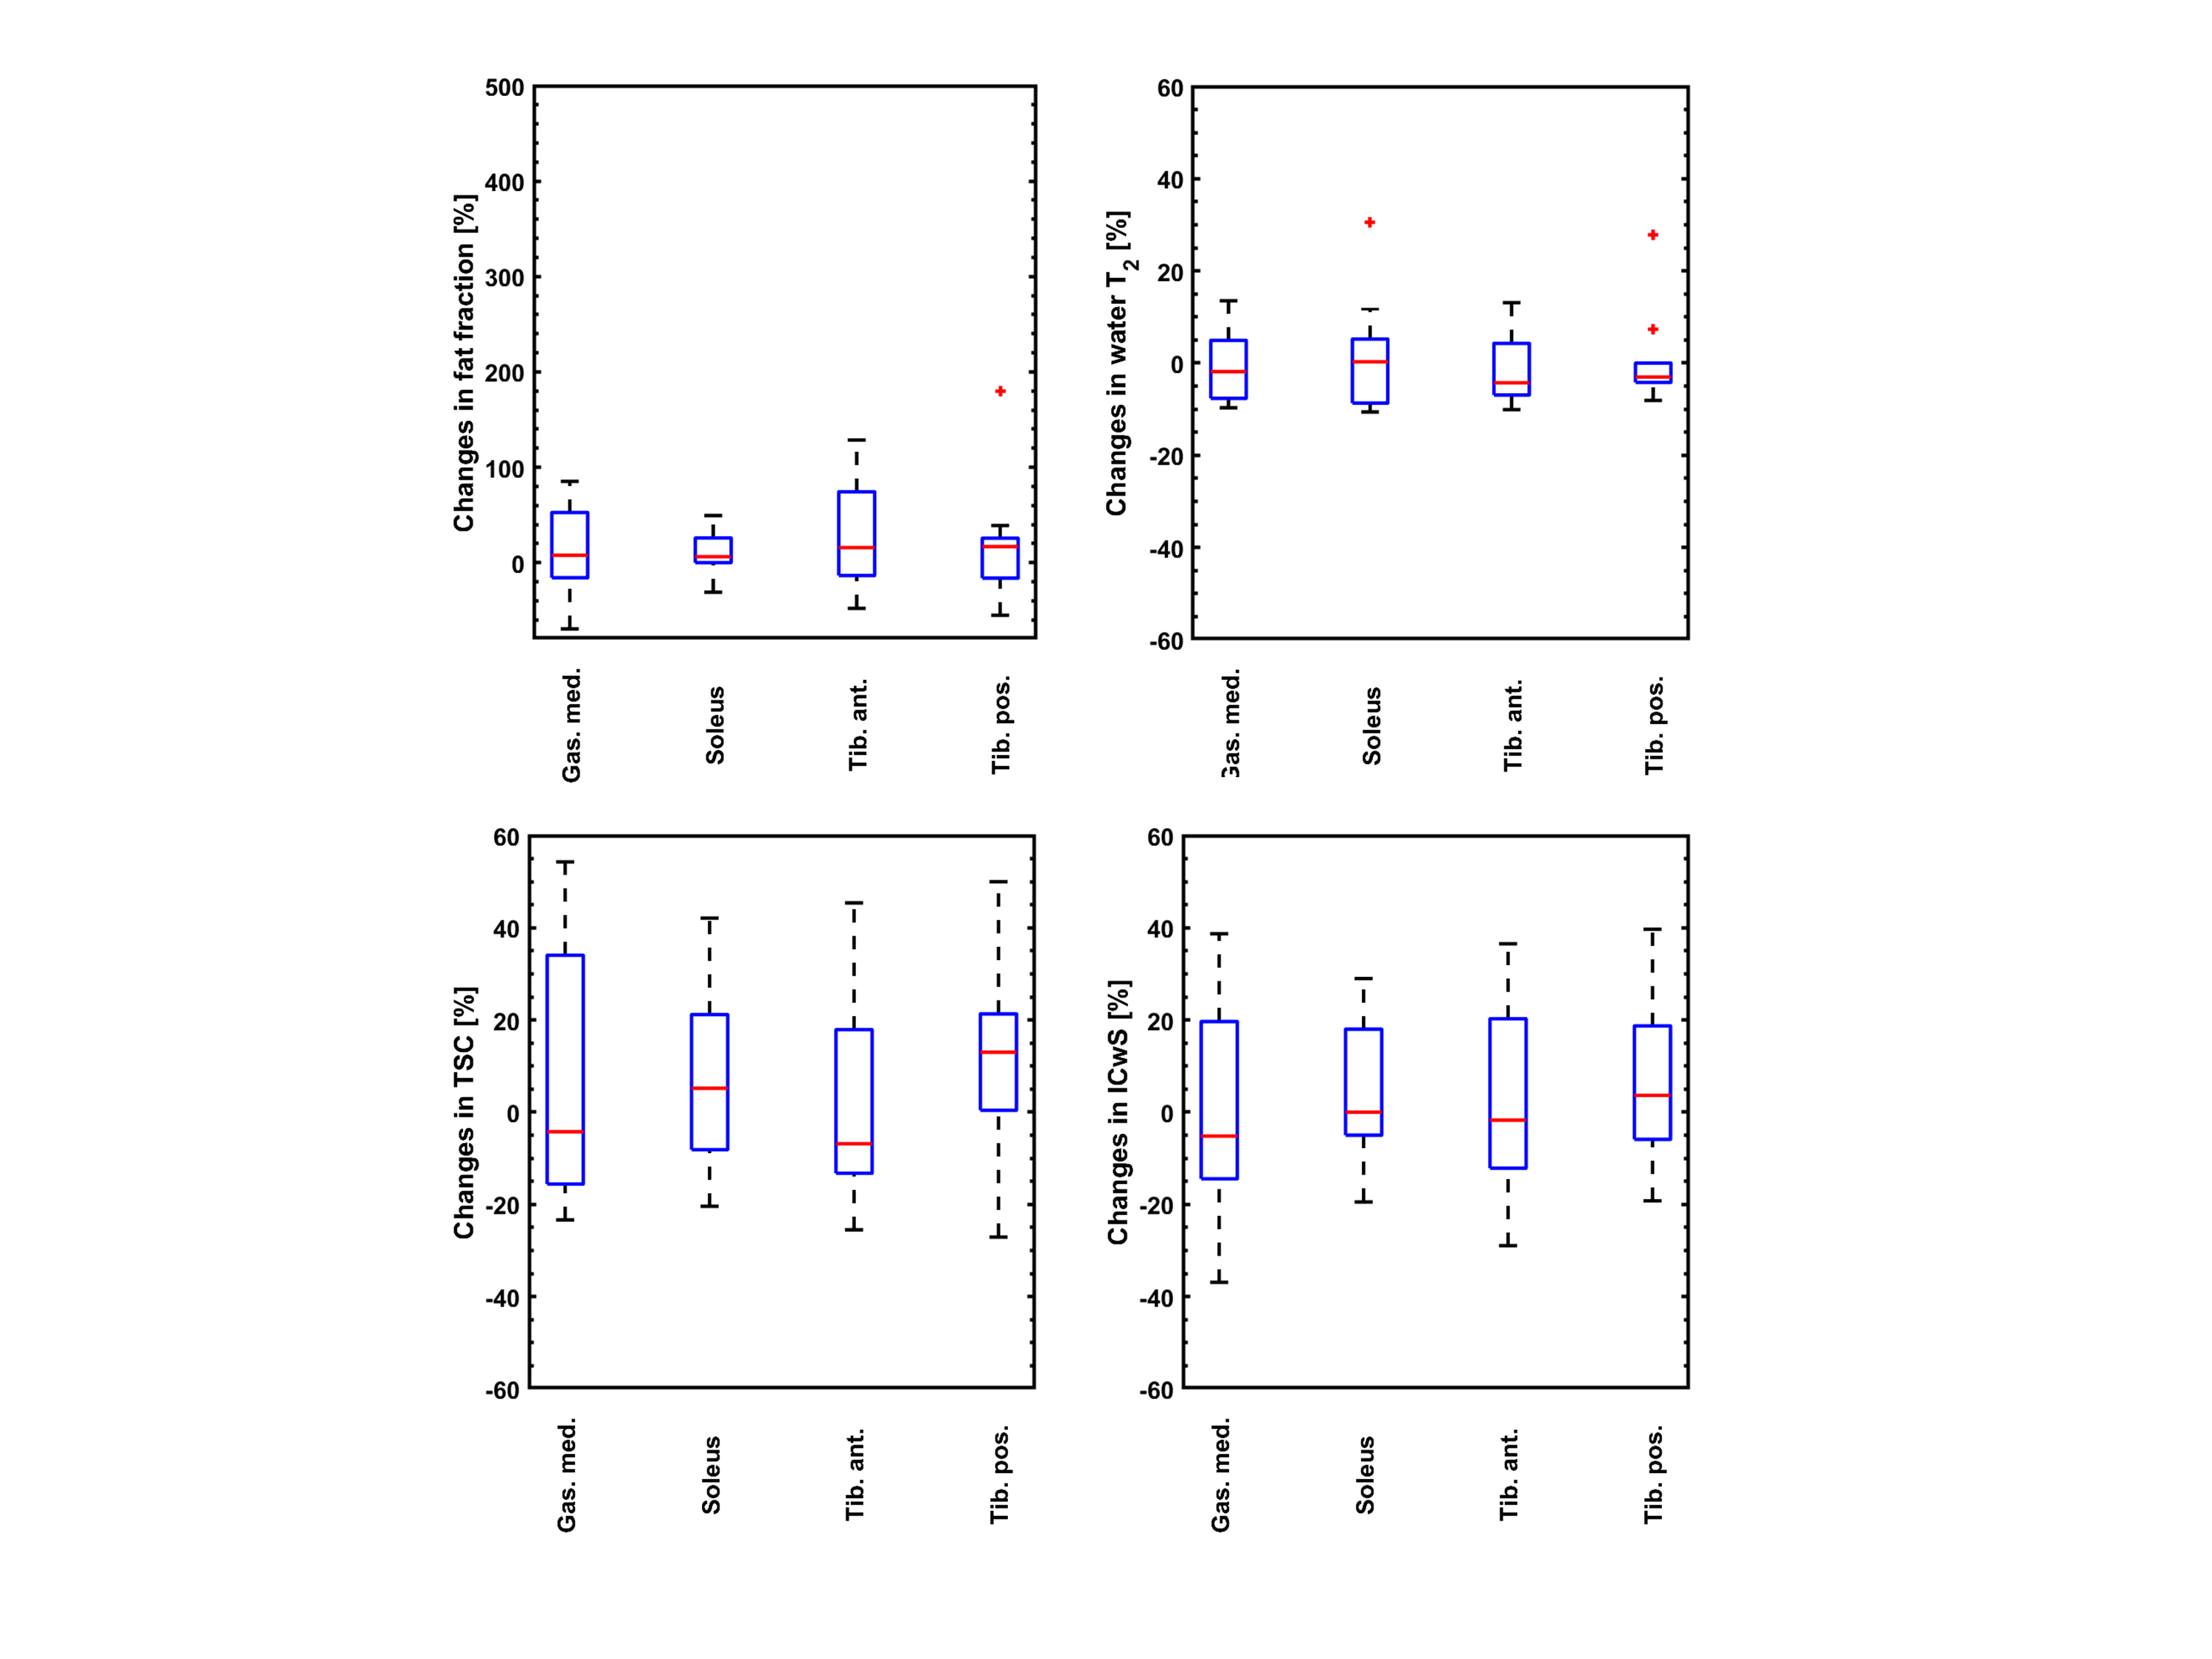
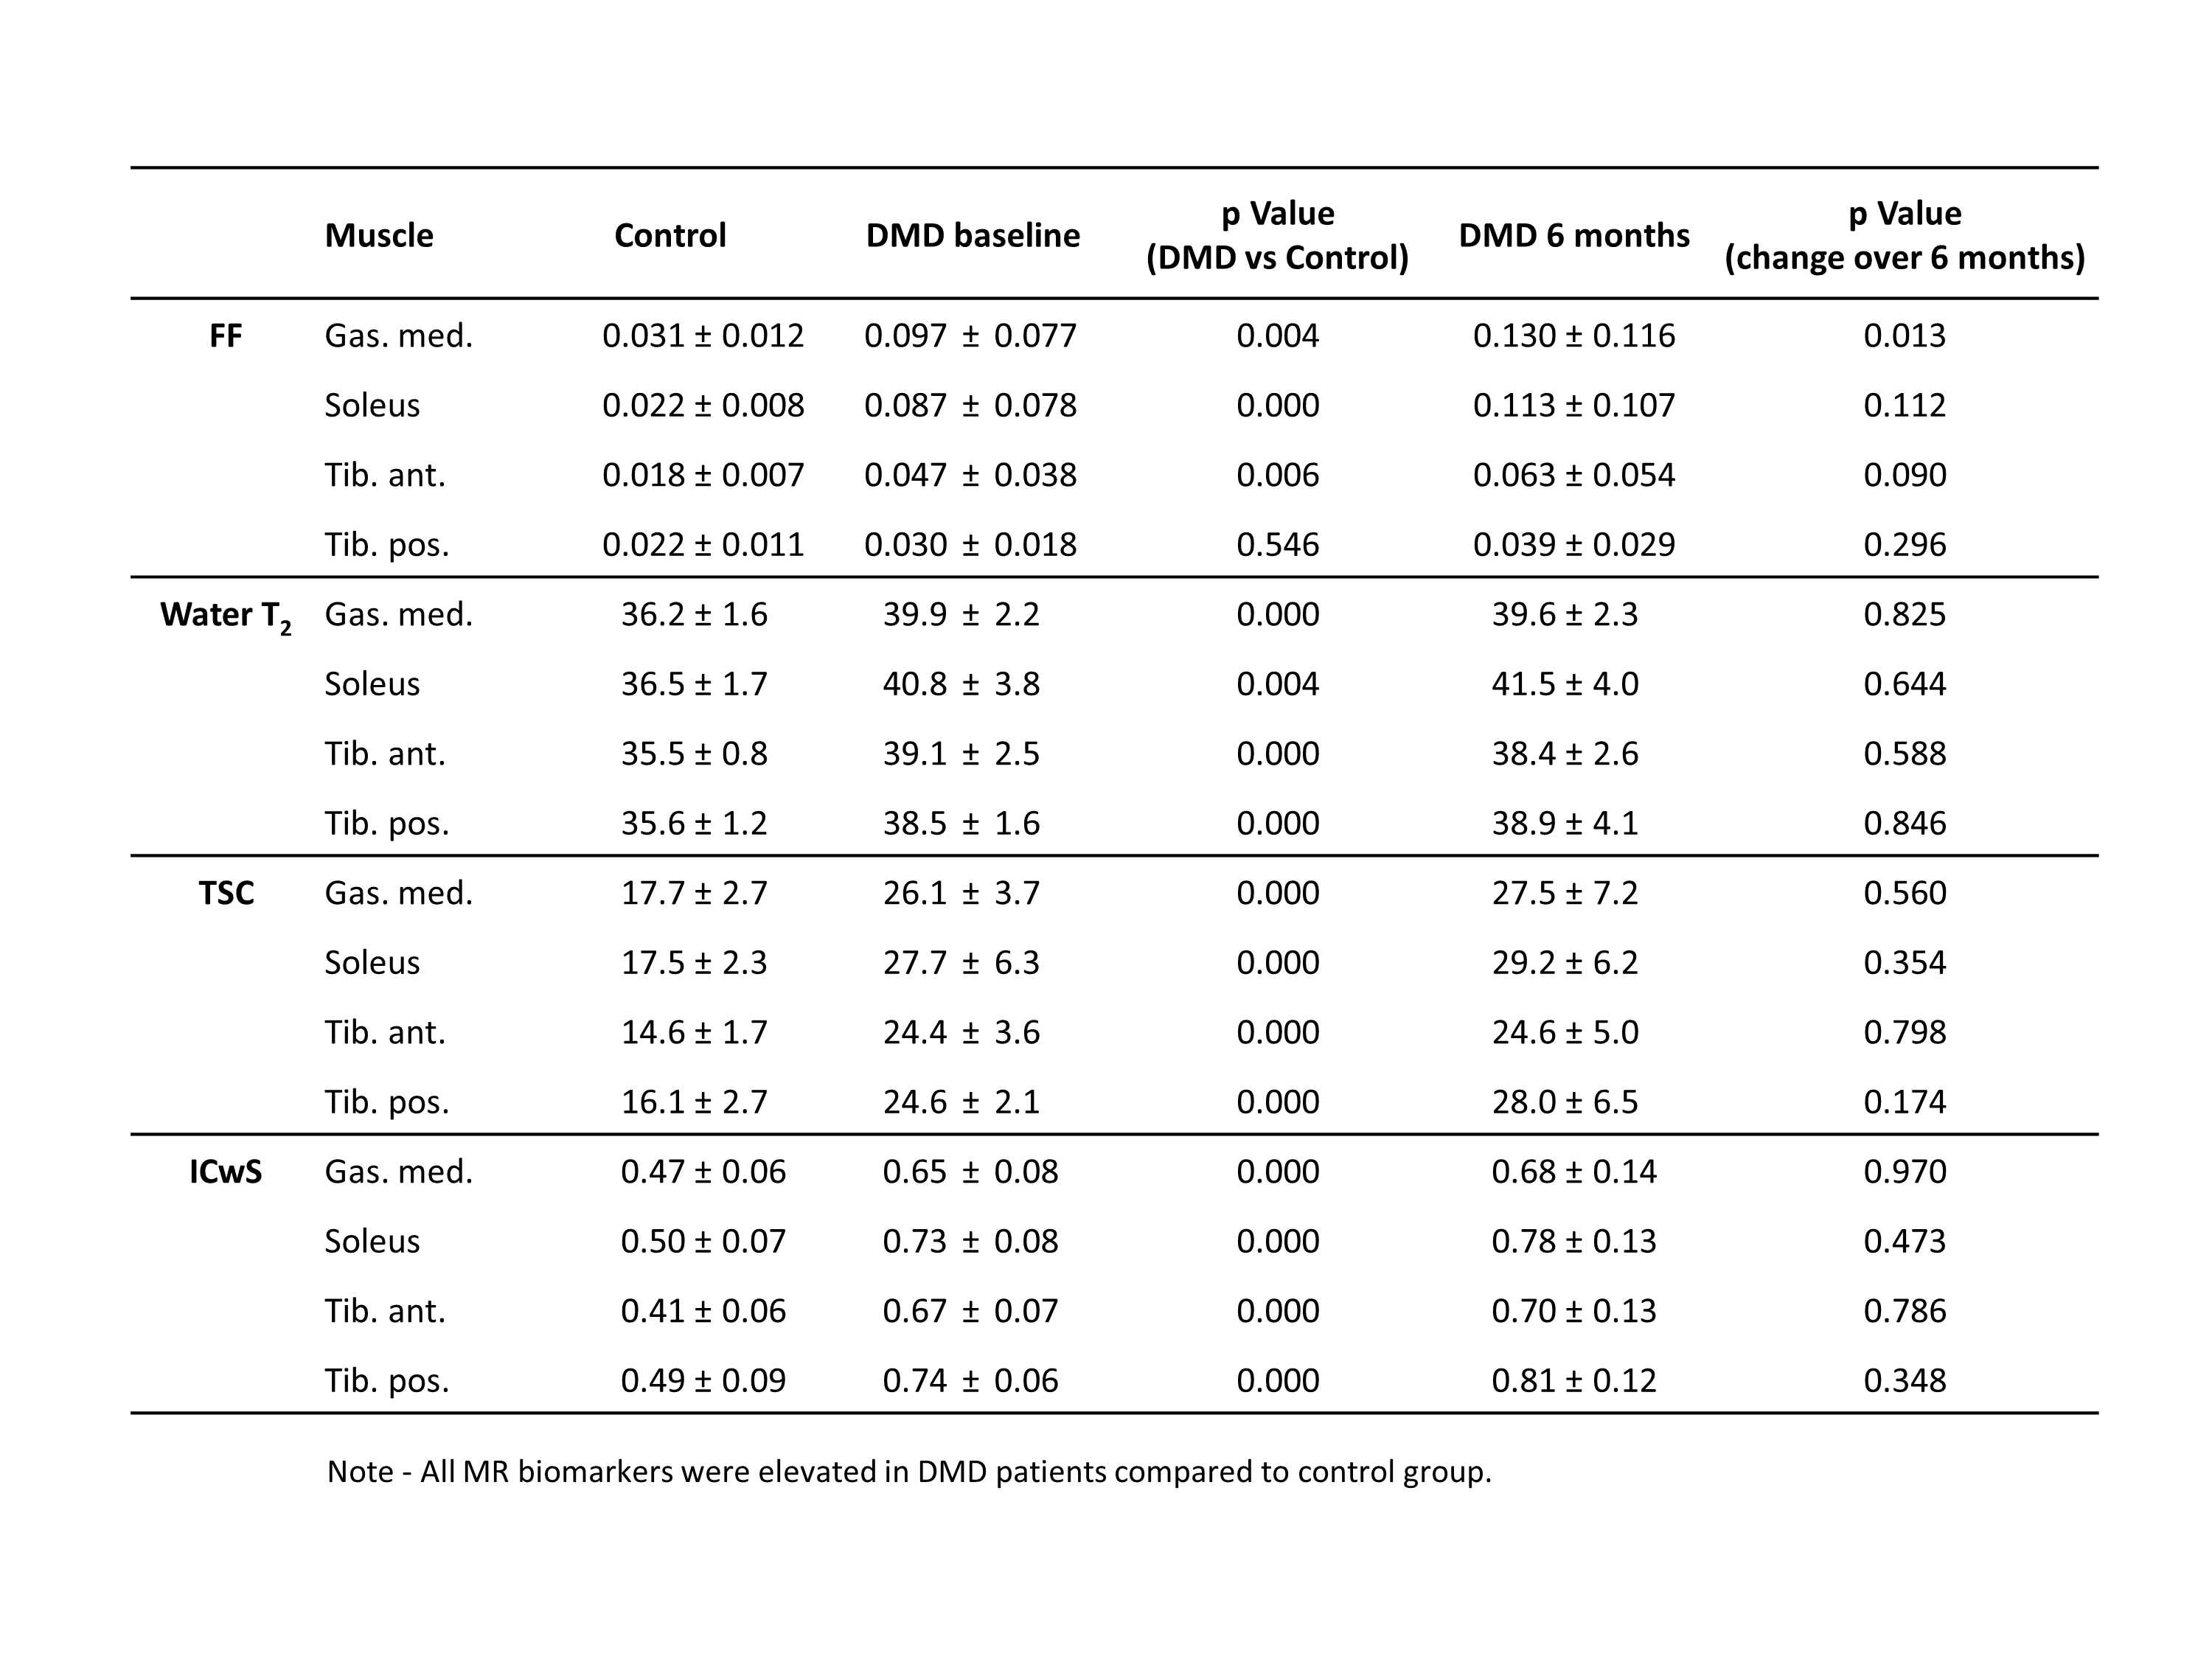
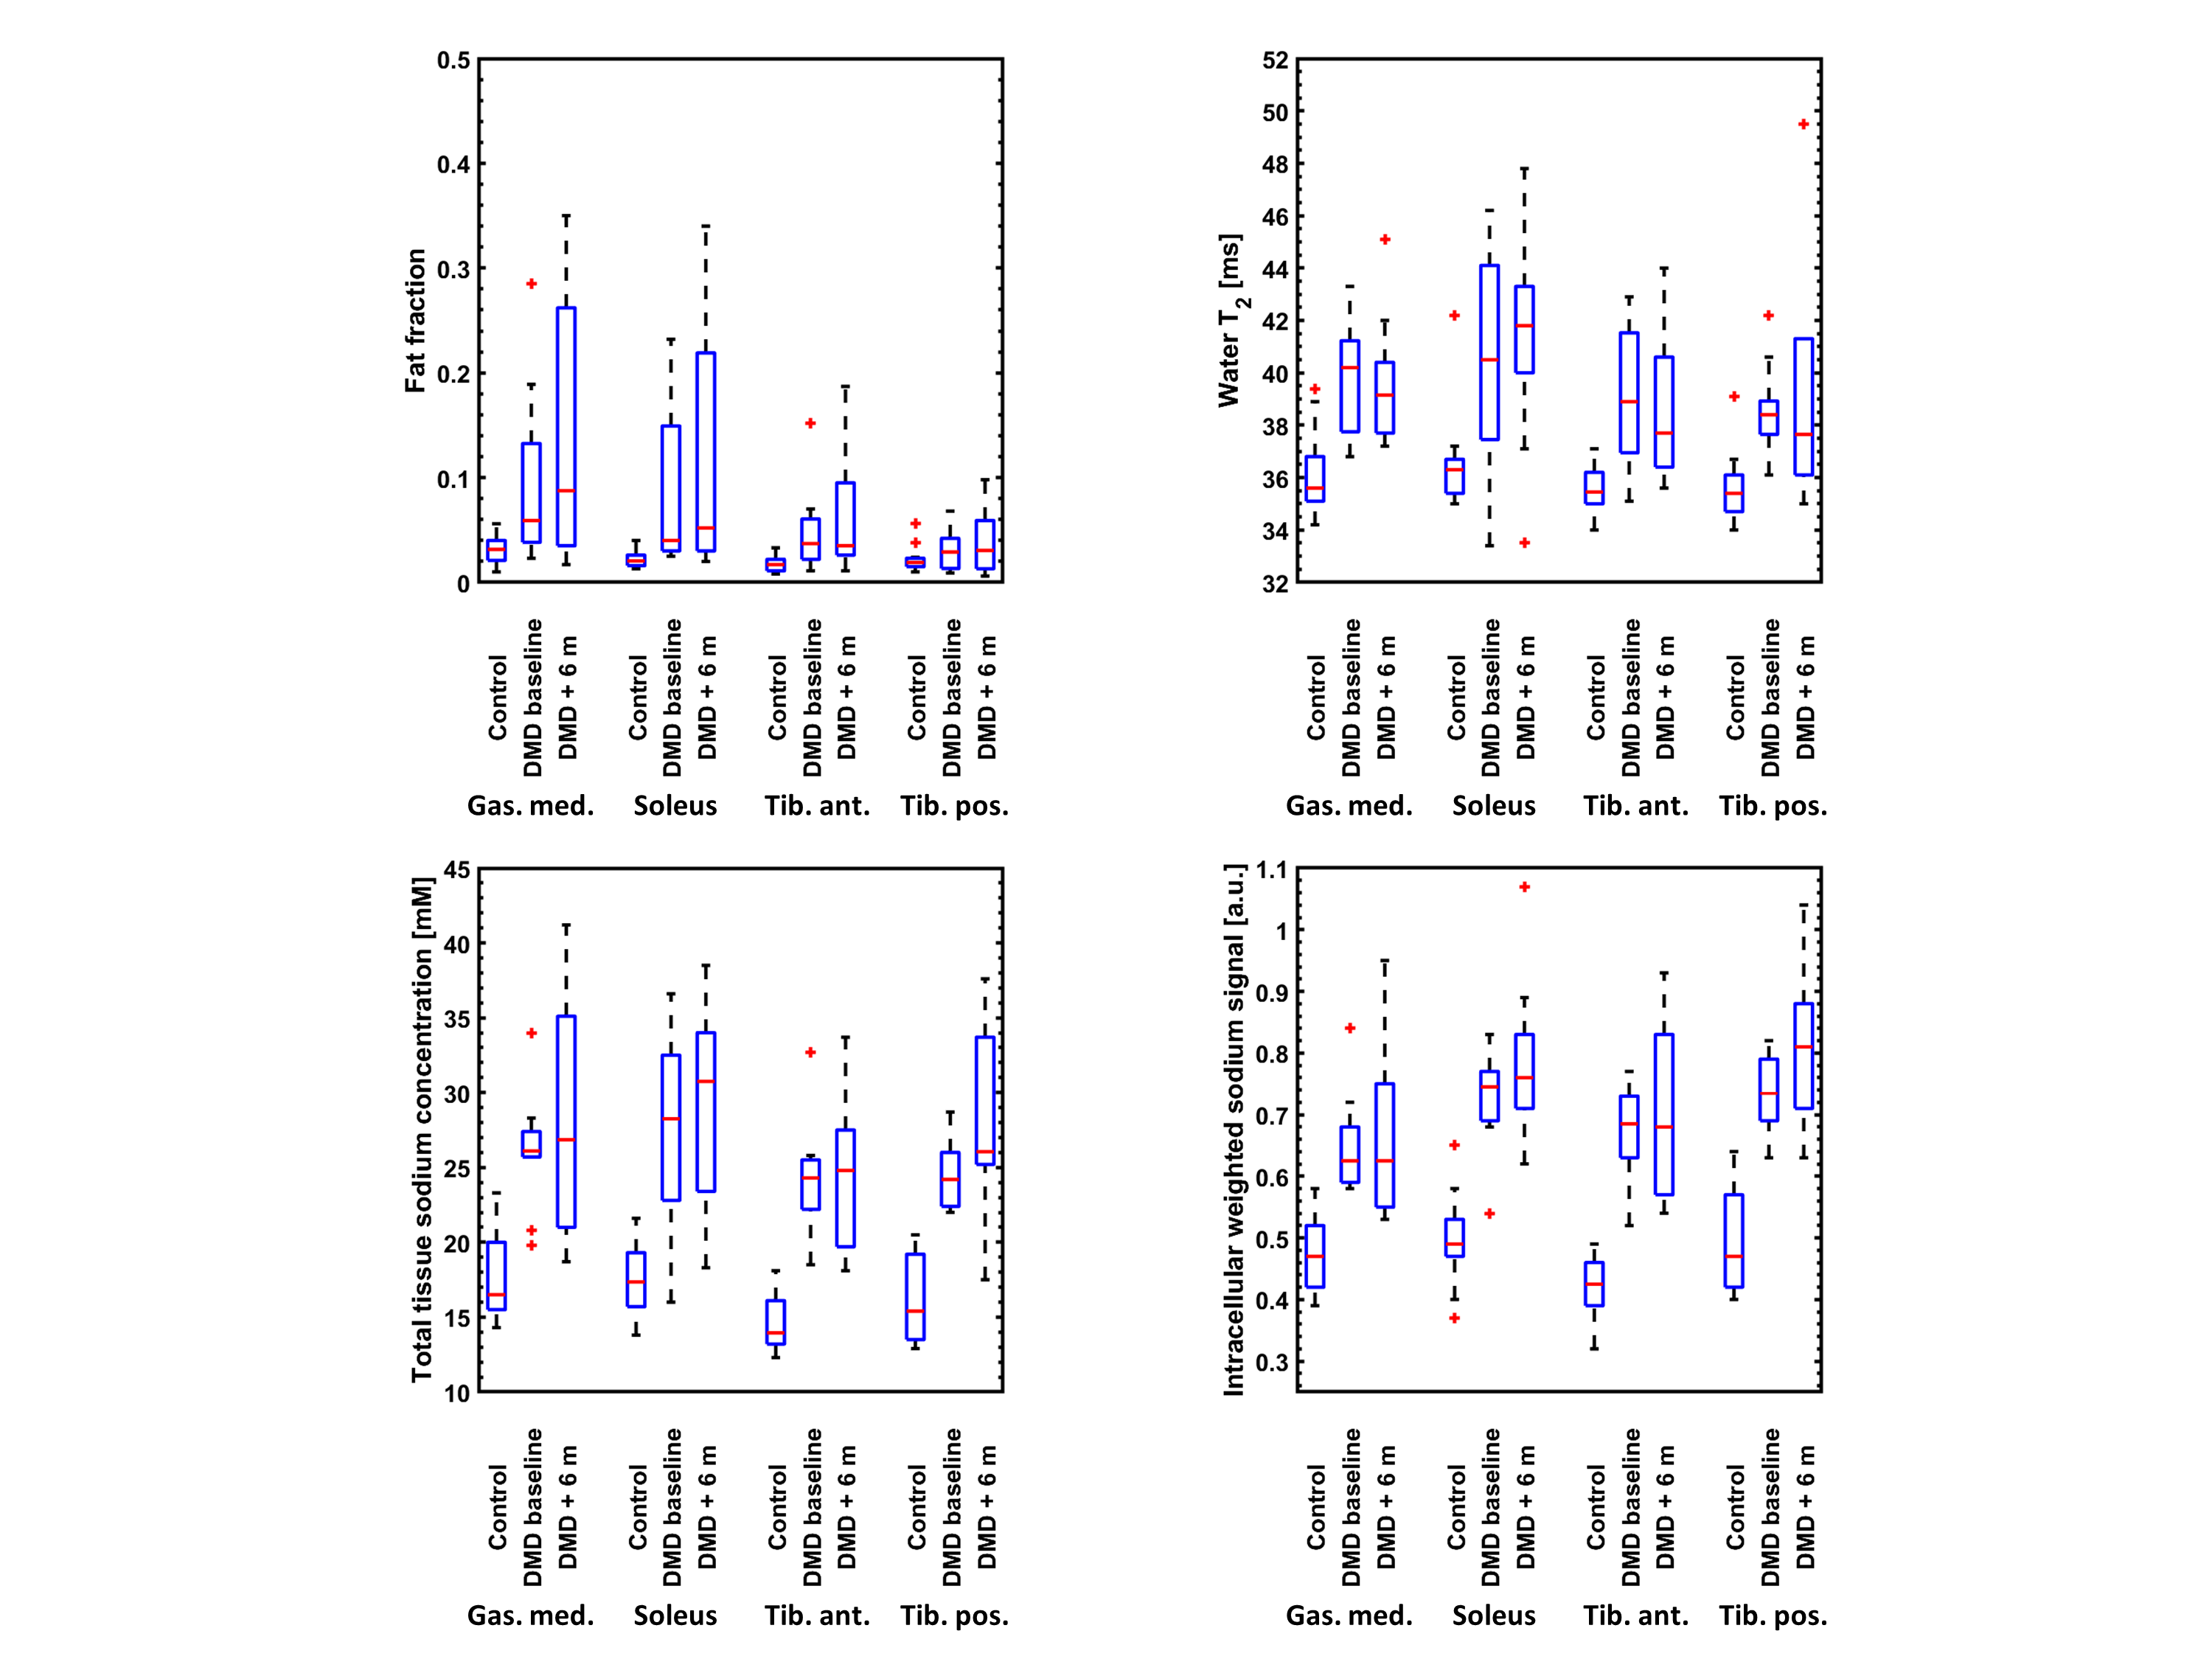
Water T2, FF, TSC, and ICwS were elevated in DMD patients compared to controls at baseline (Table 1). As depicted by Figure 1, young DMD patients have moderately increased FF. Water T2, TSC, and ICwS were increased already at baseline and stayed increased after six months. The FF tended to increase over the time (p<0.05 for gas.med.) as expected (Figure 2). Water T2, TSC, and ICwS remained elevated and fairly stable over time and can be seen as marker of disease activity (Figure 3). Also muscles that were relatively spared, such as the tib. ant. and tib. pos., showed increased TSC and ICwS in all participating DMD patients. Moreover, the 23Na indices are frequently abnormal in DMD even when water T2 or FF remained in the normal range.Discussion & Conclusion
Our cross-sectional study provides an indication that 23Na MRI is sensitive to pathological changes related to muscle dystrophy in young DMD patients. Sodium anomalies seemed to be systematically present in patients with DMD compared to controls and precede fatty degenerative changes and had even developed in absence of water T2 increases. Although this longitudinal study, which is still in progress, has currently its limitation in the small number of subjects, the data supports the application of 23Na MRI as early and sensitive biomarker in future clinical studies in order to monitor ion channel leakage and membrane integrity.Acknowledgements
This project was supported by the Johannes and Frieda Marohn Foundation (to A.N. and R.T, 2016). We thank the Imaging Science Institute (Erlangen, Germany) for providing us with measurement time at the 3T MRI system.References
1. Hoffman EP, Brown RH Jr, Kunkel LM. Dystrophin: the protein product of the Duchenne muscular dystrophy locus. Cell 1987: 51(6):919-28.
2. Ryder S, Leadley RM, Armstrong N et al. The burden, epidemiology, costs and treatment for Duchenne muscular dystrophy: an evidence review. Orphanet J Rare Dis. 2017: 12(1):79.
3. Carlier PG, Marty B, Scheidegger O et al. Skeletal Muscle Quantitative Nuclear Magnetic Resonance Imaging and Spectroscopy as an Outcome Measure for Clinical Trials. J Neuromuscul Dis. 2016: 3(1):1-28.
4. Weber MA, Nagel AM, Wolf MB et al. Permanent muscular sodium overload and persistent muscle edema in Duchenne muscular dystrophy: a possible contributor of progressive muscle degeneration. J Neurol 2012: 259(11): 2385-2392.
5. Gerhalter T, Gast LV, Marty B, et al. Skeletal muscle tissue characterization of Duchenne muscular dystrophy patients by 1H- and 23Na-MRI. Proc. Intl. Soc. Mag. Reson. Med. 2018: 5067
6. Azzabou N, Loureiro de Sousa P, Caldas E, et al. Validation of a generic approach to muscle water T2 determination at 3T in fat-infiltrated skeletal muscle. J MRI 2015: 41(3): 645-653.
7. Nagel AM, Laun FB, Weber MA, et al. Sodium MRI using a density-adapted 3D radial acquisition technique. MRM 2009: 62:1565–1573.
8. Nagel AM, Amatteifo E, Lehmann-Horn F. et al. 3 Tesla Sodium Inversion Recovery Magnetic Resonance Imaging Allows for Improved Visualization of Intracellular Sodium Content Changes in Muscular Channelopathies. Invest Radiol 2011: 46(12):759-766.
Figures