0488
Simultaneous proton MR fingerprinting and sodium imaging1Center for Advanced Imaging Innovation and Research, Department of Radiology, New York University School of Medicine, New York, NY, United States, 2Sackler Institute of Graduate Biomedical Sciences, NYU Langone Health, New York, NY, United States
Synopsis
Sodium MRI can provide unique metabolic information to study the human body and its afflictions. However, the low intrinsic signal to noise ratio of sodium MRI limits the resolution of the sodium images to 3-5 mm isotropic and necessitates long acquisition times (~10-20 min). The necessity to perform 1H and 23Na acquisitions sequentially also prolongs the total scan time and limits applications of combined proton-sodium imaging. In this work, we demonstrate a technique to simultaneously acquire sodium images and multi-parametric proton maps in one single scan.
Introduction
Sodium(23Na) MRI can provide unique metabolic information to study the human body and its afflictions1. However, the low intrinsic SNR of sodium MRI limits the resolution of the sodium images to 3-5 mm isotropic and necessitates long acquisition times (~10-20min). The necessity to perform 1H and 23Na acquisitions sequentially also prolongs the total scan time and limits applications of combined proton-sodium imaging. In this work, we demonstrate a technique to simultaneously acquire sodium images and multi-parametric proton maps in one single scan.Methods
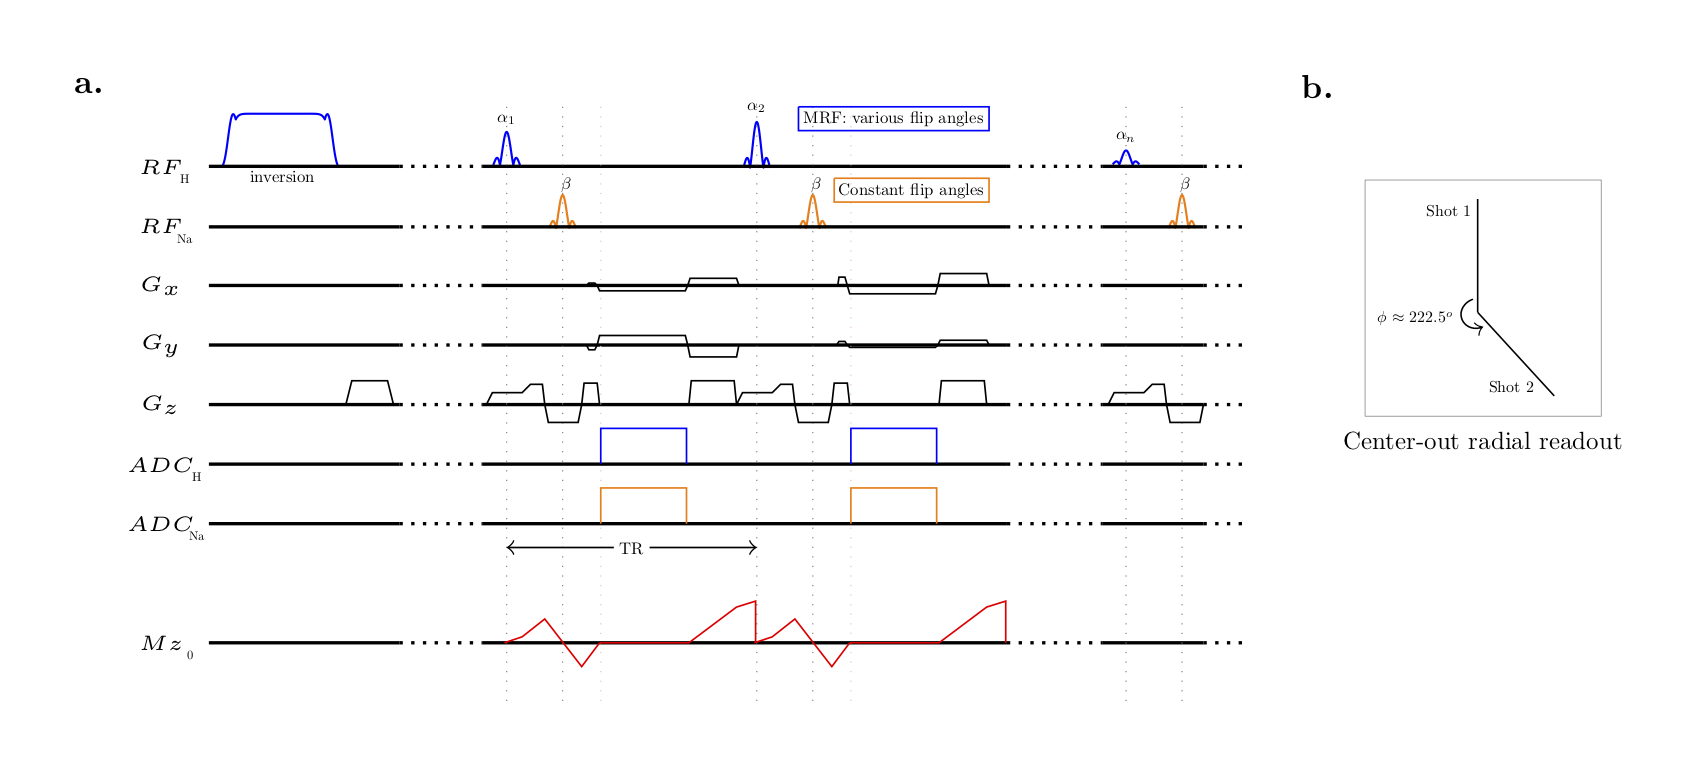
The MR Fingerprinting (MRF) framework provides unique opportunities to re-envision the MRI measurement 2,3. Leveraging the flexibility of MRF, we created a 2D multi-shot radial sequence which can simultaneously acquire both multi-parametric 1H maps and 23Na images (Fig. 1a). In each TR (7.5 ms), a 1H and 23Na pulse are played out, followed by one single readout that simultaneously captures both the 1H and 23Na signals. A gradient blip between the slice selection gradients ensures that the spins from both nuclei are in phase at the start of the readout. The sodium flip-angle is constant (30°), while the proton flip-angle changes from one TR to the next 3. In total, 1000 different proton excitations are used to encode the T1, T2, PD and B1+, the first 500 excitations without and the last 500 excitations with quadratic RF spoiling 3. A center-out radial trajectory is used (TE = 1.1ms) to maximize the sodium signal (Fig. 1b).
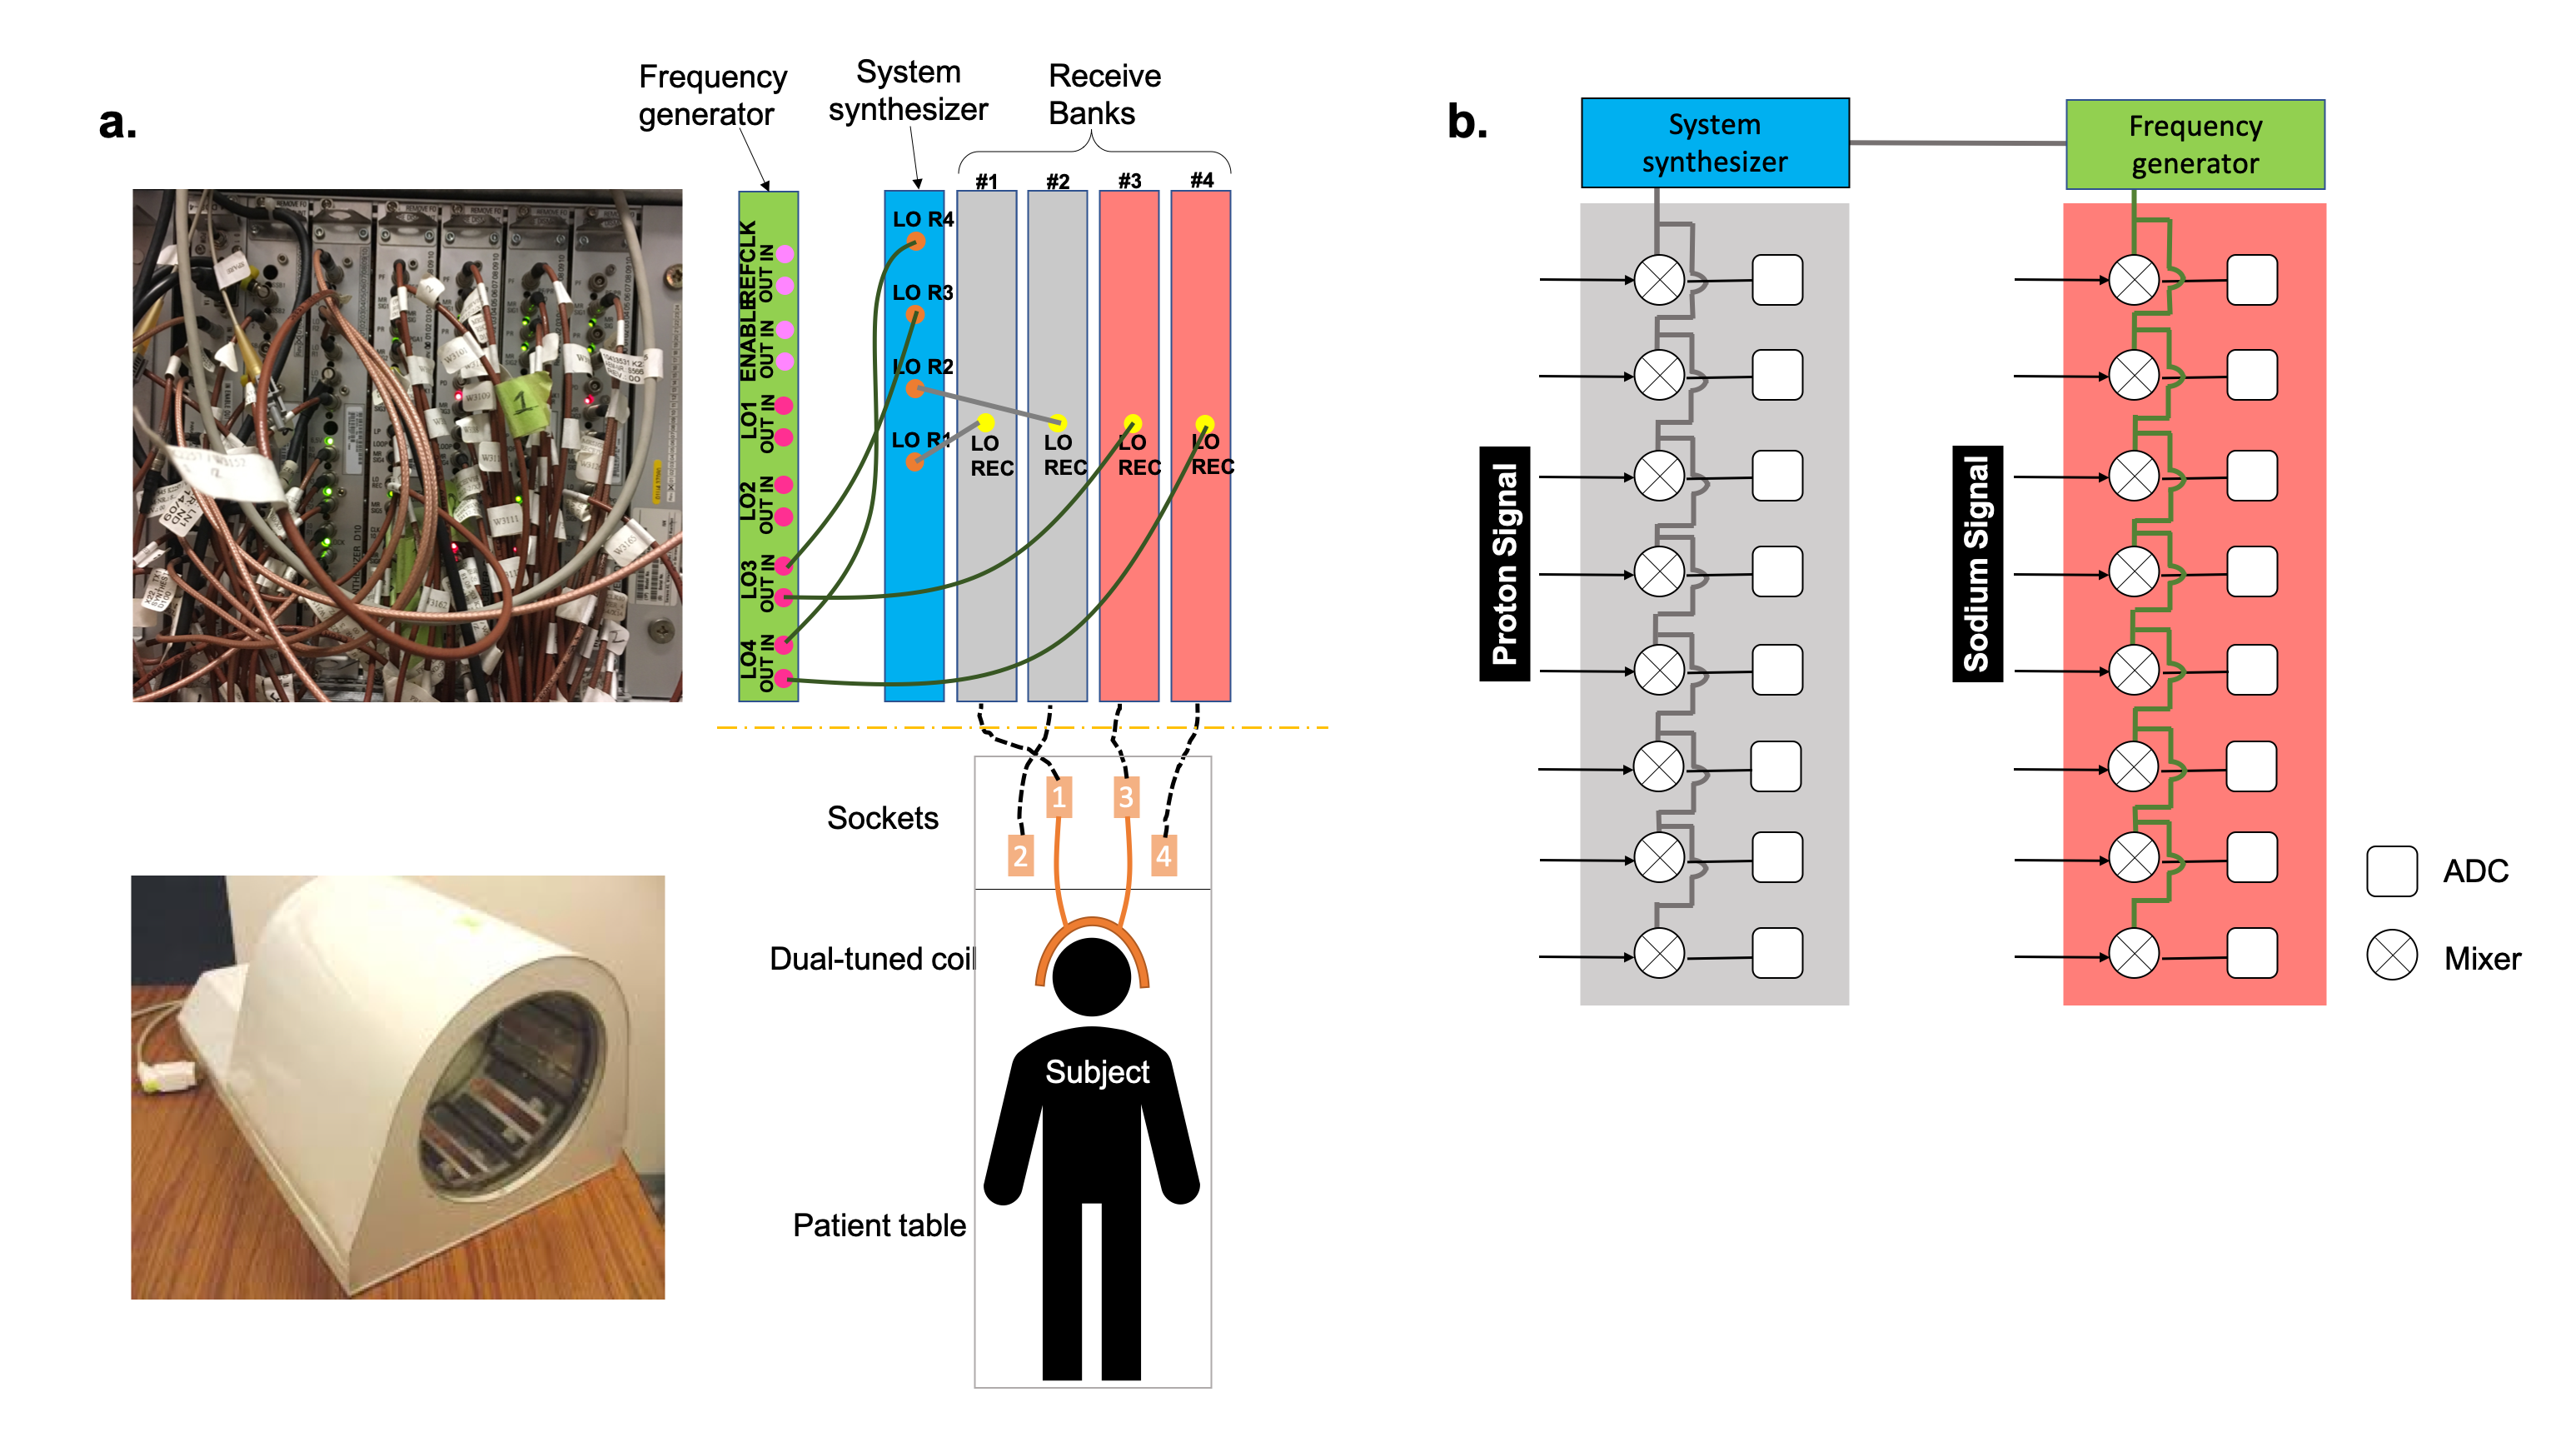
All experiments were performed at 7T (MAGNETOM, Siemens, Erlangen, Germany) using a dual-tuned coil developed in-house4. The receive chain was modified to enable simultaneous digitization signals at two different frequencies5. In a nutshell, the 1H and 23Na signals were sent to independent ADC modules each provided with a different demodulation frequency (Fig. 2). Residual imperfections in the demodulation frequency were corrected during reconstruction. All images were reconstructed in MATLAB (Mathworks, Natick, MA, USA) using the Fessler NUFFT toolbox 6. Due to the different gyromagnetic ratios, the sodium sampling rate corresponds to ~4x larger FOV than for protons. The sodium FOV was therefore reduced by averaging every 4 samples along the readout.
To verify the fidelity of our modified receive chain, we compared the SNR of the simultaneously acquired sodium images with a sodium-only reference scan7. On the proton side, we verified the accuracy of the multi-parametric 1H maps by comparing the measured values to a previously published MRF implementation8. For these experiments, a multi-compartment phantom holding 7 test tubes (1H T1: 200~1500ms, 1H T2: 20~300ms, ~0% 23Na) surrounded by 2.5g/L saline solution was used.
Finally, an in-vivo brain scan was performed, following informed consent in accordance with a protocol approved by our Institutional Review Board. Sequence parameters for both phantom and in-vivo experiments were as follows: 1H 256×256/ 23Na 64×64matrix, 1H 1×1mm2/ 23Na 3.8×3.8mm2 in-plane resolution, 5.0 mm slice thickness, 12 shots, total scan time 1minute 48 sec per slice.
Results & Discussion
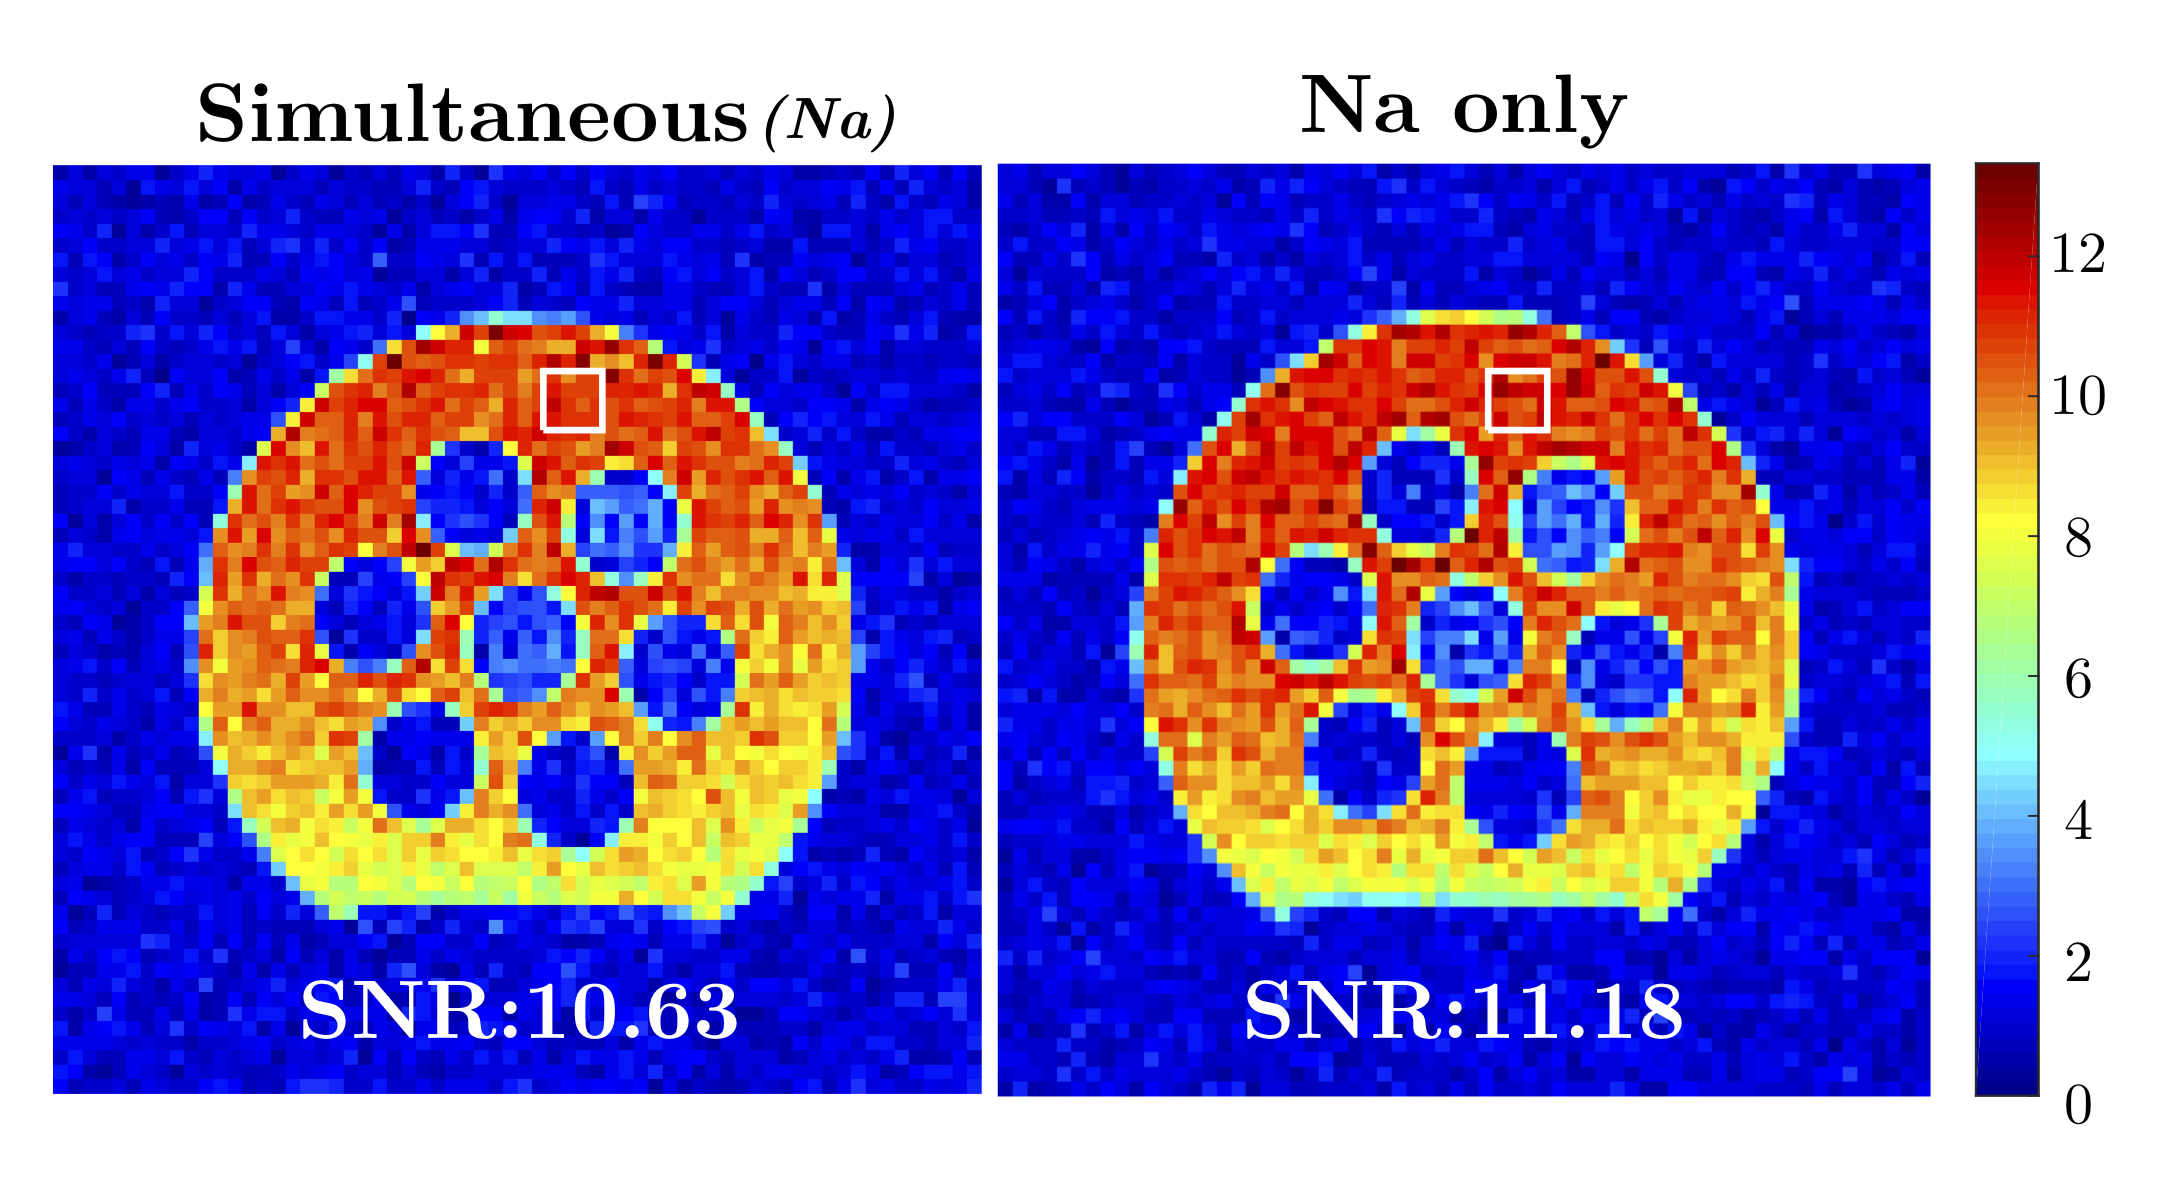
The SNR of 23Na image (Fig. 3) from the simultaneous acquisition shows no significant signs of degradation compared to a dedicated 23Na-only measurement (SNR of 10.63 vs 11.18). This confirms that the hardware modifications made to demodulate the 23Na signal during a 1H scan have no obvious impact on the image quality.
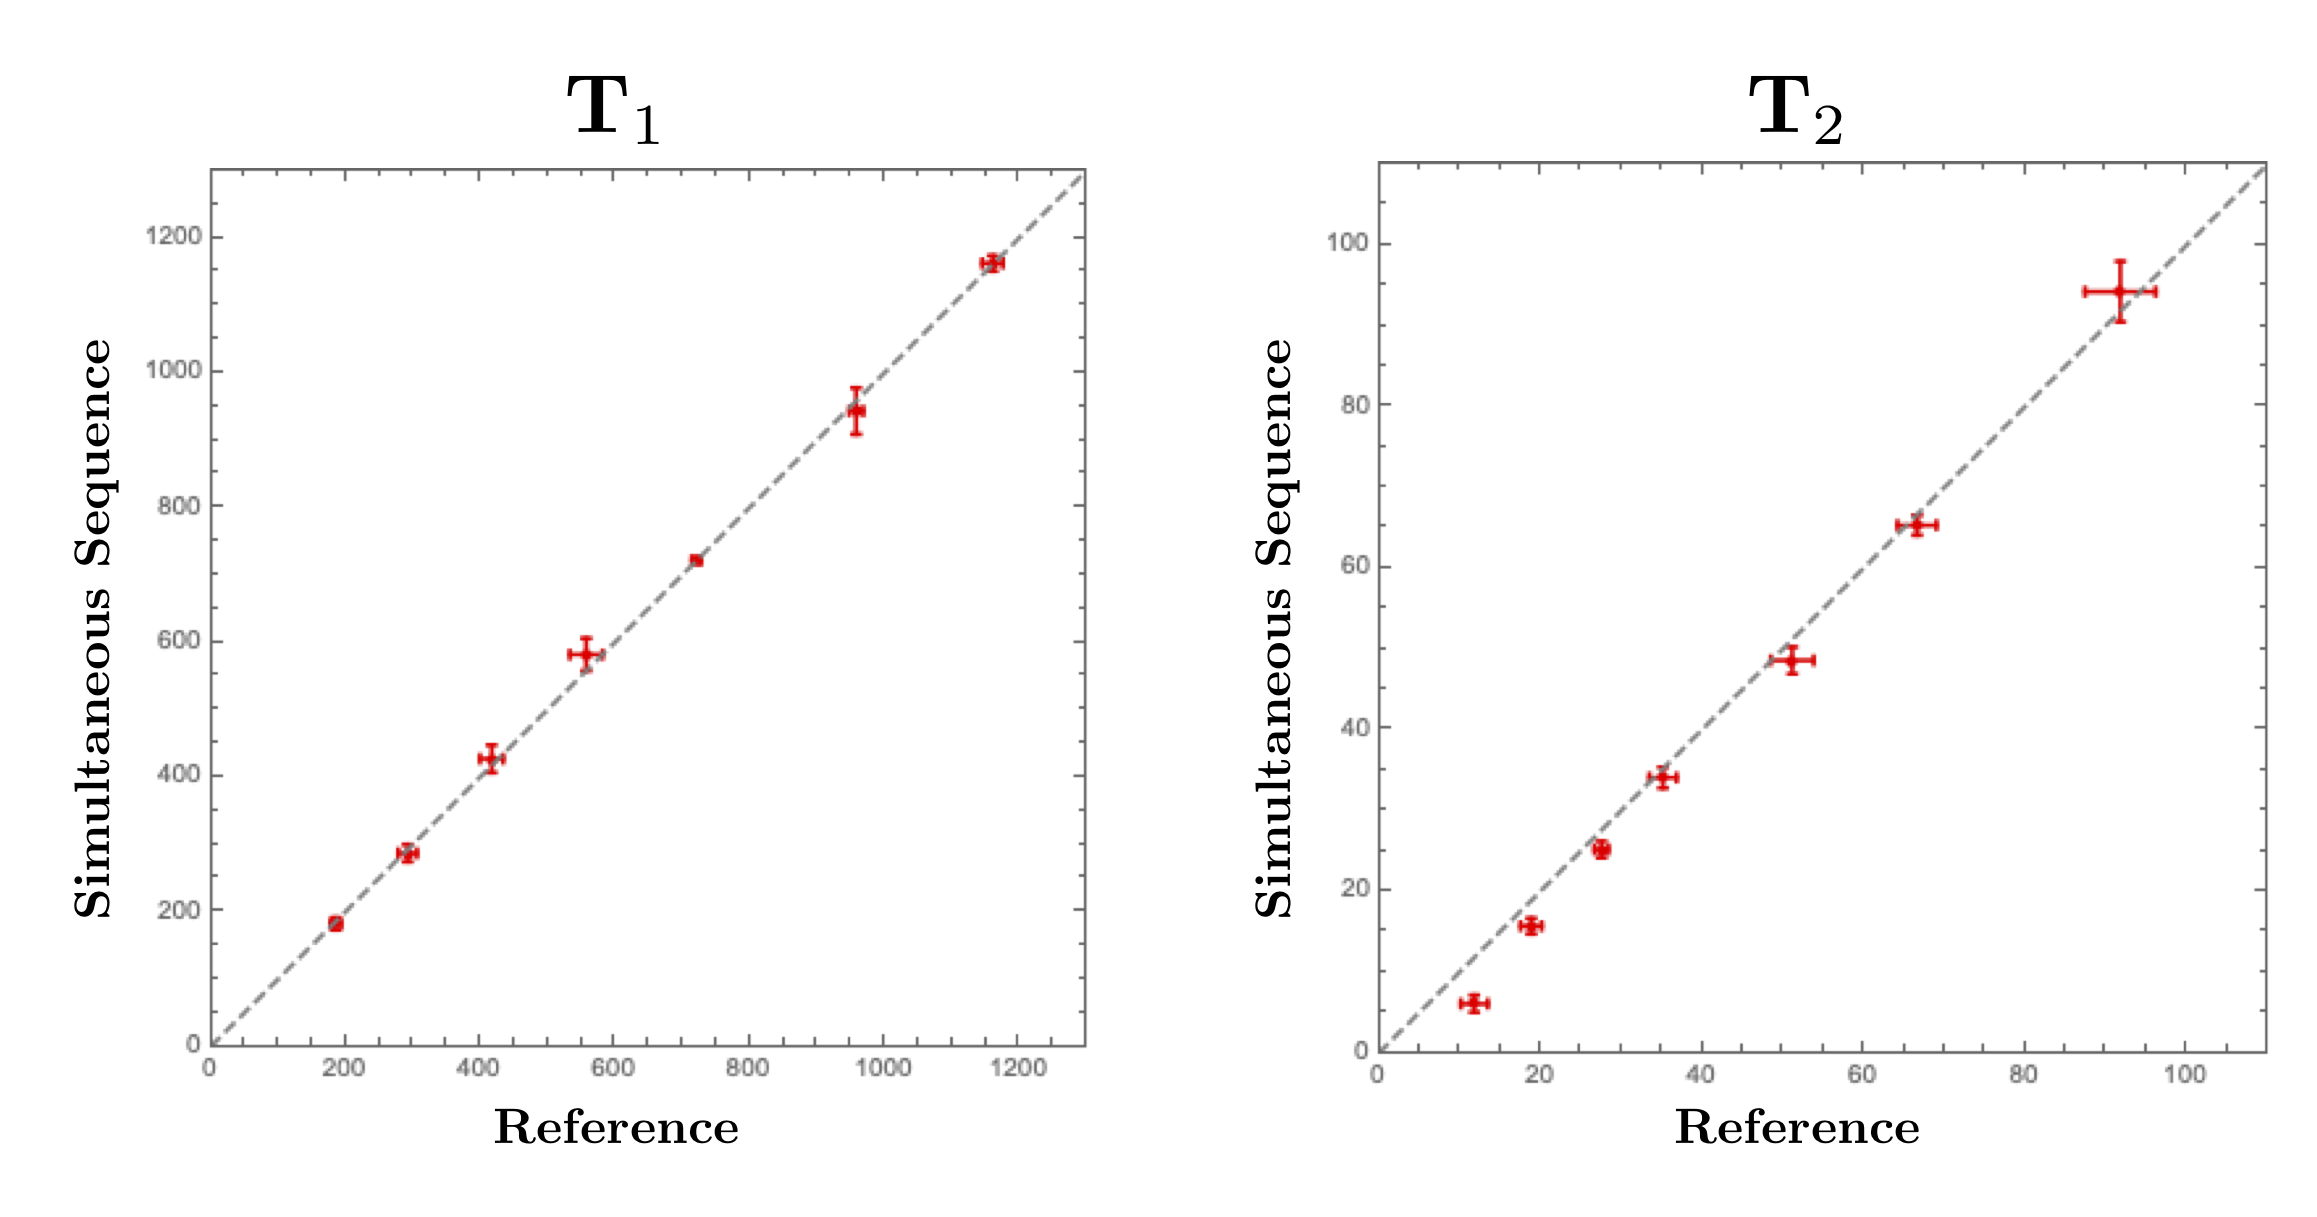
Because, in the current implementation, the 1H receive chain remains untouched, the SNR is preserved. However, we must still verify the accuracy and precision of the multi-parametric 1H maps. Figure 4 shows the accuracy of T1, T2 and B1+ obtained using the simultaneous acquisition compared to the reference method 8. The excellent correspondence between the two indicates that there are no adverse effects from the adjoining multi-nuclear excitations.
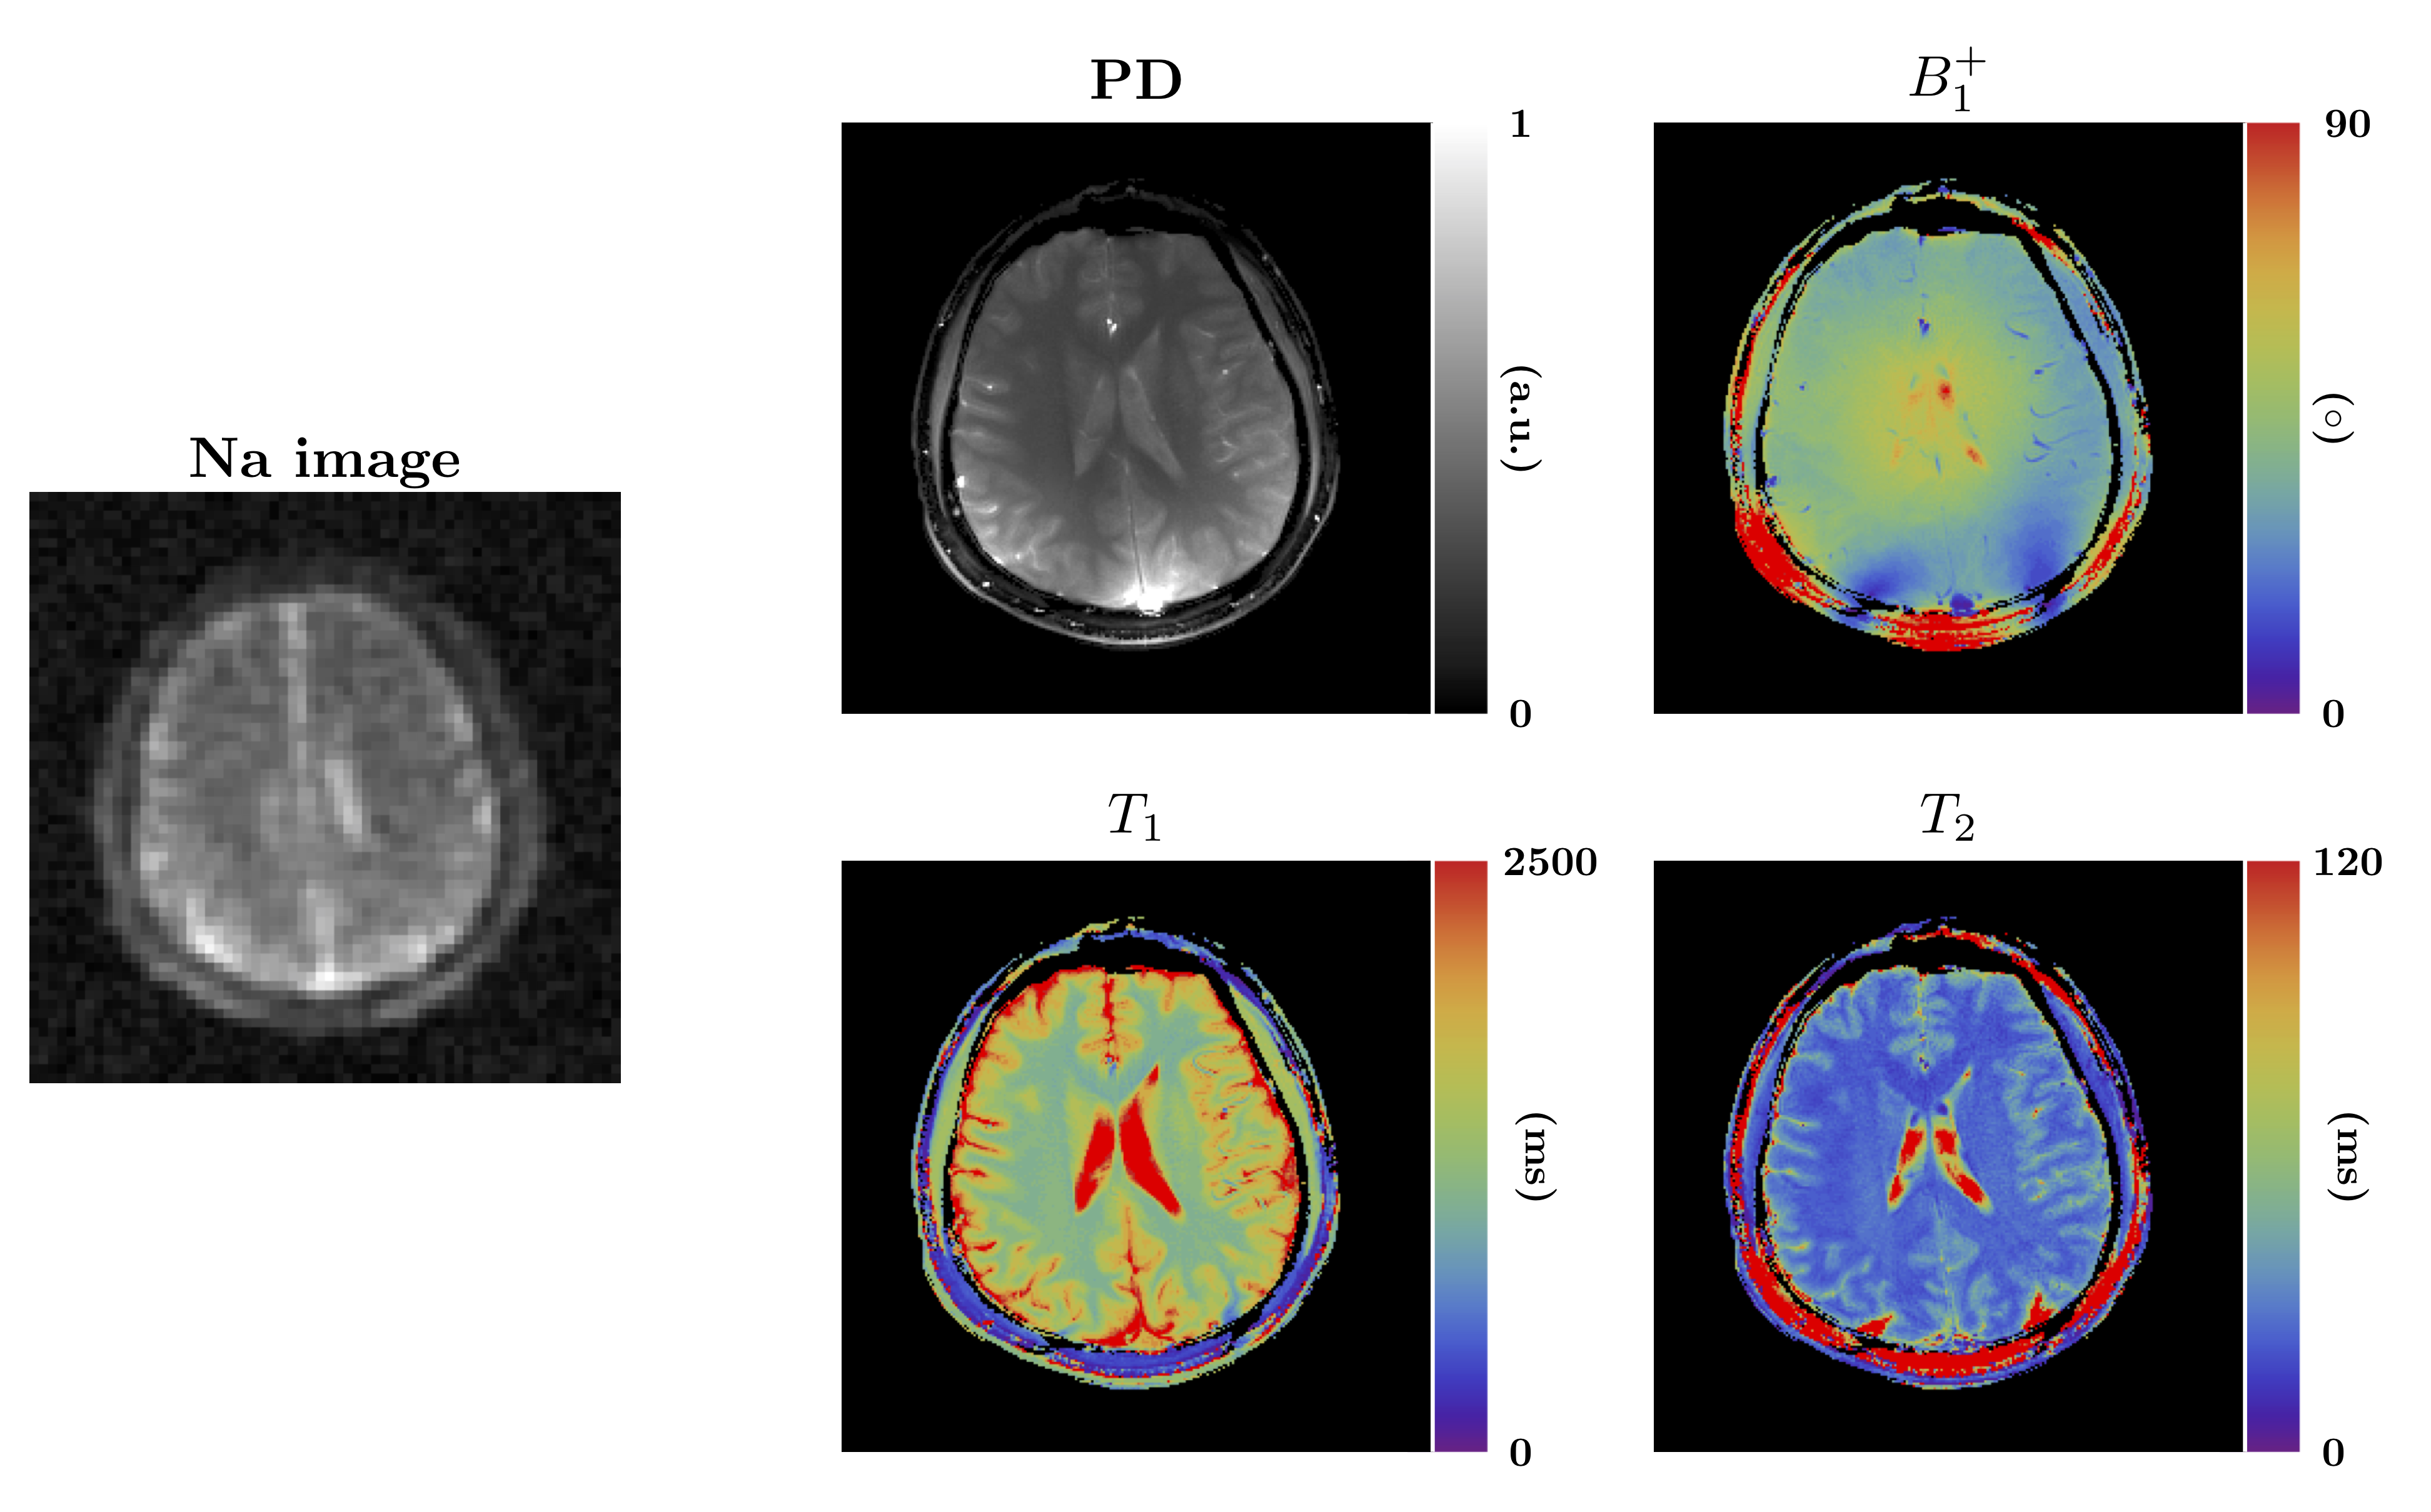
Figure 5 shows results from the in-vivo experiment. Because all the data are simultaneously acquired using the same gradients, the 23Na image and 1H multi-parametric maps (PD, T1, T2, B1+) are perfectly co-registered. Currently the echo time is still a bit long for 23Na (TE = 1.1ms), but this can be improved by switching to an asymmetric excitation pulse or changing the sequence from 2D to 3D using non-selective excitations. In addition, the SNR can be further improved by switching to a more optimized k-space trajectory with longer dwell times or spirals. On the proton side, our technique could benefit from an improved coil design (currently under development) with a better B1+ uniformity and higher transmit efficiency. In particular, the residual artifacts the T2 map are expected to disappear if the B1+ voids near the back of the head can be reduced.
Conclusion
We demonstrated a novel approach to acquire co-registered 23Na images “for free” during a 1H MRF scan, which enables simultaneous 1H quantitative mapping and 23Na imaging without prolonging scan time.Acknowledgements
The research reported in this publication was supported by the NIH/NIBIB grant R01 EB026456, and performed under the rubric of the Center for Advanced Imaging Innovation and Research, a NIBIB Biomedical Technology Resource Center (P41 EB017183).References
[1] Madelin G, & Regatte R R. Biomedical applications of sodium MRI in vivo. Journal of Magnetic Resonance Imaging, 2013;38:511-529.
[2] Ma D, Gulani V, Seiberlich N, Liu K, Sunshine J L, Duerk J L, & Griswold M A. Magnetic resonance fingerprinting. Nature, 2013;495:187–192.
[3] Cloos M A, Knoll F, Zhao T, Block K T, Bruno M, Wiggins G C, & Sodickson D K. Multiparametric imaging with heterogeneous radiofrequency fields. Nature communications 2016;7:12445.
[4] Wiggins G C, Brown R, Fleysher L, Zhang B, Stoeckel B, Inglese M, & Sodickson D K. A nested dual frequency birdcage/stripline coil for sodium/proton brain imaging at 7T. ISMRM 2010, # 2159).
[5] Meyerspeer M, Magill A W, Kuehne A, Gruetter R, Moser E, & Schmid A I. Simultaneous and interleaved acquisition of NMR signals from different nuclei with a clinical MRI scanner. Magnetic resonance in medicine, 2016;76:1636-1641.
[6] Fessler J A, & Sutton B P. Nonuniform fast Fourier transforms using min-max interpolation, IEEE Transactions on Signal Processing, 2003;51:560-574.
[7] Kellman P, & McVeigh E R. Image reconstruction in SNR units: a general method for SNR measurement. Magnetic resonance in medicine, 2005;54:1439-1447.
[8] Akasaka T, Fujimoto K, Cloos M A, & Okada T. In-Vivo Evaluation of MR Fingerprinting at 7T. ISMRM 2018, # 3293
Figures