0485
Volumetric mapping of intra- and extracellular pH in glioma patients using 31P MRSI at 7 Tesla1Medical Physics in Radiology, German Cancer Research Center (DKFZ), Heidelberg, Germany, 2Radiology, German Cancer Research Center (DKFZ), Heidelberg, Germany
Synopsis
In vivo phosphorus magnetic resonance spectroscopic imaging (31P MRSI) enables the non-invasive mapping of absolute intra- and extracellular pH values of the human brain. However, achieving reasonable spatial resolution for studies of brain tumor patients is challenging due to low phosphate concentrations. In this study we demonstrate that 31P MRSI at 7 Tesla enables volumetric mapping of intra- and extracellular pH for studies of brain tumor patients. Volumetric pH maps with actual voxel size of 8 ml can be obtained within 30 minutes acquisition duration, and may provide novel insight into the pathophysiology of brain tumors.
Introduction
Investigation of tissue pH is of particular importance for brain cancer research. In vivo phosphorus magnetic resonance spectroscopic imaging (31P MRSI) enables the non-invasive mapping of absolute intracellular (ipH) and extracellular pH values (epH) via the pH-dependent chemical shifts of the intracellular (Pi) and extracellular inorganic Phosphate resonance (ePi)1. However, pH mapping in the human brain using 31P MRSI with reasonable spatial resolution is challenging due to the low concentration of phosphates, particularly ePi. To increase the sensitivity of 31P MRSI, ultra-high fields (B0 ≥ 7T), the 31P-1H Nuclear Overhauser Effect (NOE), as well as the low-rank properties of MRSI datasets2 can be utilized.
The purpose of this study was to demonstrate feasibility of simultaneous volumetric mapping of intra- and extracellular pH values in brain tumor patients by 31P MRSI.
Methods
Two patients with high-grade glioma (both male, WHO IV) and one patient with a low-grade glioma (female, WHO II) were examined on a 7-T whole-body MR system (Siemens) with a double-resonant 31P-1H head coil with 32 31P-receiver channels (RAPID Biomedical). 31P MRSI was acquired using an acquisition-weighted 3D CSI sequence (TR = 250ms, α = 20°, Δf = 5000 Hz, 1024 data points). Different spatial resolutions were applied in each patient (Figs. 1-3). For 31P-1H NOE, an adiabatic 1H inversion of the water resonance was applied prior to 31P excitation.
31P MRSI datasets were processed as follows: To combine localized 31P spectra from individual receiver channels, a whitened singular value decomposition algorithm was applied3. To improve quantification robustness, a low-rank approximation of MRSI datasets was obtained by truncation of trailing singular values of the spatial-spectral Casorati matrix. The chosen rank (12,43,44 for patient 1,2,3, respectively) suppressed noise by a factor of 3. Finally, datasets were processed by one-fold spatial and spectral zero-filling and application of a 10-Hz Gaussian filter in the time domain.
Localized 31P spectra were evaluated for 11 detectable resonances (Phosphocreatine (PCr), 3-times Adenosine-5’-Triphosphate (ATP), Nicotinamide-Adenine-Dinucleotide (NAD), Phosphocholine (PC), Phosphoethanolamine (PE), Pi, ePi, Glycerophosphocholine (GPC), Glycerophosphoethanolamine (GPE)) using the AMARES algorithm4 in jMRUI5 v5.2. ipH and epH maps were calculated employing the modified Henderson-Hasselbalch equation (pKA = 6.77, δA = 5.70 ppm, δHA = 3.23 ppm)1 to the chemical shift difference between PCr and Pi, and PCr and ePi, respectively. Both pH maps were masked to remove contributions from muscles. Additionally, unreliable fit results were masked in epH maps.
Results
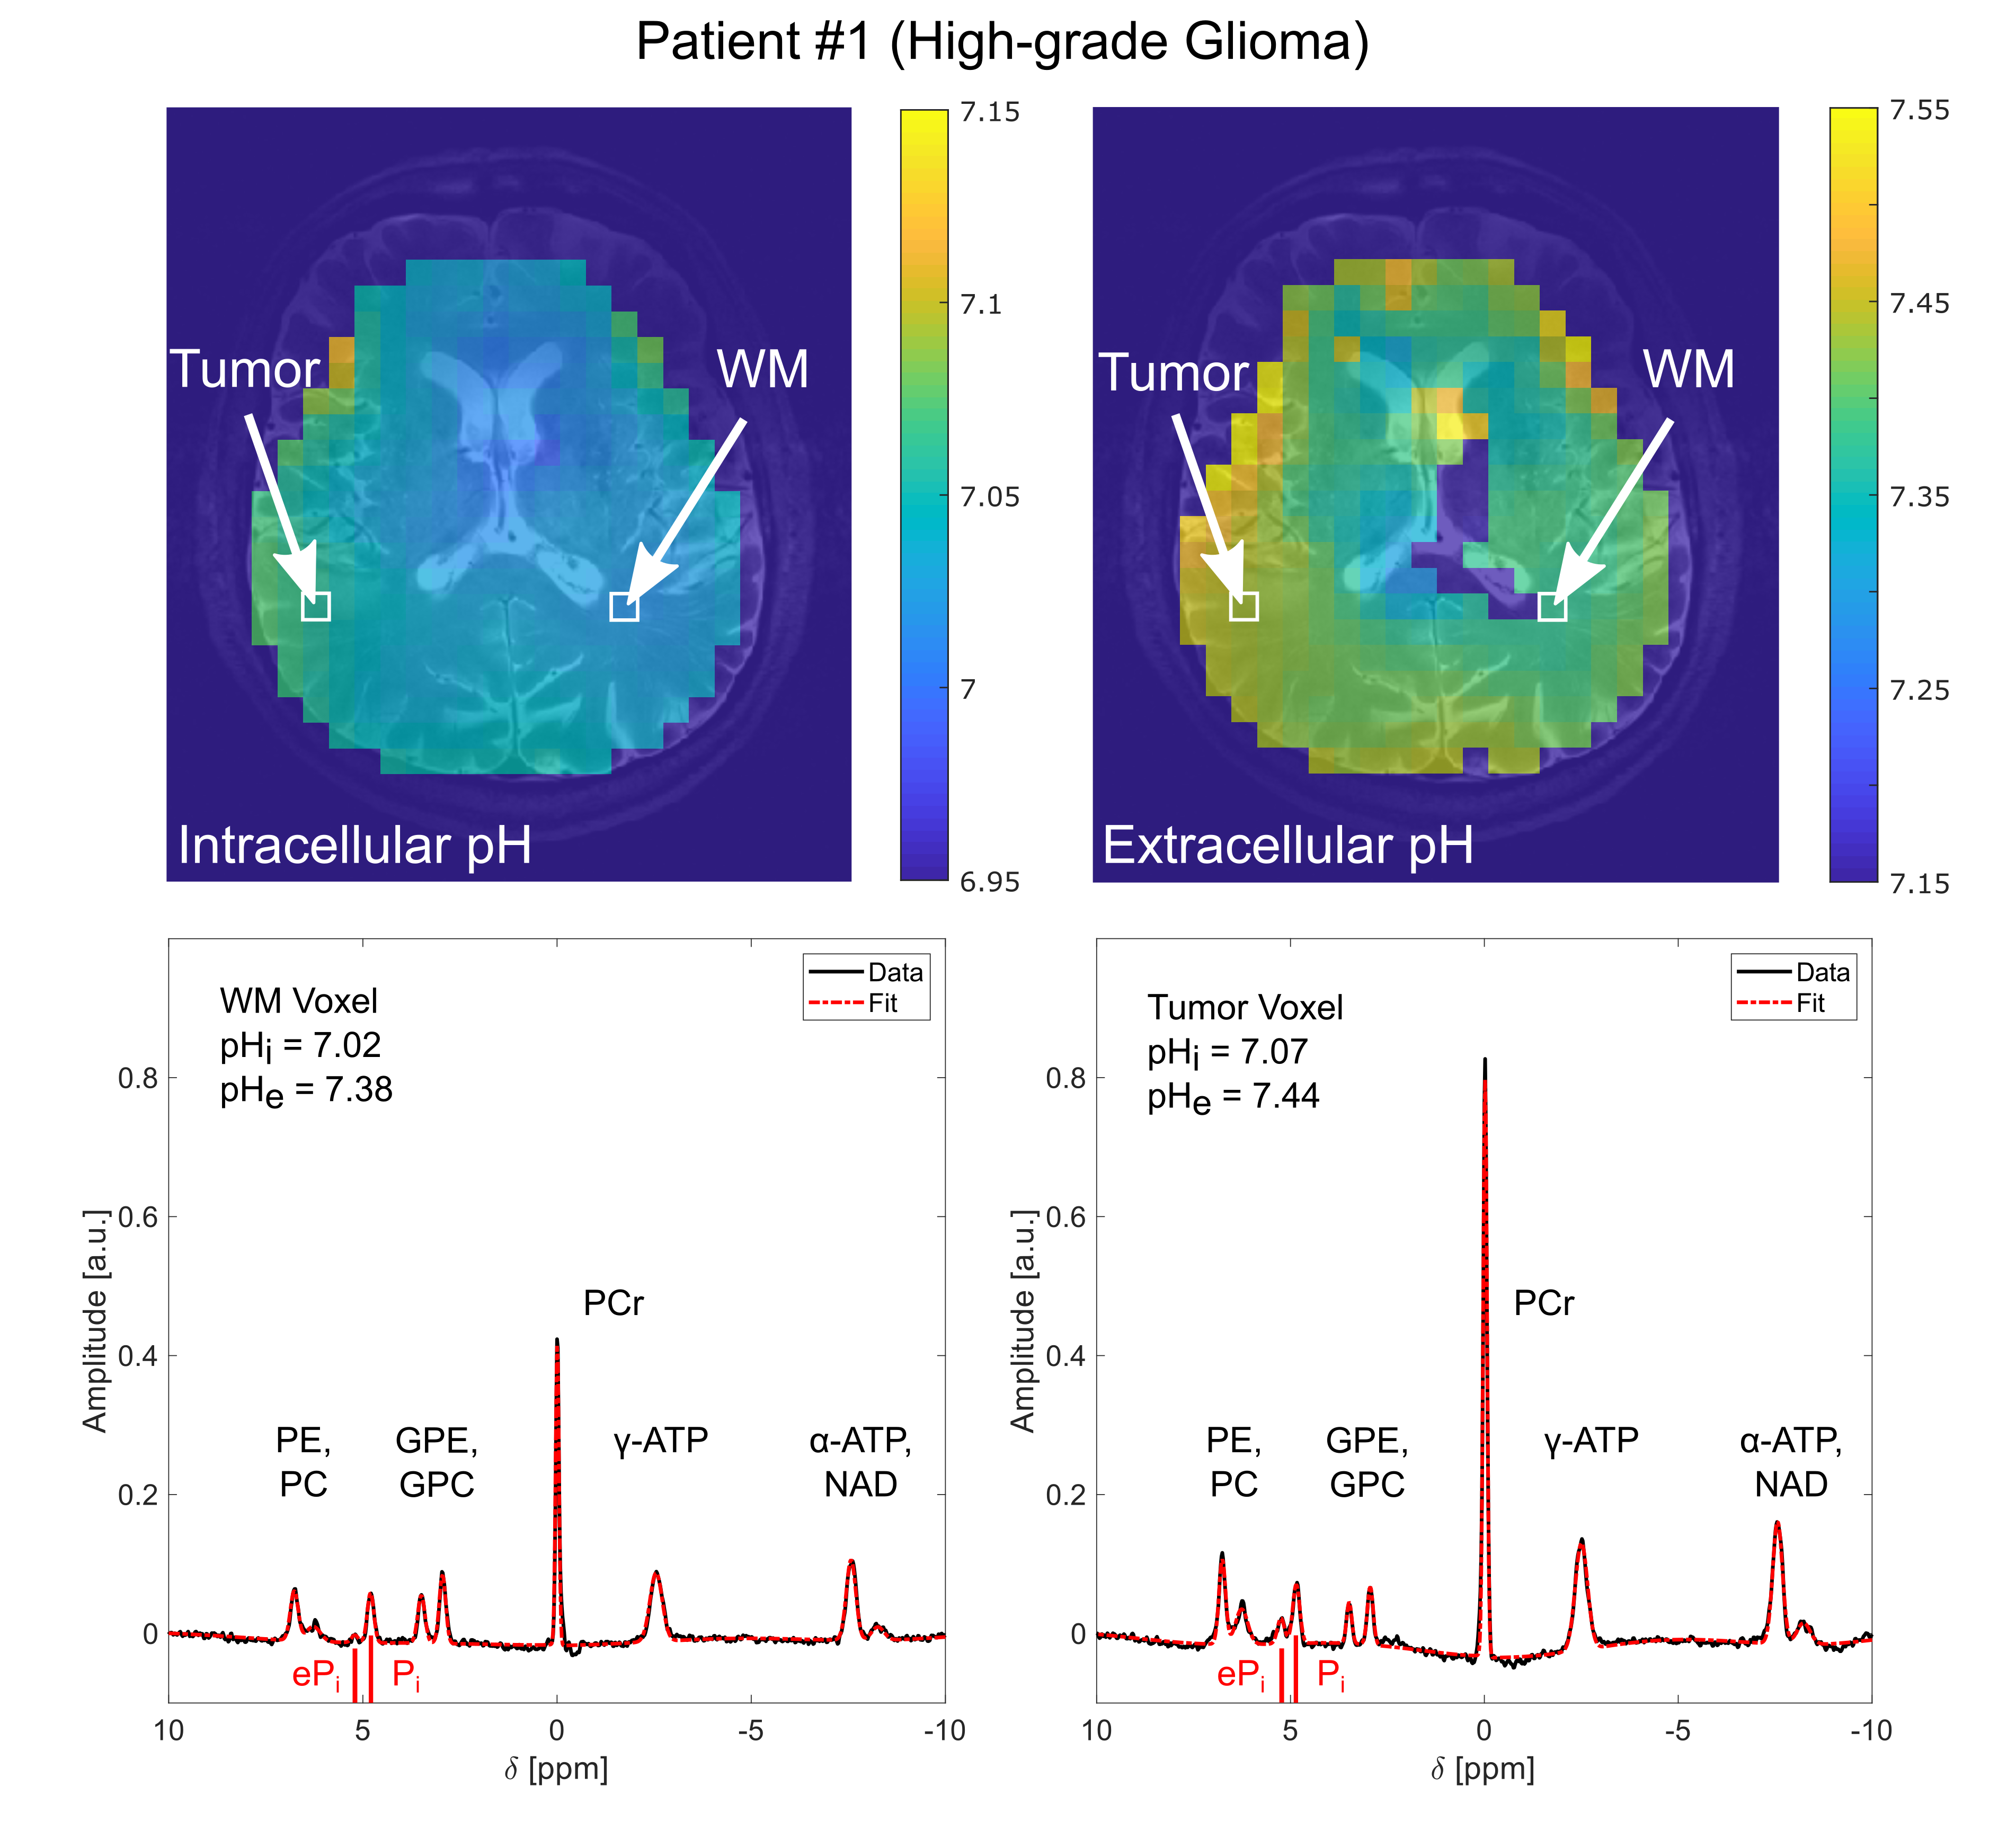
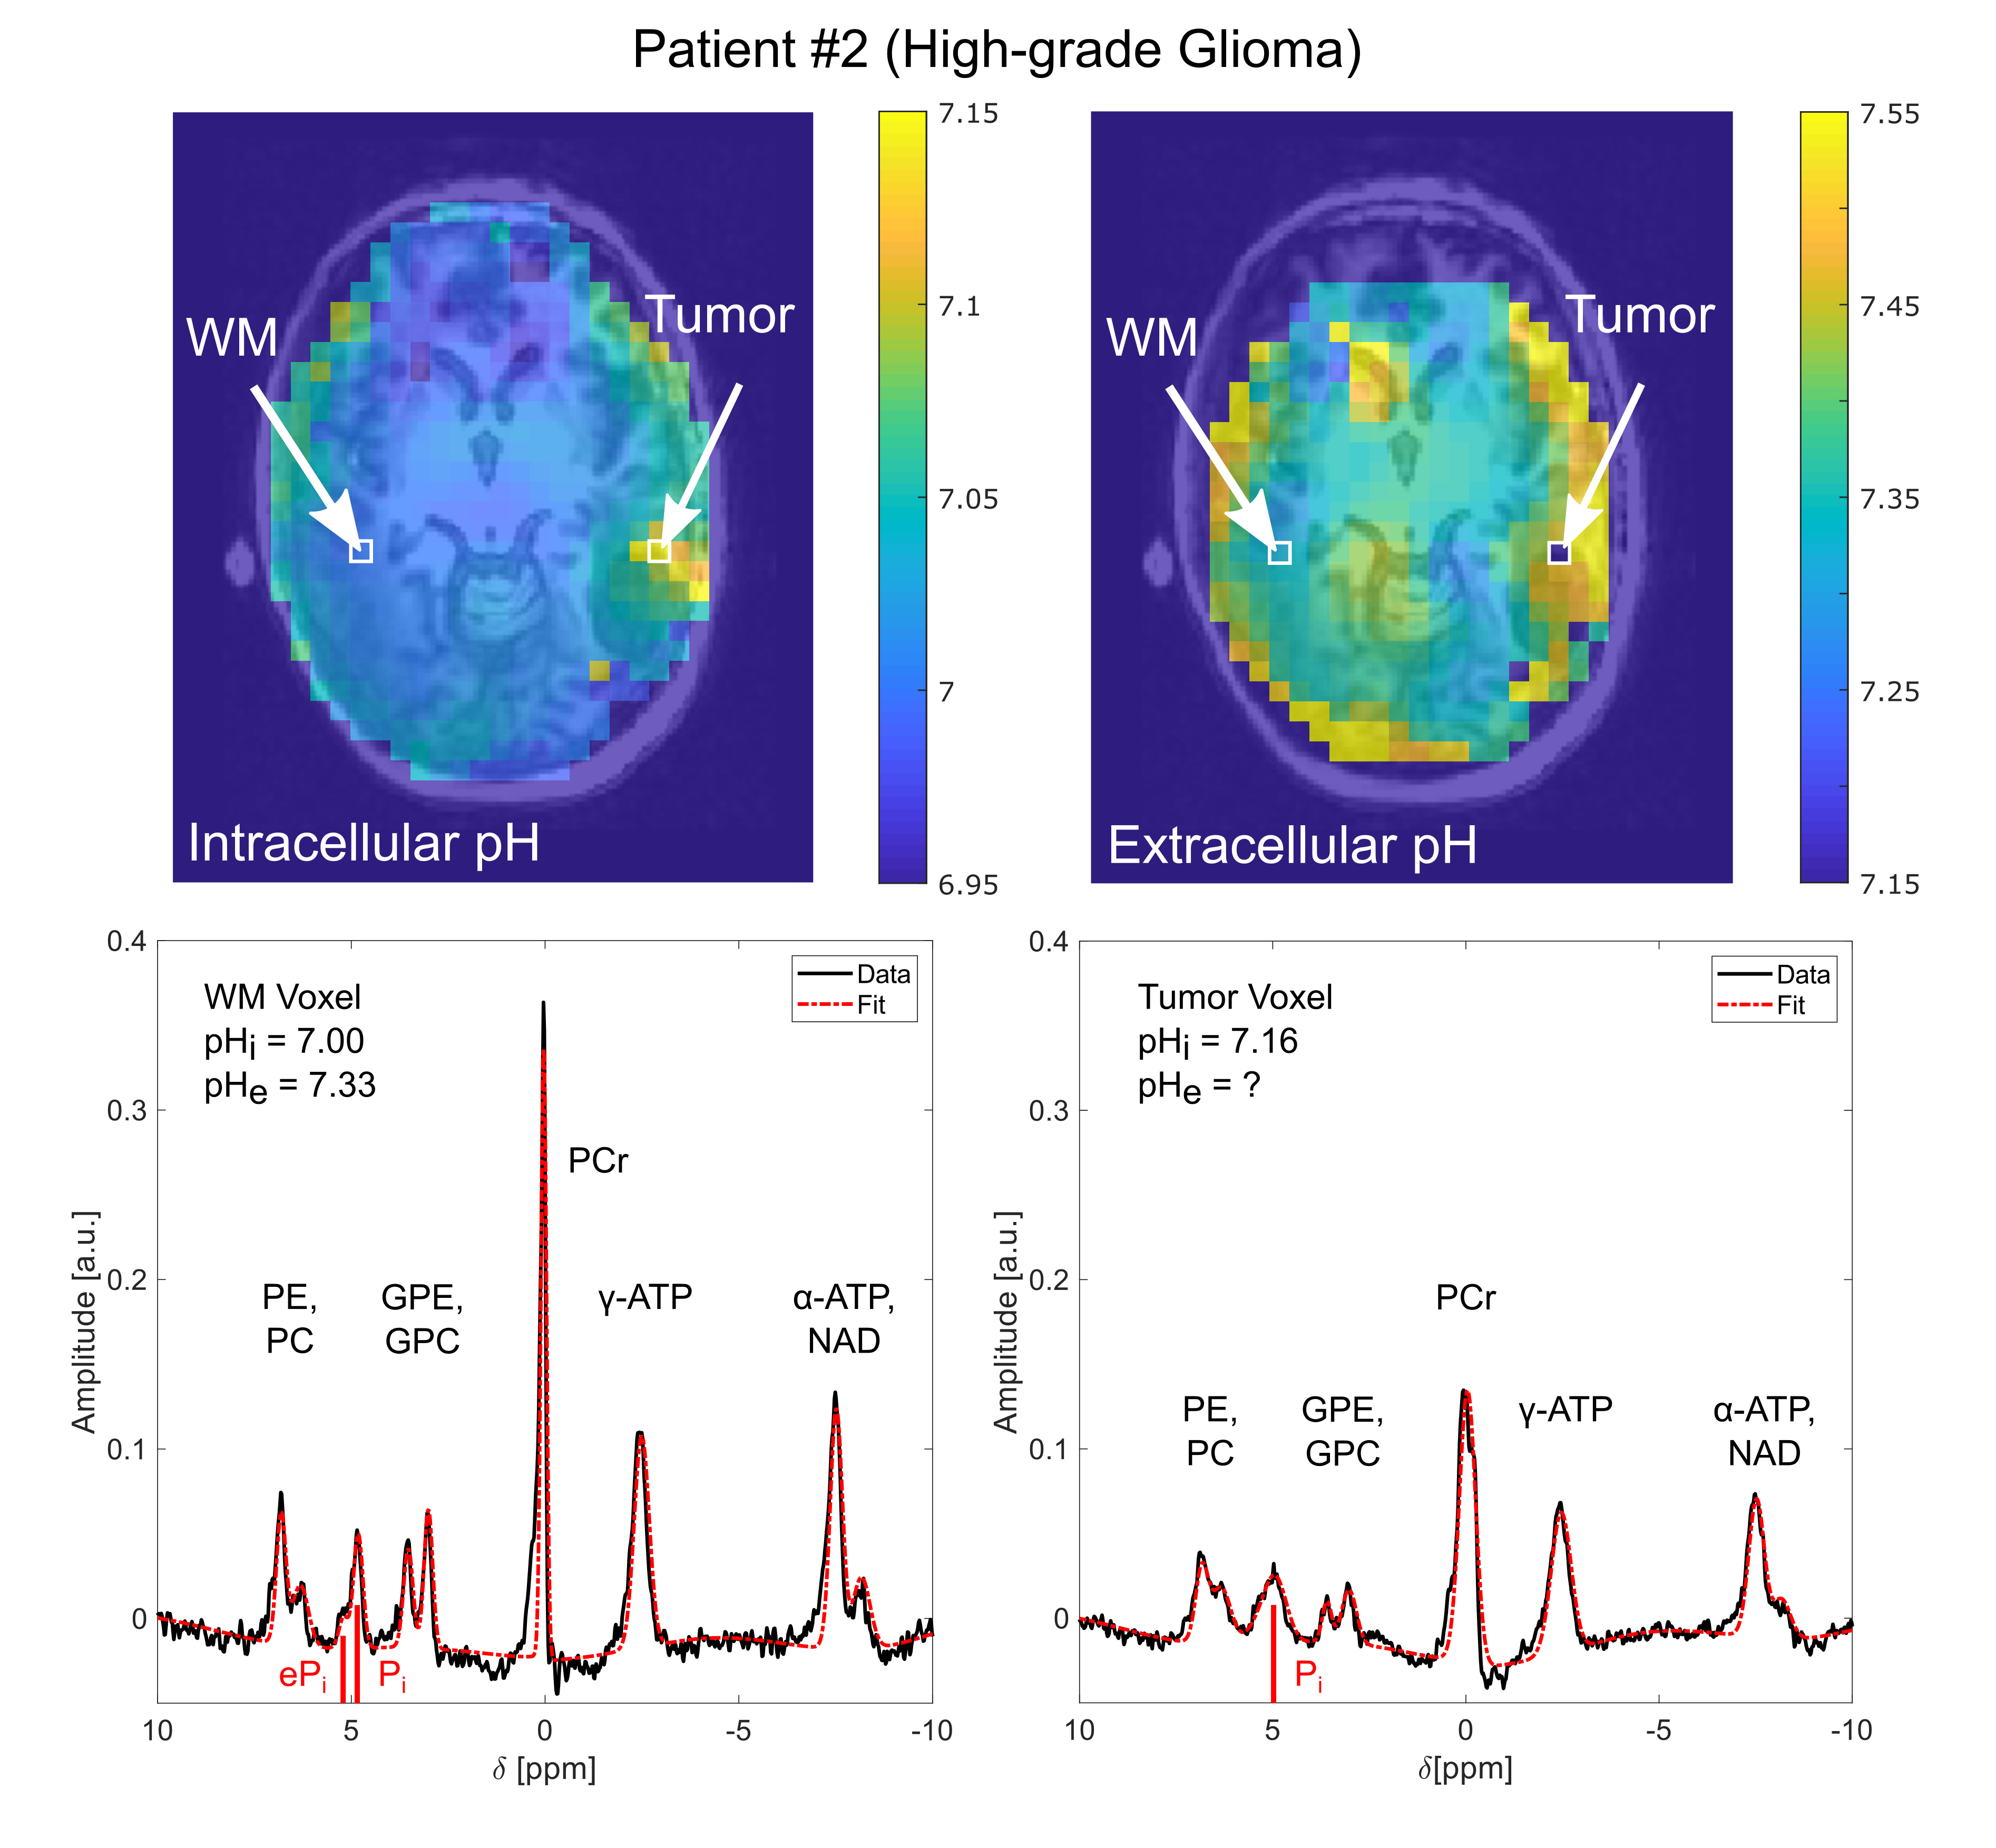
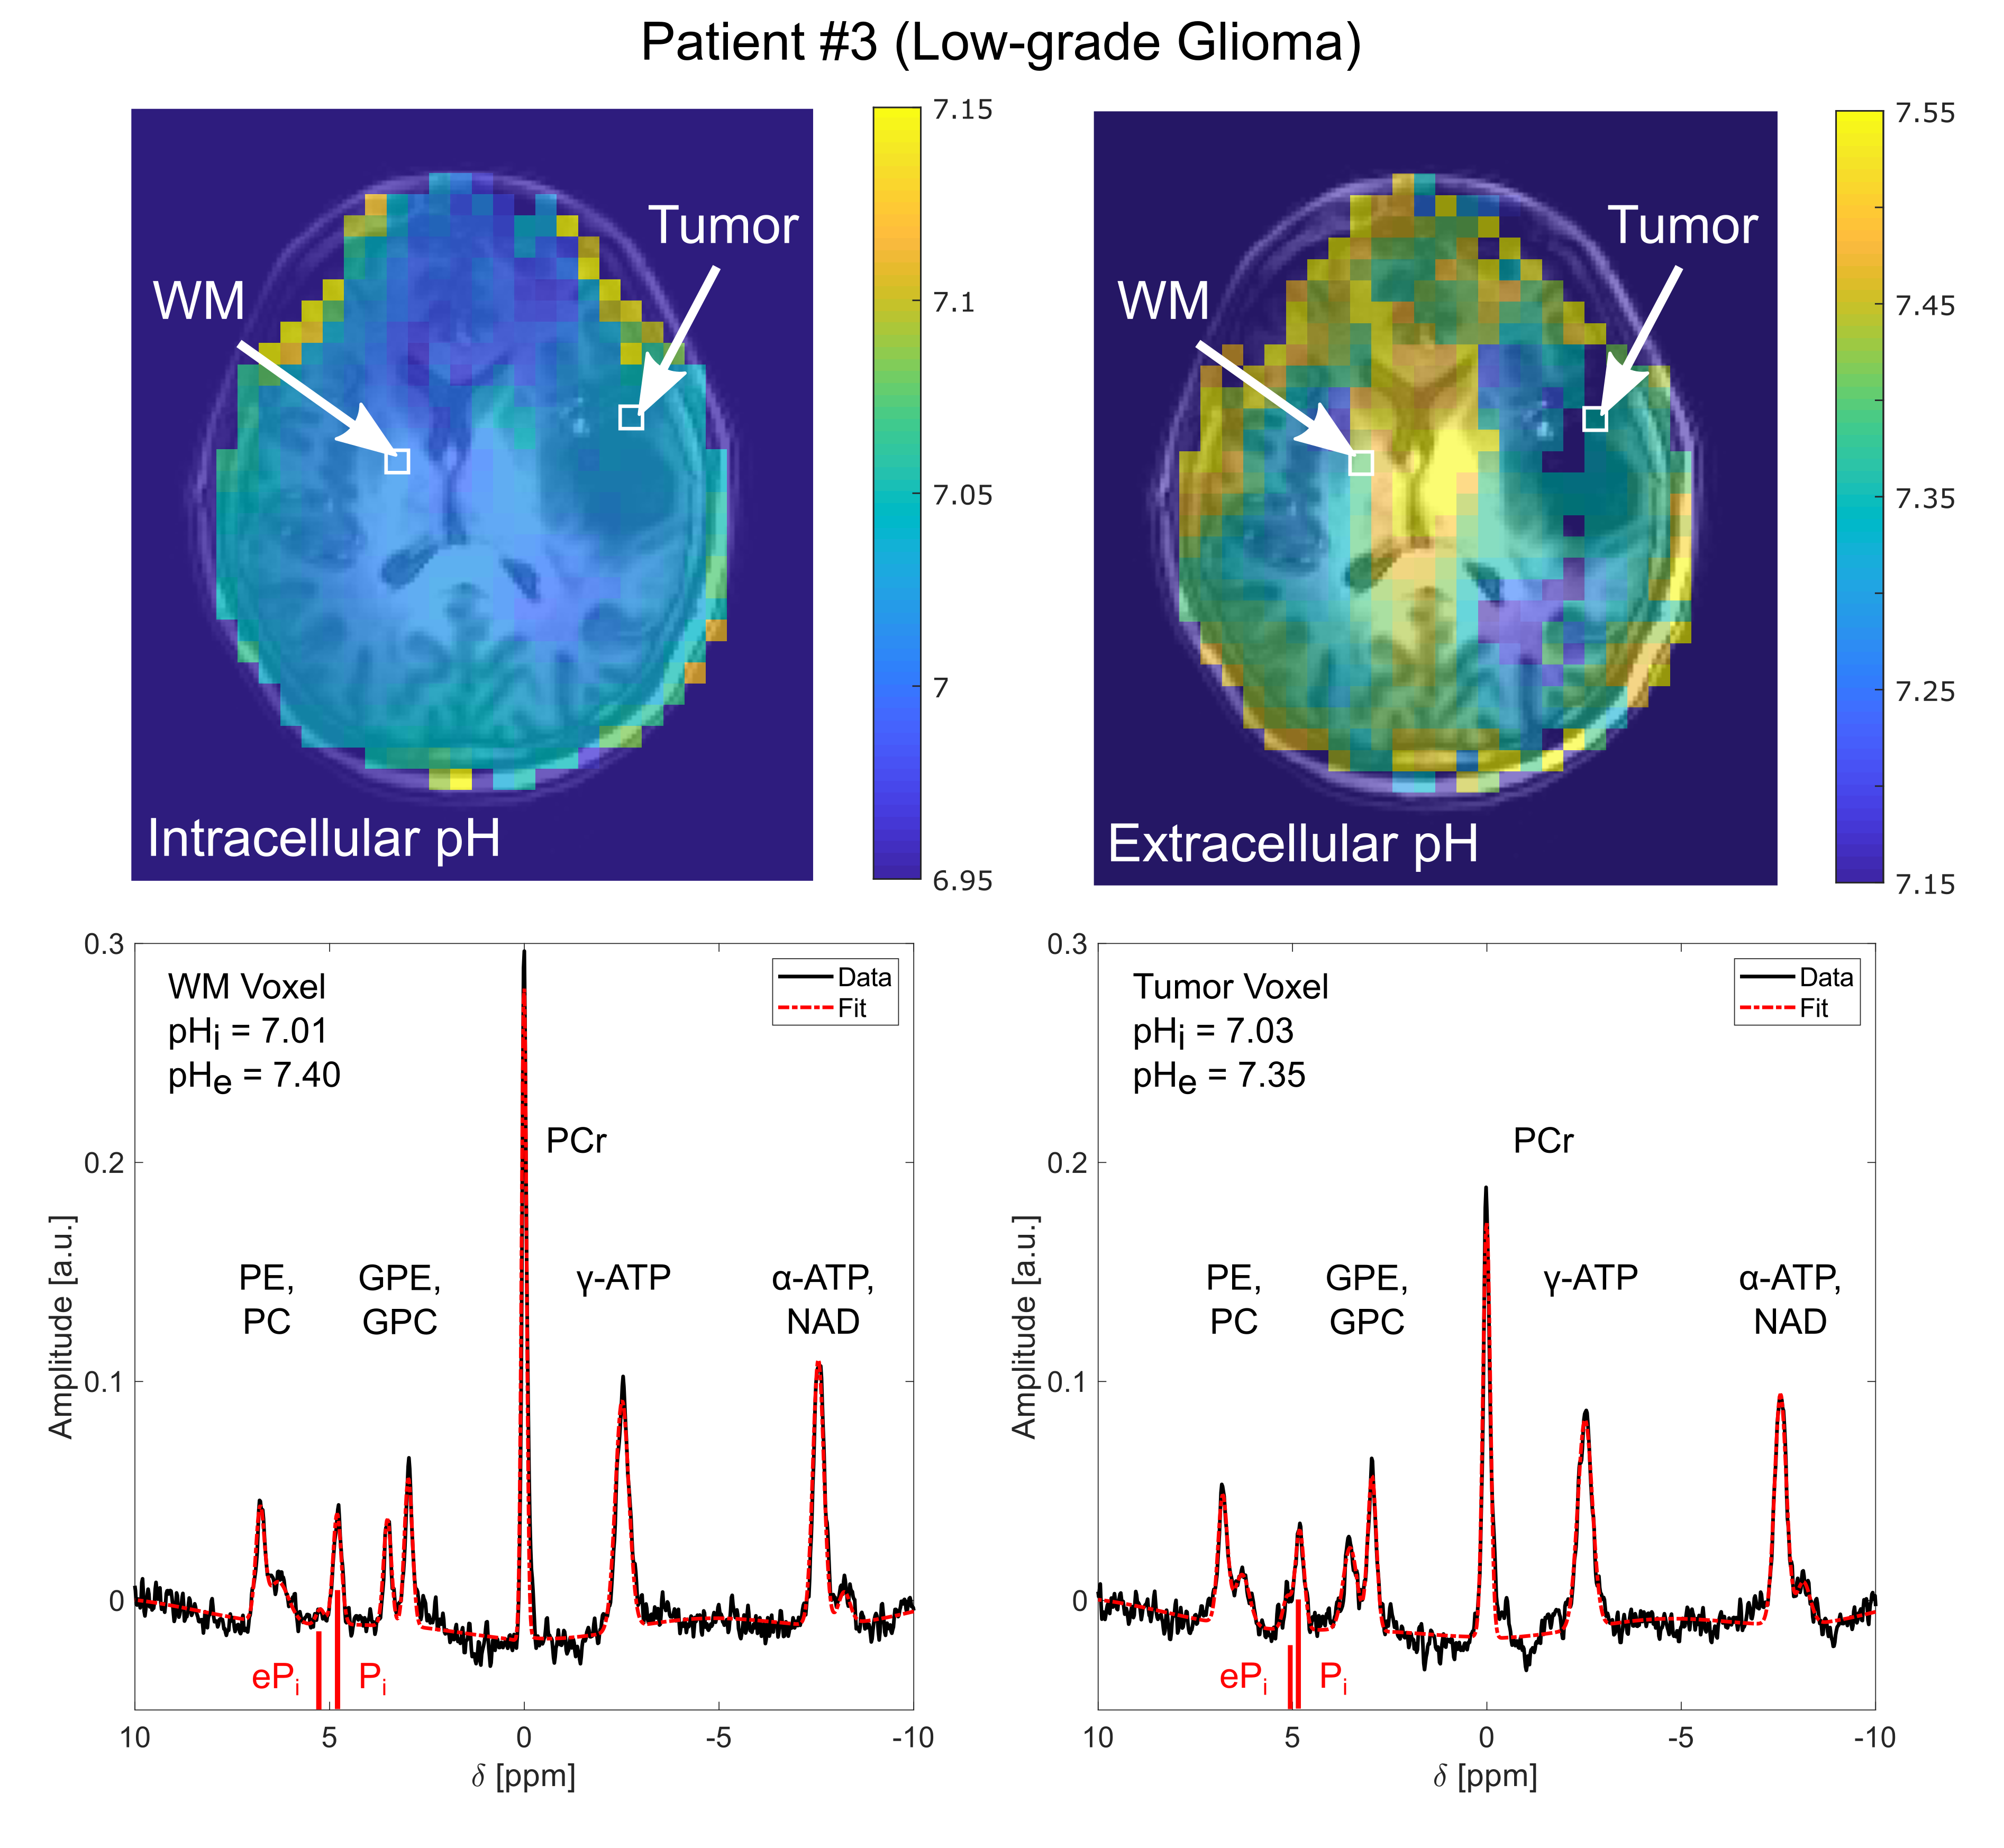
Localized 31P spectra of high signal-to-noise ratio were obtained in all patients and enabled robust quantification of ipH and epH via the Pi and ePi resonances (Figs. 1-3). Volumetric ipH and epH maps show local differences between regions of white matter, grey matter, and tumor tissue (Figs. 1-3).
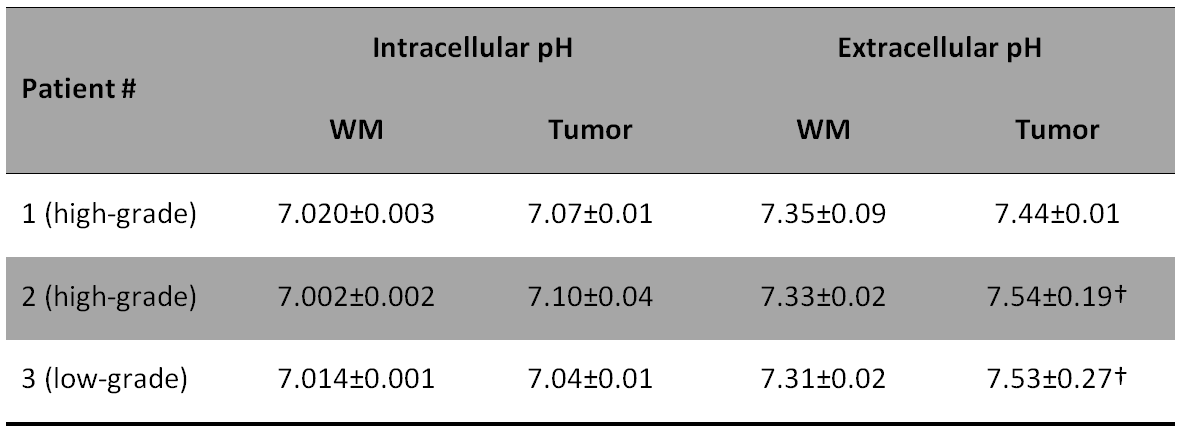
In the patients with high-grade glioma, both ipH and epH increase in the tumor region (Figs. 1&2). Particularly in the maps with higher spatial resolution, hot spots of increased ipH in the tumor region are visible; there, also a strong broadening of the 31P resonance can be observed (Fig. 2). In contrast, the increase in pH is less pronounced in the case of the low-grade glioma patient (Fig. 3). Table 1 summarizes the mean pH values (displayed + 8 surrounding voxels in slice, indicated in Figs. 1-3) in the healthy and diseased areas.
Discussion
The actual voxel sizes of 6.5-8 ml were achieved by the combined application of ultra-high B0, a 31P-receiver array, weighted k-space acquisition (~190% increased voxel size), and 31P-1H NOE (~25% enhancement for PCr and Pi), and enabled sufficient separation between differing tissues while maintaining high spectral quality. Additionally, the low-rank approximation improved ePi quantification while preserving pH differences within the pH maps.
The results obtained for ipH agree well with earlier reports for healthy brain tissue6, as well as for higher ipH in higher-grade gliomas7. The overall higher values of epH in comparison to ipH match the expectation of an alkaline ePi environment. Interestingly, epH maps exhibit highest pH in the periphery and ventricles, where Ren et al.8 recently assigned the ePi pool to phosphates of meningeal fluids (blood, cerebrospinal fluids, pH > 7.35). Consequently, the increased epH in high-grade tumors could reflect increased vascularization or blood-brain barrier damage.
Conclusion
In this study we demonstrated that mapping of intra- and extracellular pH for studies of brain tumor patients is feasible by 31P MRSI at 7T. Volumetric high-quality pH maps with actual voxel size of 8 ml can be obtained within 30 minutes acquisition duration, and may provide novel insight into the pathophysiology of brain tumors. The investigation of the pH heterogeneity of gliomas is subject of an ongoing patient study.Acknowledgements
No acknowledgement found.References
1 De Graaf RA. In vivo NMR spectroscopy, principles and techniques, 2nd ed. Chichester, United Kingdom: Wiley, 2007.
2 Liang ZP. Spatiotemporal imaging with partially separable functions. In IEEE International Symposium on Biomedical Imaging, Arlington, VA, USA, 2007. pp. 988–991.
3 Rodgers CT, Robson MD. Receive Array Magnetic Resonance Spectroscopy: Whitened Singular Value Decomposition (WSVD) Gives Optimal Bayesian Solution. Magn Reson Med 2010;63:881-891.
4 Vanhamme L, et al. Improved Method for Accurate and Efficient Quantification of MRS Data with Use of Prior Knowledge. J Magn Reson 1997;129:35–43.
5 Naressi A, et al. Java-based graphical user interface for the MRUI quantitation package. Magn Reson Mater Phys Biol Med 2001;12:141–152.
6 Dudley J, et al. Tissue dependent metabolism in the human brain suggested by quantitative phosphorus-31 MRSI. J Spectrosc Dyn 2014;4:19.
7 Maintz D, et al. Phosphorus-31 MR spectroscopy of normal adult human brain and brain tumors. NMR Biomed 2002;15:18-27.
8 Ren J, et al. Unveiling a hidden 31P signal coresonating with extracellular inorganic phosphate by outer-volume-suppression and localized 31P MRS in the human brain at 7T. Magn Reson Med 2018;00:1-9. https://doi.org/10.1002/mrm.27121.
Figures