0457
Accelerated whole-chest 4D flow imaging without navigator echo1Medical College of Wisconsin, Milwaukee, WI, United States, 2University of Michigan, Ann Arbor, MI, United States
Synopsis
4D flow MRI allows for thorough evaluation of hemodynamic patterns. Nevertheless, 4D flow imaging is very time consuming from both image acquisition and reconstruction perspectives. In this study, we provide preliminary data about accelerated sub-10-minutes whole-chest 4D flow imaging without navigator echo, based on recent acquisition and reconstruction technical developments, and compare the results to conventional 2D PC imaging across large arteries and atrioventricular valves. Measurements from accelerated 4D flow were in good agreement with conventional 2D PC imaging. The accelerated 4D flow technique would improve MRI cost effectiveness, lead to increased clinical adoption, and provide more patient comfort.
INTRODUCTION
MRI four-dimensional (4D) flow imaging allows for thorough evaluation of hemodynamic patterns in large arteries, through the heart valves, and inside the heart chambers, compared to the limited capabilities of conventional two-dimensional (2D) phase-contrast (PC) imaging [1]. Nevertheless, 4D flow imaging is very time consuming from both image acquisition and reconstruction perspectives, such that conventional 4D flow imaging could last as long as 60 minutes.
In this study, we provide preliminary data about accelerated sub-10-minutes whole-chest 4D flow imaging without navigator echo, based on recent technical developments, and compare the results to conventional 2D PC imaging.
METHODS
An advanced 4D flow imaging technique is implemented, which includes a number of acquisition and reconstruction developments, including variable-density k-t sampling and motion suppression using an acquisition-efficient method with increasing signal averaging at the k-space center [2], kat ARC acceleration (Autocalibrating Reconstruction for Cartesian sampling with K- & Adaptive-T-space data synthesis; a spatiotemporal correlation-based auto-calibrating parallel imaging) [3], static tissue removal to eliminate chest wall signal before kat ARC unaliasing [4], and overlapping multi-slab acquisition for inflow blood signal enhancement without using contrast agents. The technique allow for achieving an acceleration factor of 8, which allows for navigator-echo-free whole-chest imaging.
Two healthy subjects were scanned on a GE 3T Premier scanner using the accelerated whole-chest 4D flow imaging sequence with the following imaging parameters: gradient-echo sequence, 3 slabs with 32 location per slab and 5 overlapping locations between adjacent slabs, matrix = 180x180, FOV = 360x360 mm2, spatial resolution = 2x2x2.4 mm3, views per segment = 4, #heart phases = 20, flip angle = 8⁰, readout bandwidth = 488 Hz/pixel, acceleration factor = 8, velocity-encoding (venc) = 160 cm/s, # reconstructed images = 12,480 images, and scan plus inline reconstruction time ~10 minutes.
The subjects were also imaged using conventional 2D PC imaging at 7 locations: ascending aorta, proximal descending aorta, distal descending aorta, main pulmonary artery, right pulmonary artery, mitral valve, and tricuspid valve. The 2D PC imaging parameters were as follows: TR = 6ms, TE = 3.8ms, matrix = 192x160, FOV = 360x360 mm2, slice thickness = 6mm, readout bandwidth = 488 Hz/pixel, flip angle = 25⁰, views per segment = 6, venc = 160cm/s, #heart phases = 30, and scan time = 15s per slice.
The images were processed using Circle cvi42 software, where the 4D flow images were analyzed to measure blood flow at the same planes used in 2D PC acquisition. The following parameters were measured at each imaging site: blood flow, velocity, volume, pressure gradient, valvular regurgitation fraction, forward flow end-timepoint, and ventricular early-to-atrial filling ratio (E/A).
Statistical t-test analysis was conducted to evaluate the significance of the measurement differences between 4D flow and 2D PC (P<.001 considered significant). Further, Bland-Altman analysis was conducted to compare the measurements from both techniques at different locations.
RESULTS
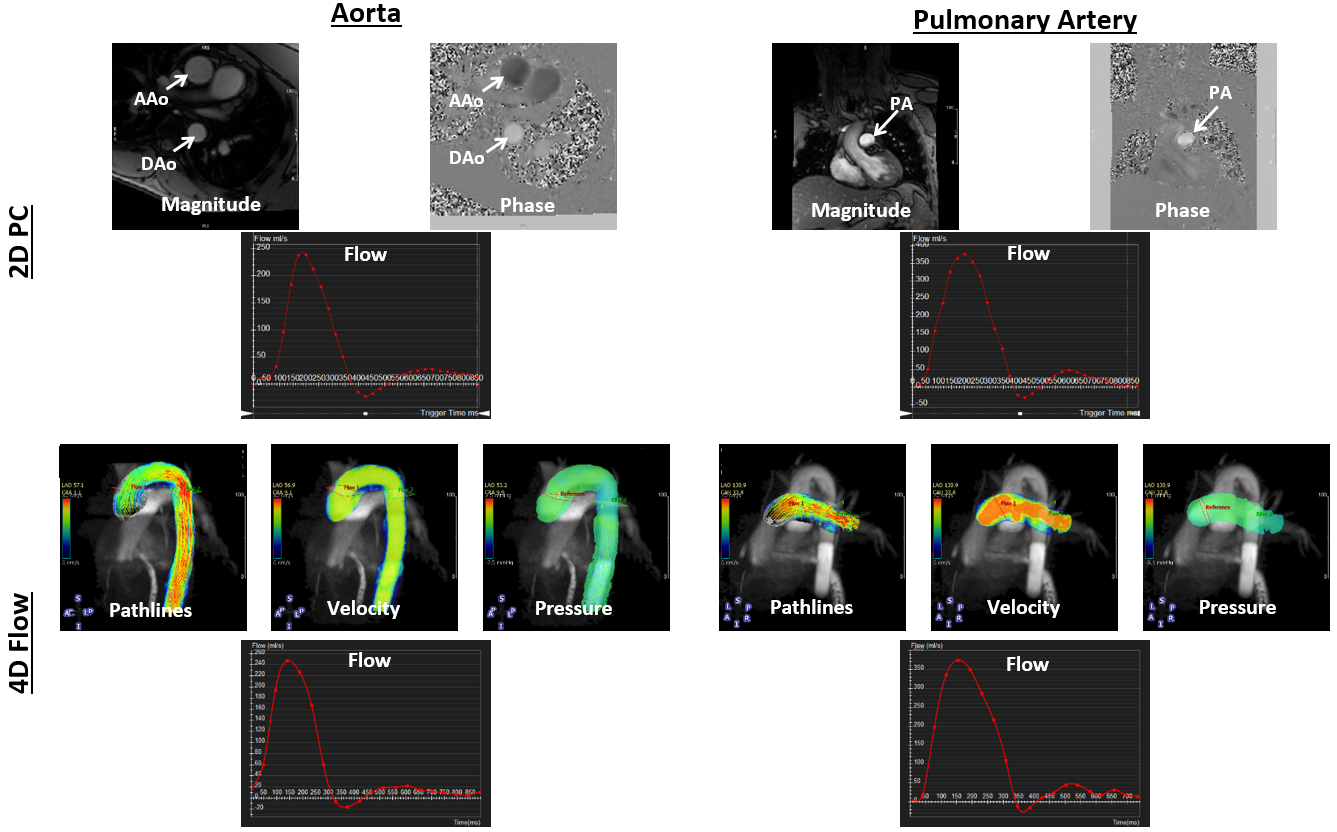
All scans were successfully completed without motion or other artifacts. Figures 1 and 2 show 2D PC results and the corresponding 4D flow maps and flow curves at different measurement sites of large arteries (aorta and pulmonary artery) and atrioventricular valves (mitral and tricuspid), respectively.
The measurements among all imaged locations and studied subjects are summarized in Table 1. Various measurements were within normal ranges reported in the literature. Among all imaged locations and studied subjects, the measurements mean ± standard-deviation (SD) were as follows from 2D PC (4D Flow) imaging: max flow = 301.5±97.2 (299.6±88.7) ml/s; forward volume = 68.1±20.8 (62.5±15) ml; max velocity = 55.2±26.6 (48.9±22.5) cm/s; forward flow end-timepoint = 368±29.5 (341.5±25.2) ms; max pressure gradient = 2.9±1.9 (3.1±1.9) mmHG; mean pressure gradient = 0.6±0.3 (0.6±0.3) mmHG; and E/A ratio = 2.2±0.3 (2.1±0.5).
Statistical t-test showed insignificant differences (P>.001) between paired measurements from both techniques. Bland-Altman plots showed that all measurement differences lying within the 2 SD difference limit (except for a single point in the maximum pressure gradient plot).
DISCUSSION and CONCLUSION
The implemented accelerated 4D flow technique allows for acquiring detailed whole-chest hemodynamic information in less than 10 minutes. Measurements from accelerated 4D flow were in good agreement with conventional 2D PC imaging. As motion correction is not based on navigator echo tracking, the imaging time is known a priori and is not dependent on the breathing pattern.
In conclusion, the significantly short scan time of the accelerated 4D flow technique would improve MRI cost effectiveness, lead to increased clinical adoption, especially in congenital and valvular heart diseases, alleviate the need for cardiac experienced scanner operator, and provide more patient comfort.
Acknowledgements
1. Kramer et al. JCMR 2013
2. Lai et al. ISMRM 2015
3. Lai et al. ISMRM 2009
4. Lai et al. ISMRM 2014
References
No reference found.Figures