0455
4D-Flow MRI and robust local Pulse Wave Velocity allow the detection of alterations in human aortas1Biomedical Imaging Center, Pontificia Universidad Catolica de Chile, Santiago, Chile, 2Millennium Nucleus for Cardiovascular Magnetic Resonance, Santiago, Chile, 3Electrical Engineering, Pontificia Universidad Catolica de Chile, Santiago, Chile, 4Heart Institute, Cincinnati Children's Hospital, Cincinnati, OH, United States, 5Pediatrics, UT Southwestern, Dallas, TX, United States, 6Imaging and Biomedical Engineering, Kings College of London, London, United Kingdom, 7Radiology, Pontificia Universidad Catolica de Chile, Santiago, Chile, 8Institute for Biological and Medical Engineering, Pontificia Universidad Catolica de Chile, Santiago, Chile
Synopsis
An improved version of continuous pulse-wave velocity estimation uses 4D-Flow data with time-delay recovered from a faster formulation using FFT. The novelty also relies upon neglecting regressive time-delay zones, yielding stable and reliable results. Numerical simulations are shown to assess the method. We also present its application in patients with Familial Hypercholesterolemia and Fontan. Consistently with previous findings, adult controls have stiffer aortic walls compared to young controls. Also, Fontan patients appear with stiffer aortic arch than other subjects. More interestingly, all subjects show a softening in the aortic arch respect to the rest of the vessel.
Introduction
Pulse Wave Velocity (PWV) is a biomarker widely used to estimate the global arterial distensibility for several Cardiovascular diseases (CVD). In this study, we present an updated version of a previously introduced method to estimate local PWV measurements1, being more robust and accurate. The method has been tested using Fluid-Structure interaction simulation models and in young and adult volunteers data as well as in patients with Fontan circulation and patients with Familial Hypercholesterolemia. The refined methodology confirms differences in the mean between young and adult controls2. Moreover, we detect an increment of 144% in PWV located in the aortic arch of Fontan patients with repaired aortas, compared to control and Familial-Hypercholesterolemia (FH) patients. More remarkably, we show that in all subjects, aortic arch is softer than descending aorta, and ascending aorta is slightly stiffer than descending aorta.Methods
In most approaches, PWV is derived from time-delay (TD) of a pulse associated with the systolic impulse. We follow the same concept but automating the procedure. After 4D-Flow acquisition and segmentation of aortic morphologies (with our home-made software3), we combine the fast-implicit calculations over distance maps with fast evaluations of cross-correlations performed with an FFT formulation. Thus, the continuous characterization of TD is obtained along the aorta also considering a short sensibility analysis. The key point is to note that some sudden non-causal TD points (this is when the TD-curve is regressive in time) can be related to rapid morphology changes or wave reflections. By neglecting such regions, we can construct a robust local PWV map semi-automatically, without centerlines.
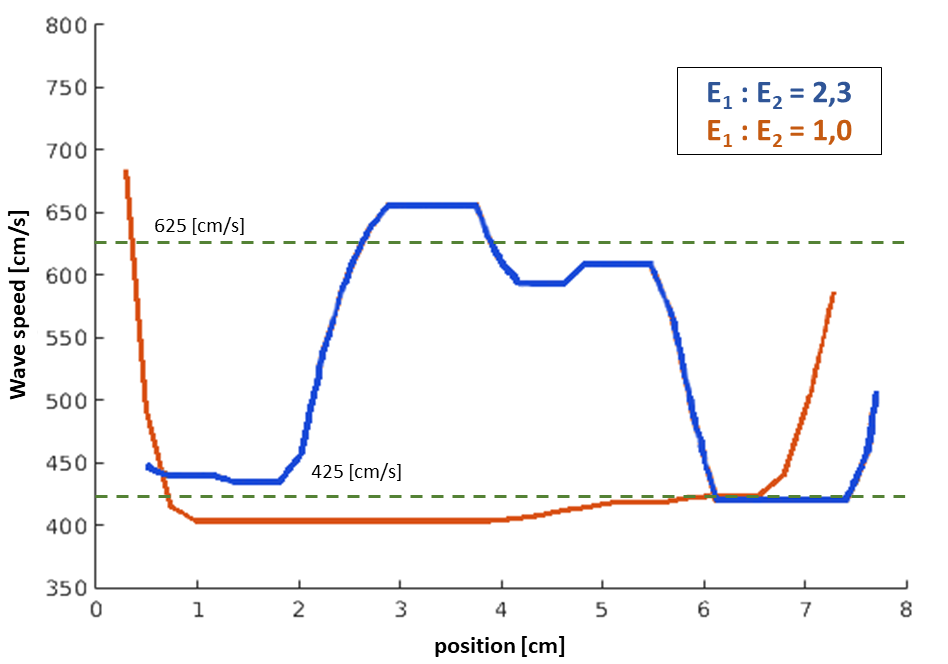
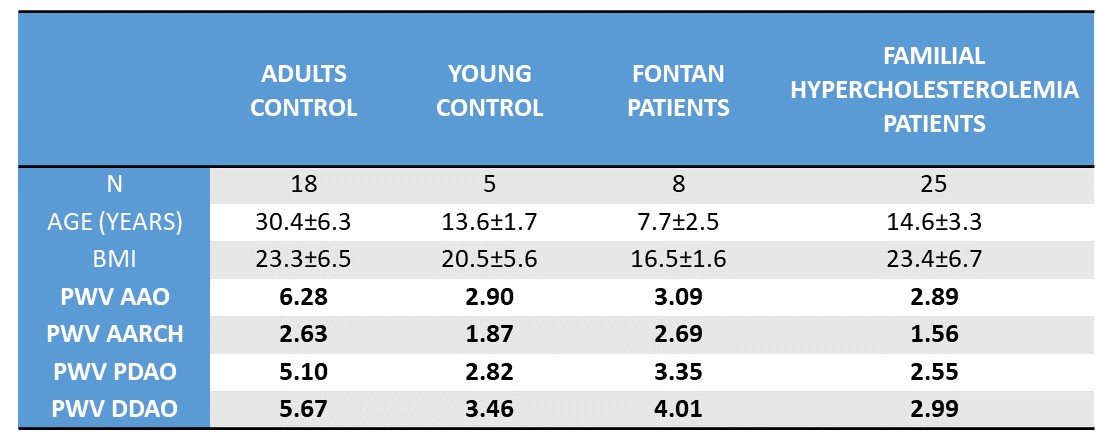
The validation study was carried out considering first numerical simulations (fluid-structure interaction4 with our new validated home-made simulator written in Python+Fenics project library5). Two cases were under consideration. The first case, a straight tube with 1cm of diameter, constant Young modulus E=7,5x10⁵ [dyn/cm2]. In the second case, we choose the same geometry but E=1,75x10⁶ [dyn/cm2] between positions 2,5[cm] and 5,5[cm] from the inlet. A cohort of 33 patients and 23 volunteers were collected using 4D-Flow acquisitions. The volunteers are classified as adults (N=18, age:30,4±6,3 years old, BMI:23,3±6,5) and young (N=5, age: 13,6±1,7 years old, BMI:20,5±5,6). The patients also have two subclasses: Familial-Hypercholesterolemia (FH) (N=25, age:14,6±3,3 years old, BMI:23,4±6,7) and patients with univentricular physiology (Hypoplastic left heart syndrome) after Fontan procedure (N=8, age: 7,7±2,5 years old., BMI:16,5±1,6). We collect 100 waveforms along the aortas using our method, producing 100 points to evaluate TD and then PWV.
Results
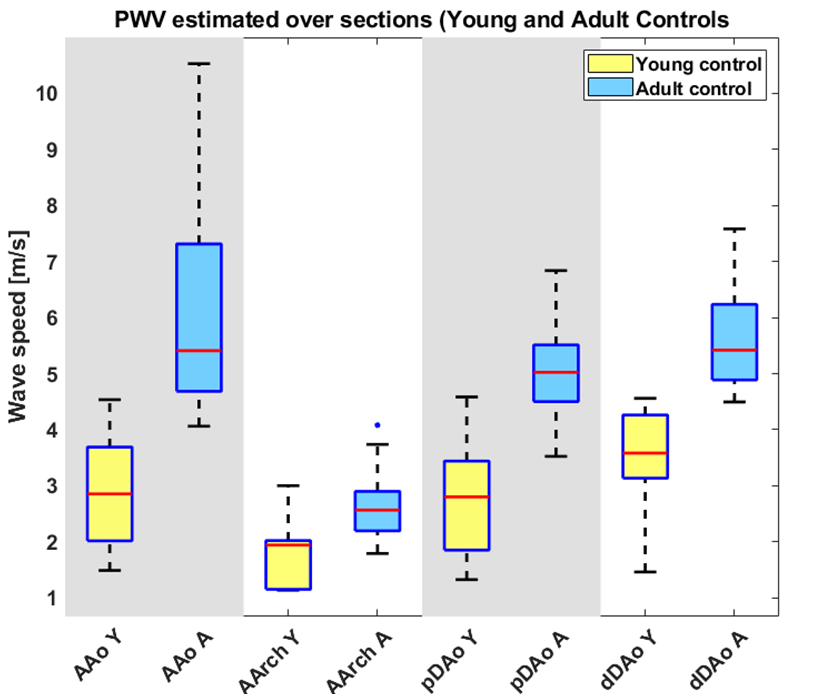
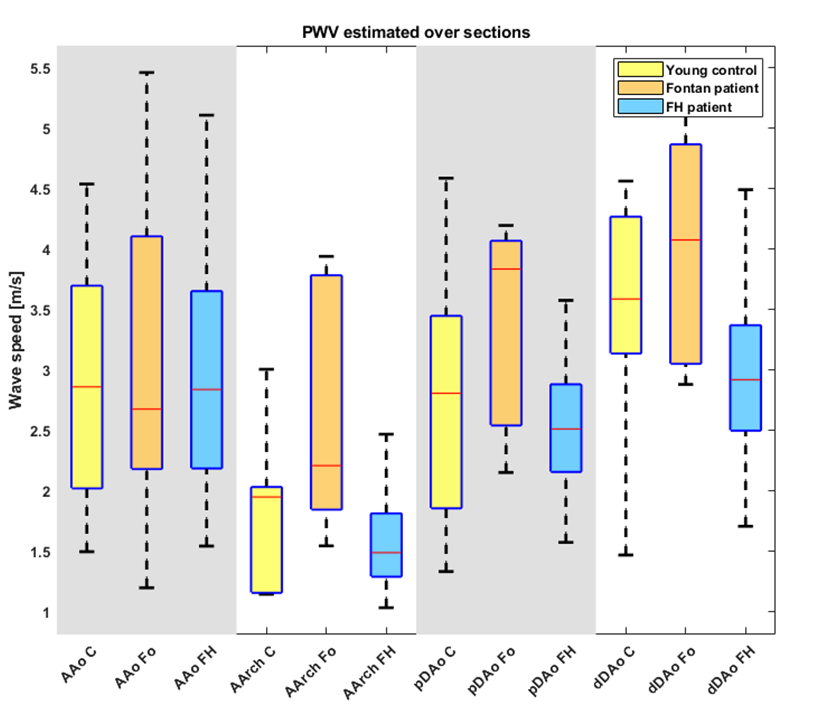
According to the Moens-Korteweg (MK) theory (valid only for small and long straight vessels), PWV is proportional to the square-root of E6. In our simulations, the augmented stiffness produces an increment in a factor 2,33. Thus, the expected increment of PWV is in a factor 1,53=√(2,33). Regarding figure 1, we note that the ratio of approximated mean values per section can be estimated as 625[cm/s]/425[cm/s]=1,47, corresponding to an error below 4% respect to the MK theory. In the case of 4D-Flow data, significant differences were found between control volunteers at different ages (p<0,01 using Wilcoxon signed-rank test). In table 1, the mean values obtained for different subjects. In the case of young-adult comparison, it has been found that they approximately preserve the same trend at different sections in the aorta, having a proportion near a factor 2 regarding the ratio adult-to-young volunteers (mean ages are 30,4 and 13,6, respectively). The comparison between patients and volunteers show that, at least with this technique, it was not possible to detect significant differences between young controls and FH patients. But, a comparison between Fontan patients and Young controls, Fontan patients had increased PWV values in the aortic arch (2,69 compared to 1,87 represent an increment of 144%) and slightly increased in the ascending aorta, corresponding to the areas of intervention.Discussion and Conclusions
Realistic numerical simulations demonstrate that the presented method is capable to localize sharp variations in vessels. Further simulations are required to assess sensibility respect to noise and size of the alterations. In the case of 4D-Flow data, although the comparison with FH patients do not reveal significant differences (also reported7 for global PWV), we still cannot discard the finding of more significant differences, due to the small number of subjects (e.g. N=8 for Fontan patients and N=5 for Young controls). Up to our knowledge, the local and non-invasive characterization of human aortas has not been reported yet using similar non-invasive techniques7,8,9 for Fontan or other conditions, opening interesting perspectives for future studies.Acknowledgements
This publication has received funding from Millenium Science Initiative of the Ministry of Economy, Development and Tourism, grant Nucleus for Cardiovascular Magnetic Resonance. Also, has been supported by CONICYT - PIA - Anillo ACT1416, CONICYT FONDEF/I Concurso IDeA en dos etapas ID15|10284, and FONDECYT # 1181057. Sotelo J. thanks to FONDECYT Postdoctorado 2017 #3170737.References
- Mura J, Sotelo J, Tandon A, Hussain T, Tran A, Tejos C, Uribe S, “Local Pulse Wave Velocity from 4D-Flow MR applied in Familial Hypercholesterolemia patients”. ISMRM annual meeting 2018, poster no.2935, Paris, France.
- Markl M, Wallis W, Brendecke S, Simon J, Frydrychowicz A, and Harloff A, “Estimation of global aortic pulse wave velocity by flow-sensitive 4D MRI”. Magnetic Resonance in Medicine 2010, vol 63(6) pp. 1575-1582.
- Sotelo J, Dux-Santoy L, Guala A, et al. 3D axial and circumferential wall shear stress from 4D flow MRI data using a finite element method and a Laplacian approach. Magnetic Resonance in Medicine 2018, vol. 79(5) pp. 2816-2823.
- Gjertsen S, “Development of a Verified and Validated Computational Framework for Fluid-Structure Interaction: Investigating Lifting Operators and Numerical Stability”. Master Thesis, University of Oslo, 2017.
- Alnaes M-S, Blechta J, Hake J, Johansson A, Kehlet B, A. Logg, C. Richardson, J. Ring, M. E. Rognes and G. N. Wells, “The FEniCS Project Version 1.5”, Archive of Numerical Software, vol. 3, 2015.
- Shahmirzadi D, Li R and Konofagou E, “Pulse-Wave Propagation in Straight-Geometry Vessels for Stiffness Estimation: Theory, Simulations, Phantoms and In Vitro Findings”. J. Biomech Eng 2012, vol 134(11) pp. 1145021-1145026.
- Wentland A, Wieben O, Shanmuganayagam D, Krueger C, Meudt J, Consigny D, Rivera L, McBride P, et. al. “Measurements of wall shear stress and aortic pulse wave velocity in swine with Familial Hypercholesterolemia”. J. Magnetic Resonance Imaging 2015 vol. 41(5) pp. 1475-1485.
- Gotschy A, Bauer W, Winter P, Nordbeck P, Rommel E, Jakob P and Herold V, “Local versus global aortic pulse wave velocity in early atherosclerosis: An animal study in ApoE(-/-)-mice using ultrahigh field MRI”. PLoS ONE 2017 vol. 12 (2) pp. e0171603.
- Apostolakis I, Nandlall S and Konofagou E, “Piecewise Pulse Wave Imaging (pPWI) for Detection and Monitoring of Focal Vascular Disease in Murine Aortas and Carotids in Vivo”. IEEE Transactions on Medical Imaging 2016 vol. 35(1) pp.13-28.
Figures