0448
Silent Magnetization Prepared B1-map Acquisition - SIMBA1Neuroimaging, King's College London, London, United Kingdom, 2General Electric Healthcare, London, United Kingdom, 3ASL Europe, General Electric Healthcare, Munich, Germany
Synopsis
Characterization of the B1-transmit field (B1+) is important for many quantitative imaging techniques. Here, we present a novel, silent, B1+-mapping technique using a magnetization prepared zero-echo time 3D radial sequence. The proposed technique, named SIMBA, is shown to correspond very well to a standard 2D B1+-mapping technique (Bloch-Siegert). The efficacy of the technique is shown by correction of quantitative T1-maps obtained using the variable flip angle method.
Introduction
Mapping of the radio frequency transmit field ($$$B_1^+$$$) is crucial for many quantitative MRI techniques.
Several techniques have been proposed to map
$$$B_1^+$$$ including the
double angle method1, Bloch-Siegert shift2 and the Actual Flip Angle method3. Recent developments in
silent MRI using zero echo time (ZTE) imaging4 allow quantitative
measurements with minimal acoustic noise5,6, but a corresponding silent $$$B_1^+$$$-mapping method is required in order to fully
exploit their potential.
In this work, we present a novel $$$B_1^+$$$-mapping method using magnetization prepared ZTE imaging for silent $$$B_1^+$$$-mapping, named SIMBA - Silent Magnetization prepared B1+-map Acquisition.
Methods
Theory
The proposed $$$B_1^+$$$-mapping technique is an extension of the double angle method, in which instead of varying the excitation flip angle, a magnetization preparation module consisting of RF pulses with varying flip angles is utilized. The preparation module is followed by a strong crusher gradient and a rapid RUFIS7 readout. Spatial variations in $$$B_1^+$$$ will result in varying degree of saturation of the longitudinal magnetization from the preparation pulse, which is reflected in the acquired signal.
Let the $$$B_1^+$$$ field be described by a spatially dependent scale factor $$$\xi(x,y,z)$$$, with no error being $$$\xi=1$$$. Then the longitudinal magnetization after the preparation can be written as
$$M_{SIMBA}(x,y,z)=\cos(\xi(x,y,z)\cdot\alpha_{SIMBA})$$
where $$$\alpha_{SIMBA}$$$ is the flip angle of the preparation pulse. Due to the repeated excitation in the RUFIS readout, the acquired signal $$$M$$$ is linearly dependent on the initial magnetization as
$$M(x,y,z)=A(x,y,z)+B(x,y,z)\cdot M_{SIMBA}(x,y,z)$$
where $$$A$$$ and $$$B$$$ depends on the acquisition parameters as well as T1 and proton density. If three or more measurements with different preparation flip angles $$$\alpha_{SIMBA}$$$ are acquired, the $$$B_1^+$$$-field, $$$\xi(x,y,z)$$$, can be obtained using a non-linear fitting procedure.
The main benefit from the proposed $$$B_1^+$$$-mapping technique is that any type of RF pulse can be utilized. Here, we focus $$$B_1^+$$$-mapping for quantitative RUFIS imaging, which involves ultra-short hard RF pulses. This can be accomplished with SIMBA by making a composite pulse consisting of $$$n$$$ RUFIS-type hard RF pulses with flip angle $$$\alpha_0$$$. With sufficiently short pulse spacing, the train of RF pulses will act as a single composite pulse with $$$\alpha_{SIMBA}=n\cdot\alpha_0$$$ . The schematics of the pulse sequence is outline in figure 1. A delay $$$\tau_r$$$ is introduced between the end of each RUFIS readout and the preparation pulses of the next RUFIS segment in order to allow for T1 recovery.
In vivo Experiments
The SIMBA pulse sequence was implemented on a GE MR750 3T MR scanner. The preparation module consisted of 28μs long RF pulses with $$$\alpha_0=5^\circ$$$, inter-pulse spacing=4$$$\mu$$$s (the shortest permitted), recovery time $$$\tau_r=3$$$s, and $$$n$$$=[0,18,27,36]. A low resolution RUFIS module was used for imaging (voxel size=6x6x6mm3, FOV=192x192x192mm3, 256 spokes per segment, TR=1.2ms, $$$\alpha_1=1^\circ$$$). Total acquisition time was 1min. $$$B_1^+$$$-maps were obtained by projecting the data onto the real axis followed by a non-linear fit to the following signal equation:
$$M(x,y,z)=A(x,y,z)+B(x,y,z)\cdot\cos(\xi(x,y,z)\cdot n\cdot\alpha_0)$$
The method was tested in phantom and volunteer experiments, however only volunteer data will be presented here, as the latter display $$$B_1^+$$$ variations more representative of those we aim to correct. For the volunteer, the silent $$$B_1^+$$$-mapping technique was compared to conventional $$$B_1^+$$$-mapping using the Bloch-Siegert method2. A silent VFA T1-mapping protocol (resolution=1.5x1.5x1.5mm3 resolution, TR=4.4ms, $$$\alpha_1$$$=[2,12]°)5 was acquired to demonstrate the efficacy of the $$$B_1^+$$$-map.
Results
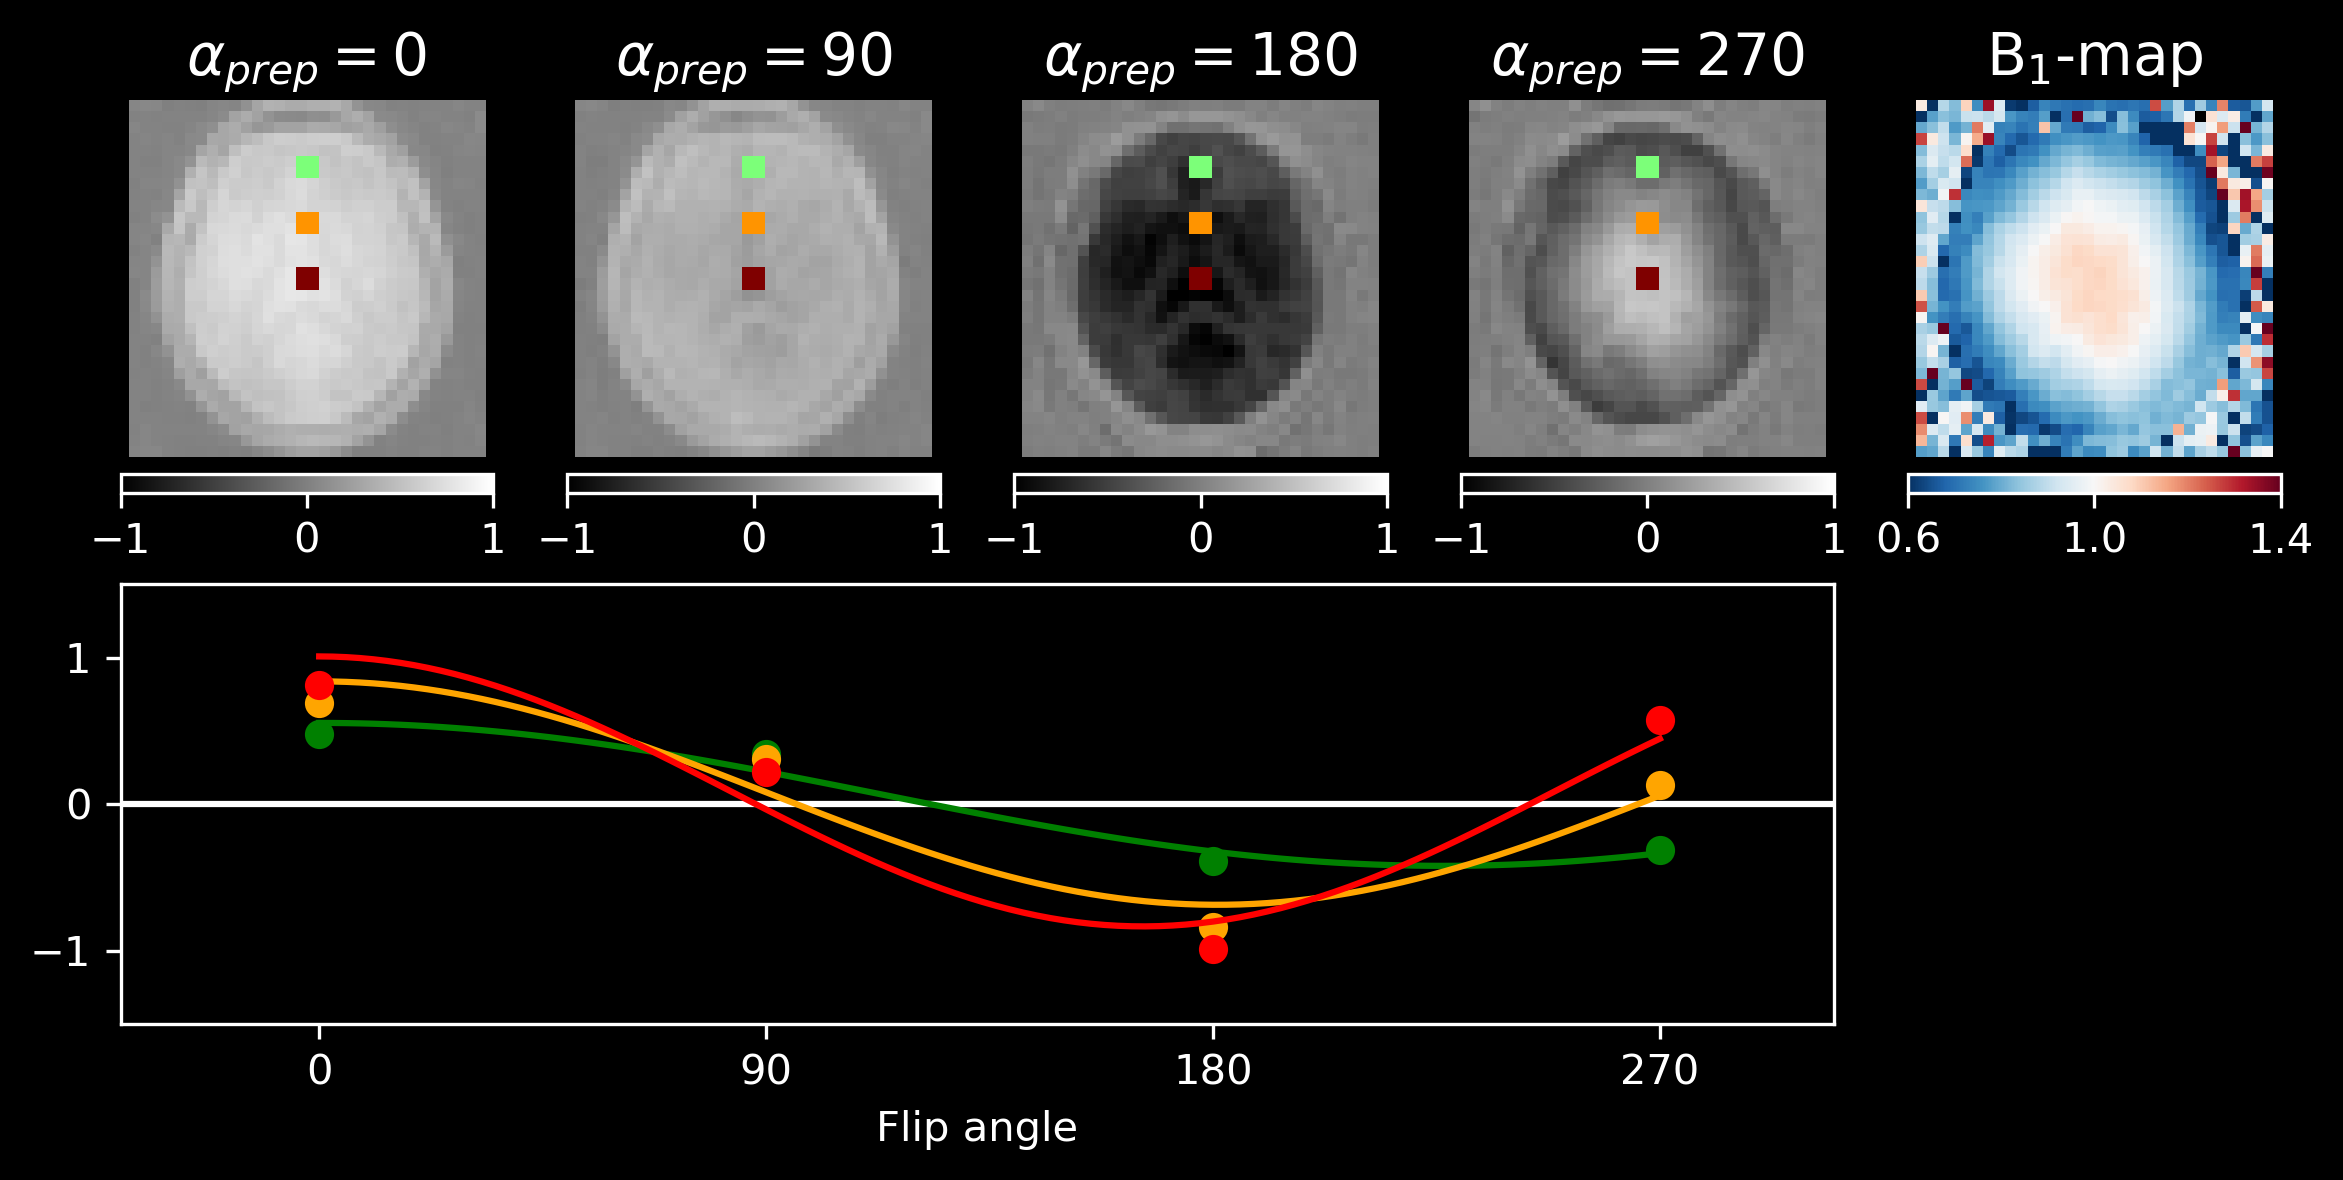
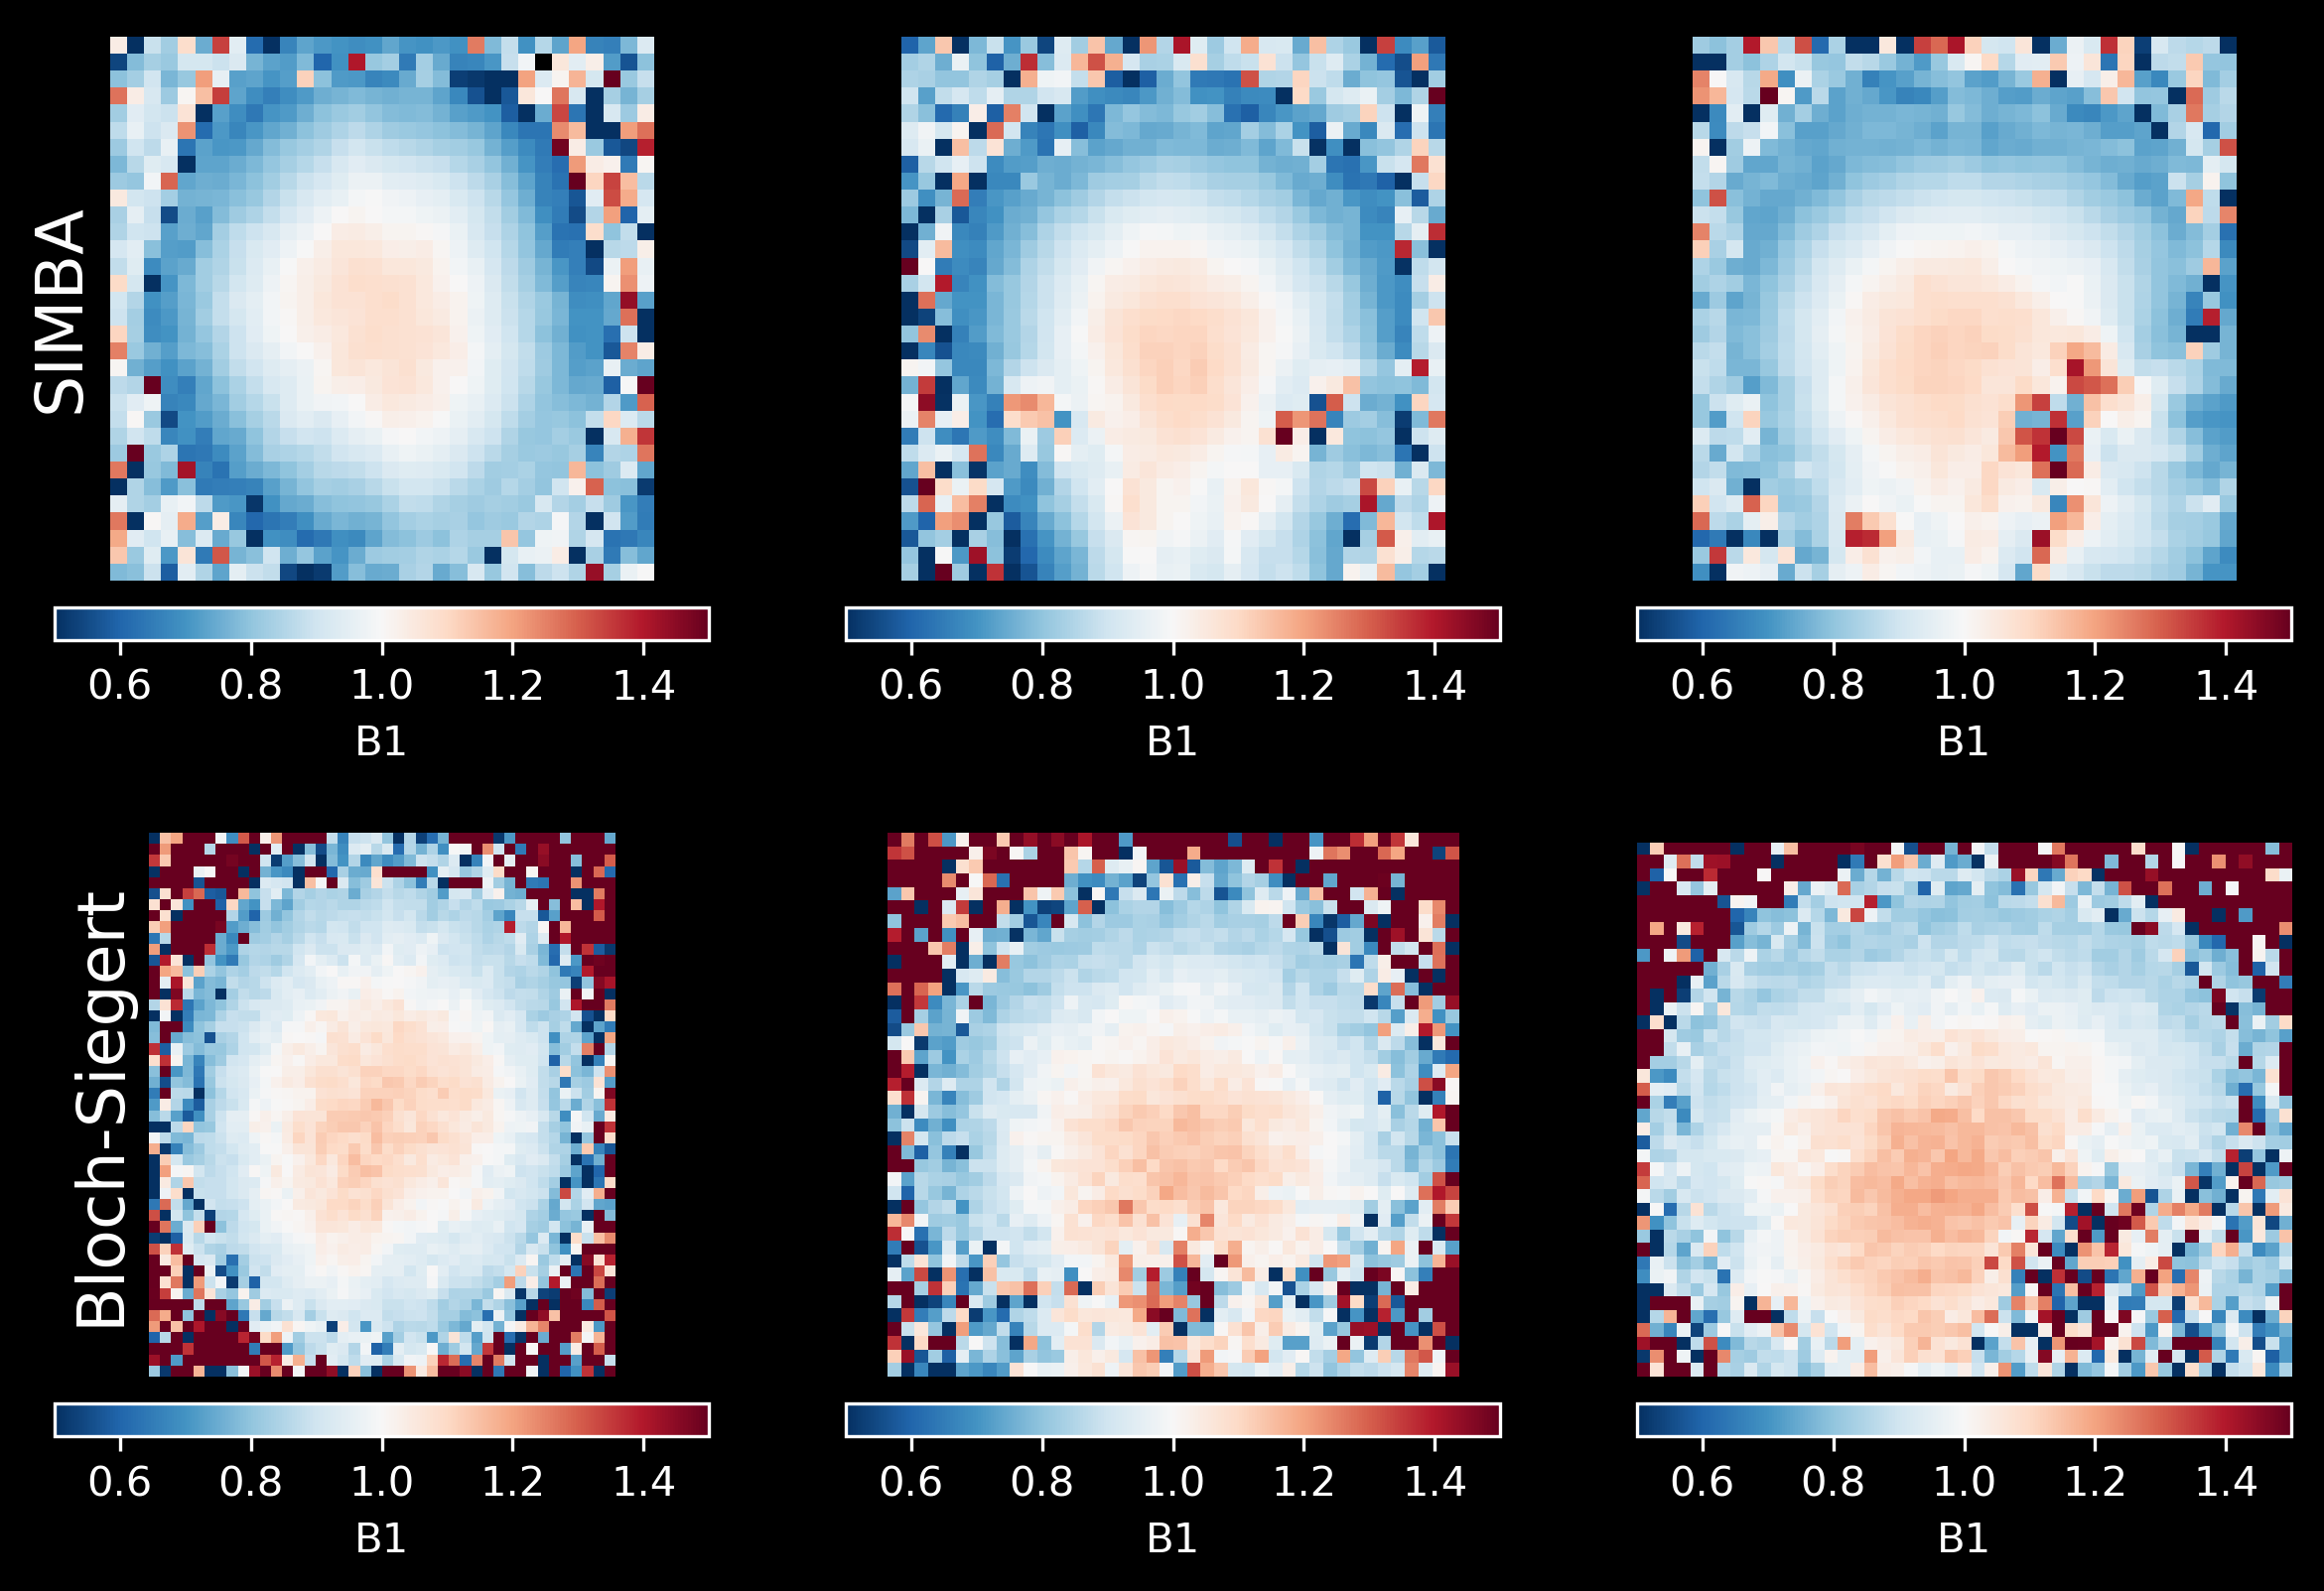
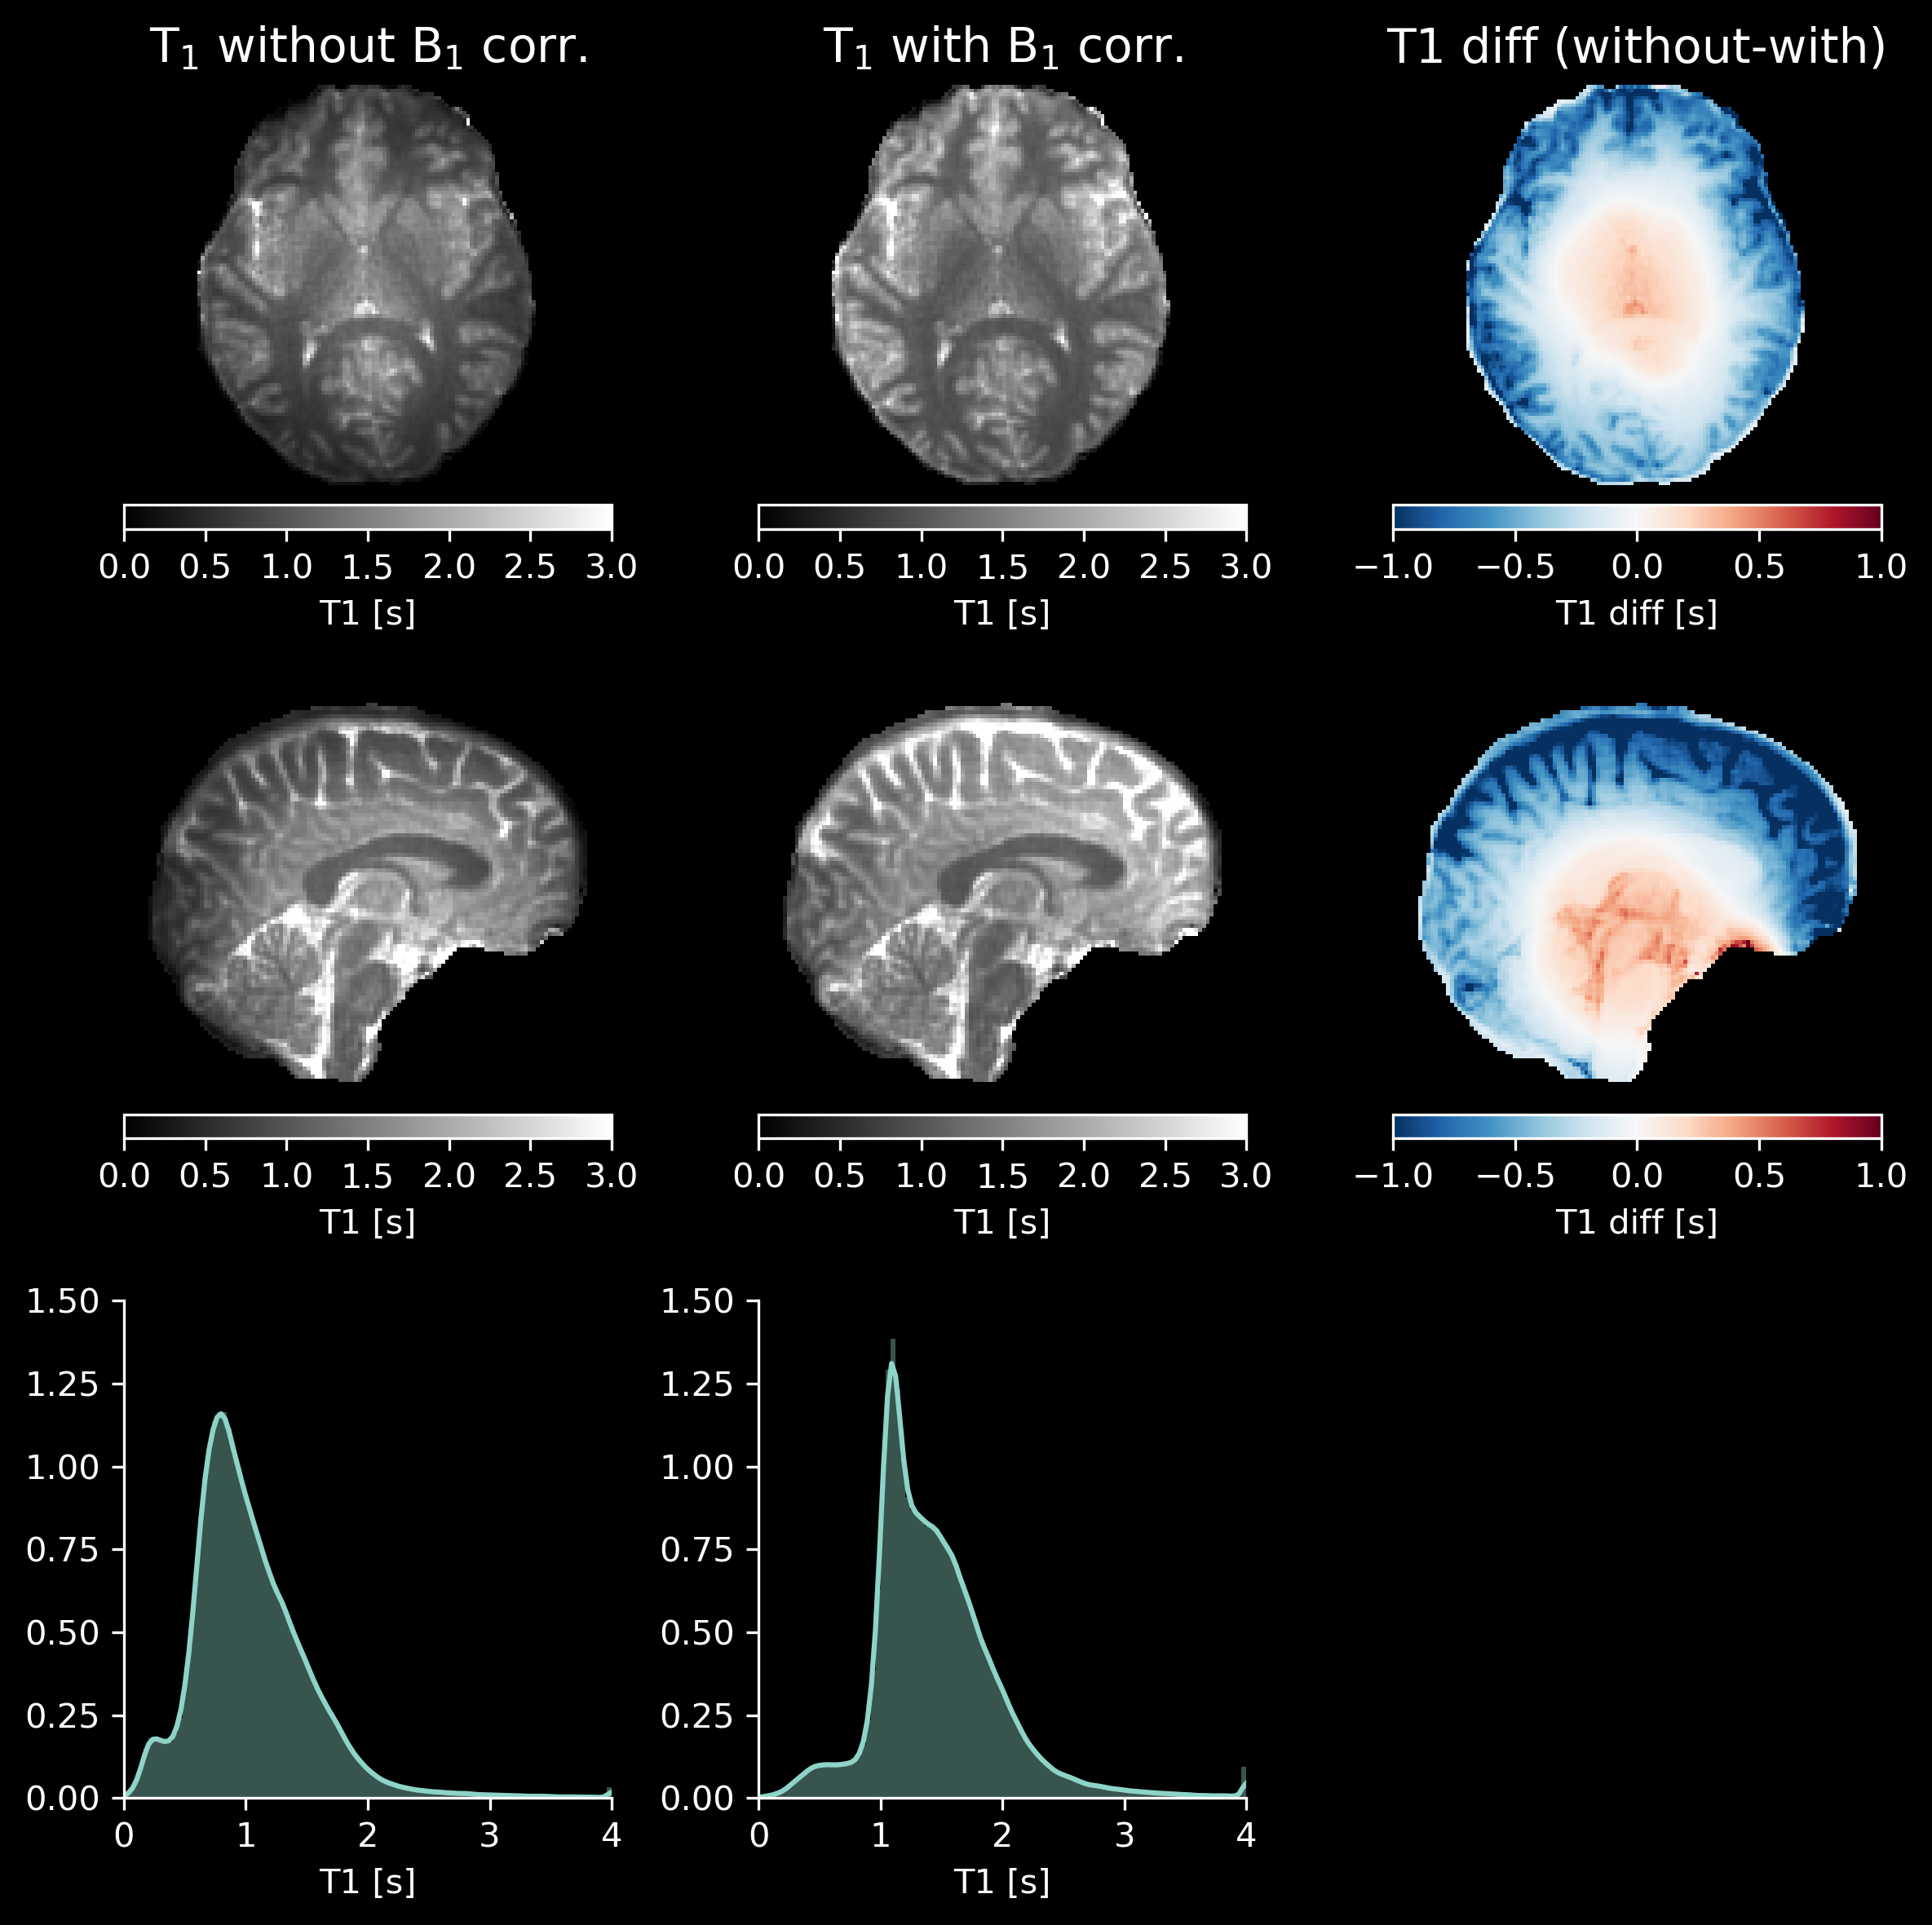
Figure 2 shows the expected contrast changes for the four images in the SIMBA acquisition and how these are combined to fit for $$$B_1^+$$$. The $$$B_1^+$$$-map created using SIMBA is compared to Bloch-Siegert $$$B_1^+$$$-mapping in figure 3, showing a high degree of similarity. The utility of the $$$B_1^+$$$-mapping technique is demonstrated in figure 4, which shows a VFA T1-mapping acquisition with and without $$$B_1^+$$$-correction using SIMBA. Clear improvements can be seen in the uniformity of the T1-maps using the $$$B_1^+$$$-correction, as well as better defined peaks in the T1-histogram.Discussion and Conclusion
We have presented a novel $$$B_1^+$$$-mapping technique, which combines magnetization preparation with a silent ZTE readout module. Qualitatively, $$$B_1^+$$$-maps from the proposed technique compare well with Bloch-Siegert $$$B_1^+$$$-mapping, although further work is needed to fully assess the quantitative agreement. It should be noted that an exact match between our silent $$$B_1^+$$$-map and standard techniques is not expected, as the proposed technique (deliberately) incorporates the effects of any hardware related imperfections in the hard RF pulses. If the RF pulses are not perfectly square, this will show up as an overall offset in the $$$B_1^+$$$-map.
Overall, we believe our silent $$$B_1^+$$$-mapping technique will enable further development of quantitative, silent, ZTE imaging techniques that benefit from an external $$$B_1^+$$$ calibration.
Acknowledgements
This study represents independent research part funded by the NIHR-Wellcome Trust King's Clinical Research Facility and the National Institute for Health Research (NIHR) Biomedical Research Centre at South London and Maudsley NHS Foundation Trust and King’s College London. The views expressed are those of the author(s) and not necessarily those of the NHS, the NIHR or the Department of Health and Social Care. Funding was also received from General Electric Healthcare.References
- Stollberger R, Wach P. Imaging of the active B1 field in vivo. Magn Reson Med. 1996;35:246-251
- Sacolick LI, Wiesinger F, Hancu I, Vogel MW. B1 mapping by Bloch-Siegert shift. Magn Reson Med. 2010;63(5):1315-1322.
- Yarnykh VL. Actual Flip-Angle Imaging in the Pulsed Steady State: A Method for Rapid Three-Dimensional Mapping of the Transmitted Radiofrequency Field. Magn Reson Med. 2007;57:192-200.
- Solana AB, Menini A, Sacolick LI, Hehn N, Wiesinger F. Quiet and Distortion-Free , Whole Brain BOLD fMRI Using T2 -Prepared RUFIS. Magn Reson Med. 2016;75:1402-1412.
- Ljungberg E, Beatriz A, Sanchez S, et al. Silent T1-Mapping Using the Variable Flip Angle Method with Zero Echo Time. In: Proc. Intl. Soc. Mag. Reson. Med 26. Paris; 2018:0270.
- Wiesinger F, Janich MA, Ljungberg E, Barker GJ, Solana AB. Silent, 3D MR Parameter Mapping using Magnetization Prepared Zero TE. In: Proc. Intl. Soc. Mag. Reson. Med 26. Paris; 2018:0061.
- Madio DP, Lowe IJ. Ultra-Fast Imaging Using Low Flip Angles and FIDs. Magn Reson Med. 1995;34(4):525-529.
Figures
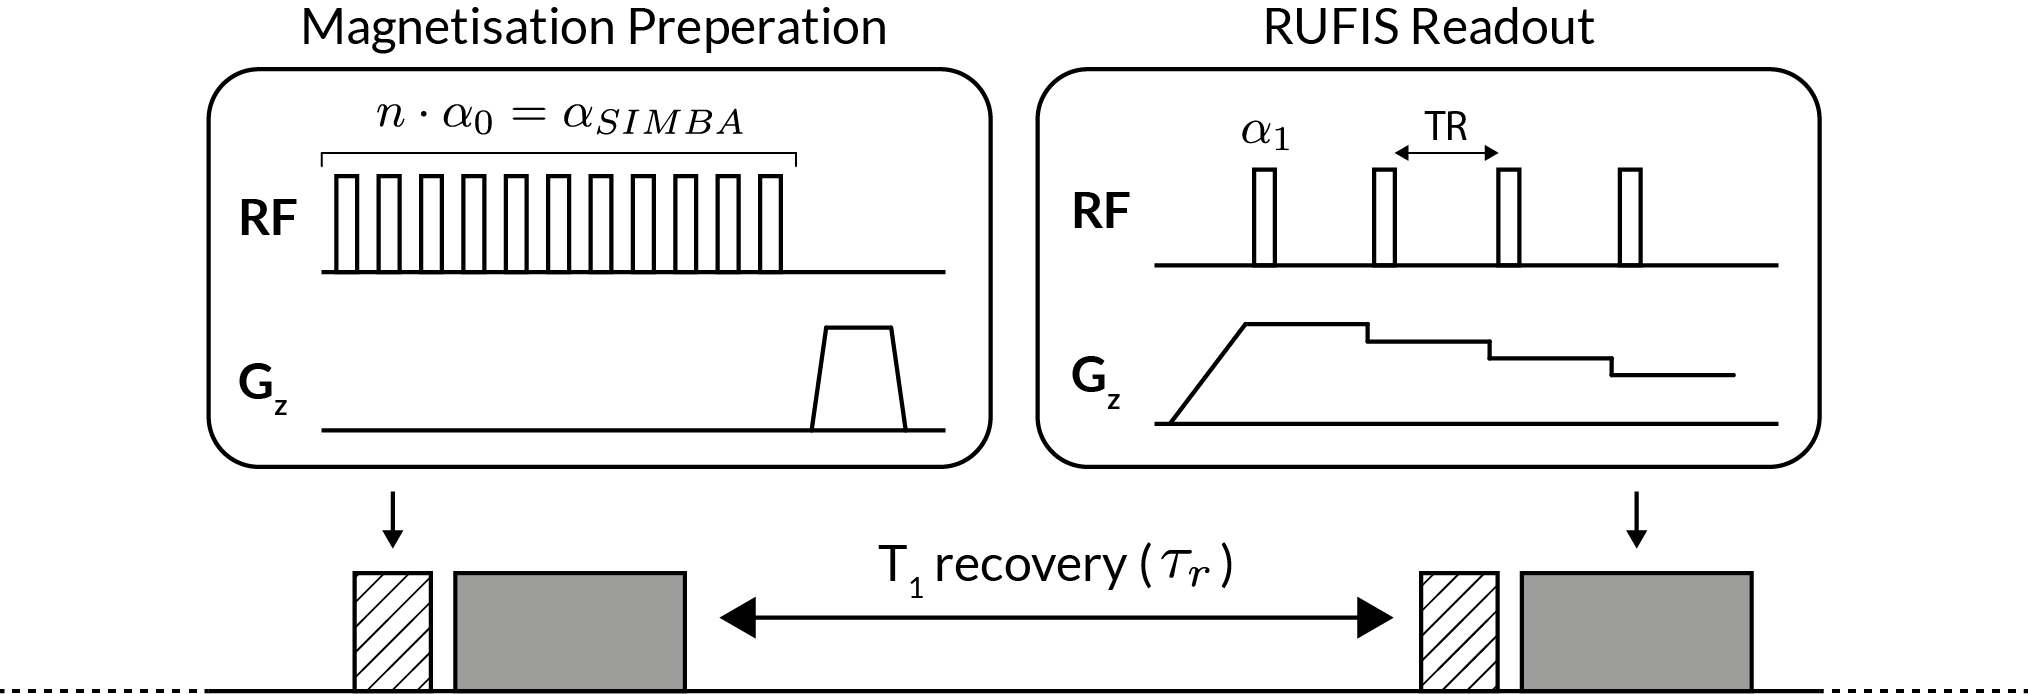
Figure 1: Overview of the pulse sequence showing the magnetization preparation (here as a composite pulse of ultra-short hard RF pulses) and RUFIS readout.